Changes in PRIMAP-hist v2.5.1_final compared to v2.5_final for United Arab Emirates
2024-02-29
Johannes Gütschow
Change analysis for United Arab Emirates for PRIMAP-hist v2.5.1_final compared to v2.5_final
Overview over emissions by sector and gas
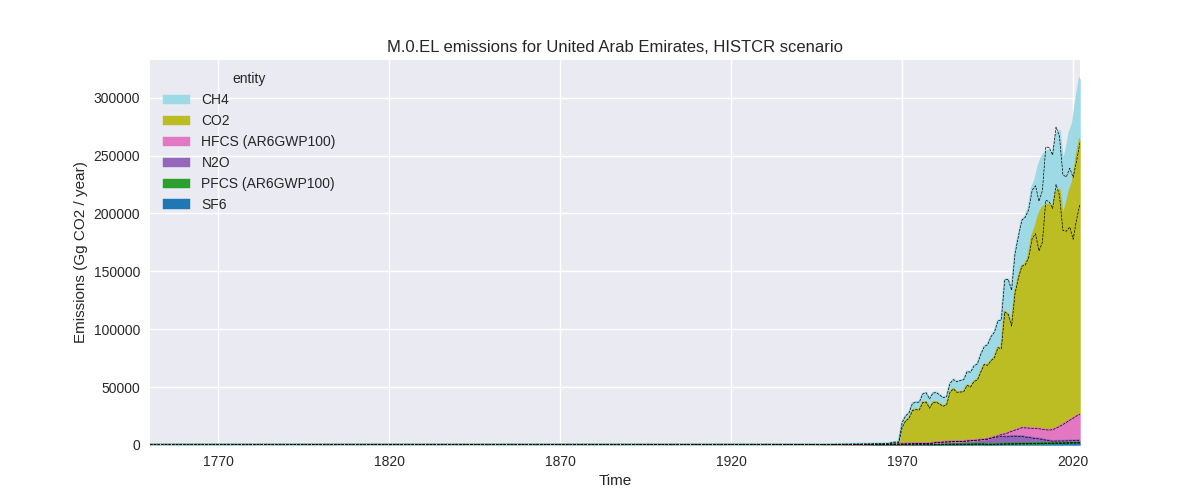
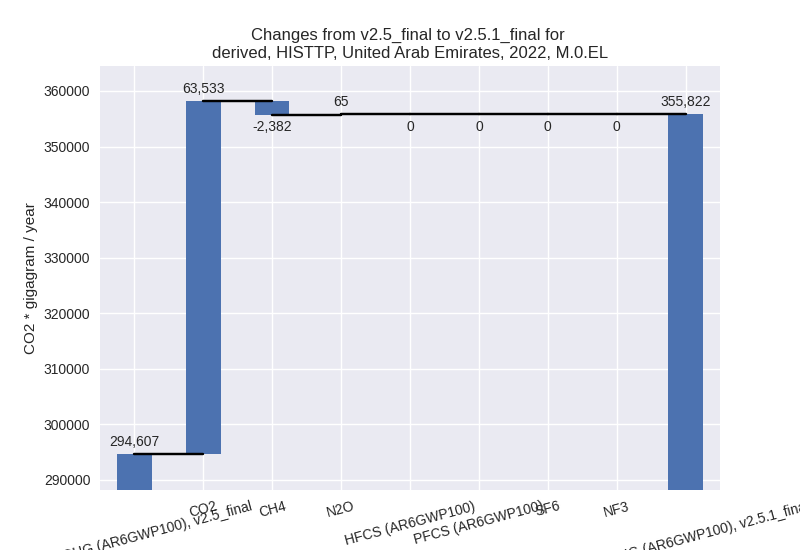
The following figures show the aggregate national total emissions excluding LULUCF AR6GWP100 for the country reported priority scenario. The dotted linesshow the v2.5_final data.


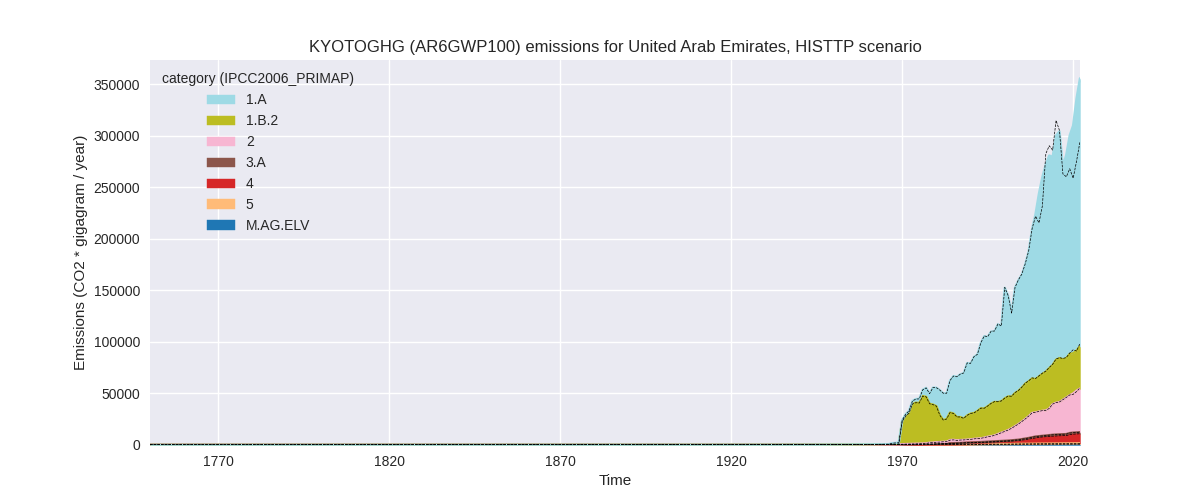
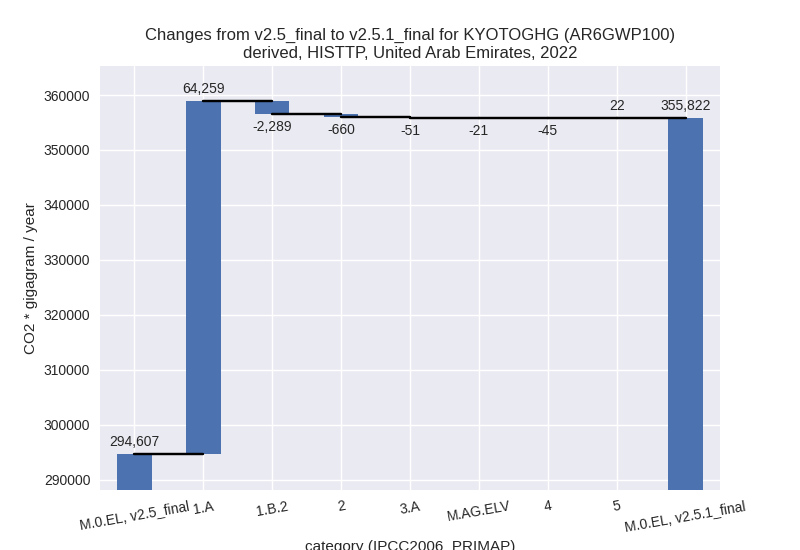
The following figures show the aggregate national total emissions excluding LULUCF AR6GWP100 for the third party priority scenario. The dotted linesshow the v2.5_final data.


Overview over changes
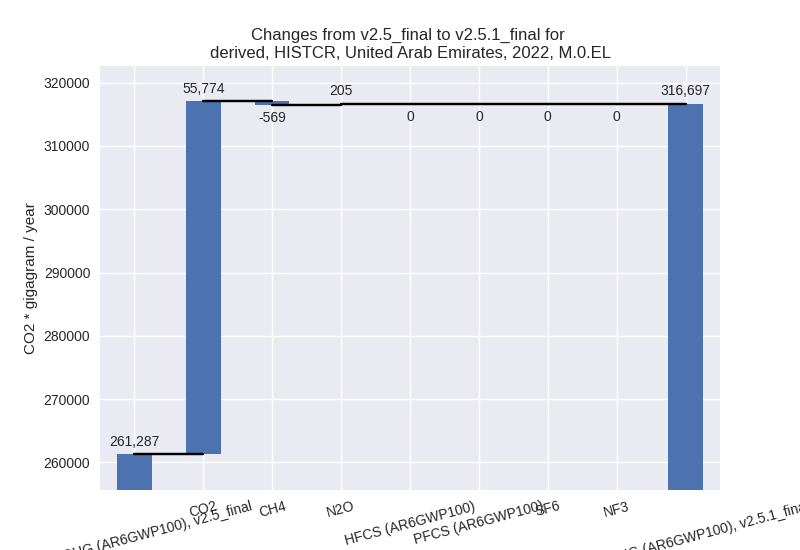
In the country reported priority scenario we have the following changes for aggregate Kyoto GHG and national total emissions excluding LULUCF (M.0.EL):
- Emissions in 2022 have changed by 21.2%% (55410.10 Gg CO2 / year)
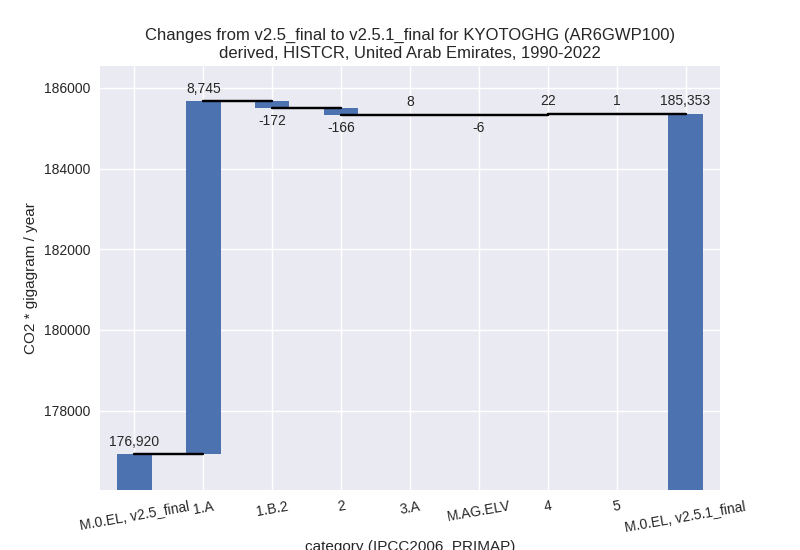
- Emissions in 1990-2022 have changed by 4.8%% (8432.13 Gg CO2 / year)
In the third party priority scenario we have the following changes for aggregate Kyoto GHG and national total emissions excluding LULUCF (M.0.EL):
- Emissions in 2022 have changed by 20.8%% (61214.96 Gg CO2 / year)
- Emissions in 1990-2022 have changed by 3.9%% (7336.63 Gg CO2 / year)
Most important changes per scenario and time frame
In the country reported priority scenario the following sector-gas combinations have the highest absolute impact on national total KyotoGHG (AR6GWP100) emissions in 2022 (top 5):
- 1: 1.A, CO2 with 57502.23 Gg CO2 / year (36.8%)
- 2: 2, CO2 with -1716.81 Gg CO2 / year (-7.4%)
- 3: 1.B.2, CH4 with -1625.65 Gg CO2 / year (-4.5%)
- 4: 4, CH4 with 731.72 Gg CO2 / year (4.7%)
- 5: 3.A, CH4 with 282.15 Gg CO2 / year (28.9%)
In the country reported priority scenario the following sector-gas combinations have the highest absolute impact on national total KyotoGHG (AR6GWP100) emissions in 1990-2022 (top 5):
- 1: 1.A, CO2 with 8740.94 Gg CO2 / year (7.7%)
- 2: 1.B.2, CH4 with -172.31 Gg CO2 / year (-0.7%)
- 3: 2, CO2 with -167.50 Gg CO2 / year (-1.3%)
- 4: 4, CH4 with 22.17 Gg CO2 / year (0.3%)
- 5: M.AG.ELV, CO2 with -8.79 Gg CO2 / year (-100.0%)
In the third party priority scenario the following sector-gas combinations have the highest absolute impact on national total KyotoGHG (AR6GWP100) emissions in 2022 (top 5):
- 1: 1.A, CO2 with 64201.05 Gg CO2 / year (32.9%)
- 2: 1.B.2, CH4 with -2288.60 Gg CO2 / year (-5.6%)
- 3: 2, CO2 with -656.75 Gg CO2 / year (-3.7%)
- 4: 1.A, N2O with 60.28 Gg CO2 / year (15.0%)
- 5: 3.A, CH4 with -50.17 Gg CO2 / year (-3.3%)
In the third party priority scenario the following sector-gas combinations have the highest absolute impact on national total KyotoGHG (AR6GWP100) emissions in 1990-2022 (top 5):
- 1: 1.A, CO2 with 8001.11 Gg CO2 / year (6.2%)
- 2: 1.B.2, CH4 with -533.85 Gg CO2 / year (-1.6%)
- 3: 2, CO2 with -125.28 Gg CO2 / year (-1.2%)
- 4: M.AG.ELV, CO2 with -8.79 Gg CO2 / year (-100.0%)
- 5: 1.A, N2O with 4.09 Gg CO2 / year (1.3%)
Notes on data changes
Here we list notes explaining important emissions changes for the country. ’' means that the following text only applies to the TP time series, while means that it only applies to the CR scenario. Otherwise the note applies to both scenarios.
- 1.A, CO2: Changes 2022 and cumulative emissions come from the updated CDIAC data which shows higher emissions especially after 2015.
- 2, CO2: 2022 emissions are lower because of changes in EDGAR emissions for category 2.3 (metal industry) for recent years. Cumulative emissions are slightly lower.
- 1.B.2, CH4: 2022 and cumulative emissions are lower due to slightly updated EDGAR data for recent years.
Changes by sector and gas
For each scenario and time frame the changes are displayed for all individual sectors and all individual gases. In the sector plot we use aggregate Kyoto GHGs in AR6GWP100. In the gas plot we usenational total emissions without LULUCF. ## country reported scenario
2022

1990-2022

third party scenario
2022
1990-2022


Detailed changes for the scenarios:
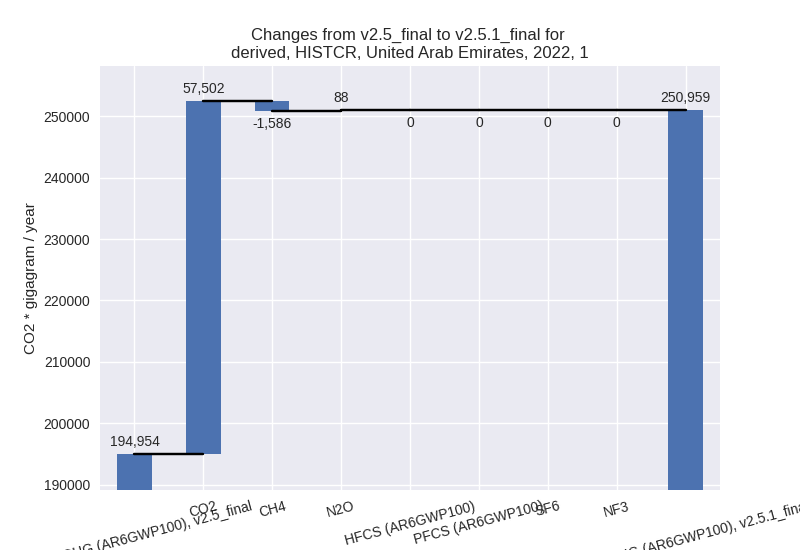
country reported scenario (HISTCR):
Most important changes per time frame
For 2022 the following sector-gas combinations have the highest absolute impact on national total KyotoGHG (AR6GWP100) emissions in 2022 (top 5):
- 1: 1.A, CO2 with 57502.23 Gg CO2 / year (36.8%)
- 2: 2, CO2 with -1716.81 Gg CO2 / year (-7.4%)
- 3: 1.B.2, CH4 with -1625.65 Gg CO2 / year (-4.5%)
- 4: 4, CH4 with 731.72 Gg CO2 / year (4.7%)
- 5: 3.A, CH4 with 282.15 Gg CO2 / year (28.9%)
For 1990-2022 the following sector-gas combinations have the highest absolute impact on national total KyotoGHG (AR6GWP100) emissions in 1990-2022 (top 5):
- 1: 1.A, CO2 with 8740.94 Gg CO2 / year (7.7%)
- 2: 1.B.2, CH4 with -172.31 Gg CO2 / year (-0.7%)
- 3: 2, CO2 with -167.50 Gg CO2 / year (-1.3%)
- 4: 4, CH4 with 22.17 Gg CO2 / year (0.3%)
- 5: M.AG.ELV, CO2 with -8.79 Gg CO2 / year (-100.0%)
Changes in the main sectors for aggregate KyotoGHG (AR6GWP100) are
- 1: Total sectoral emissions in 2022 are 250959.31
Gg CO2 / year which is 79.2% of M.0.EL emissions. 2022 Emissions have
changed by 28.7% (56005.02 Gg CO2 /
year). 1990-2022 Emissions have changed by 6.0% (8572.67 Gg CO2 / year). For 2022 the
changes per gas
are:
For 1990-2022 the changes per gas are: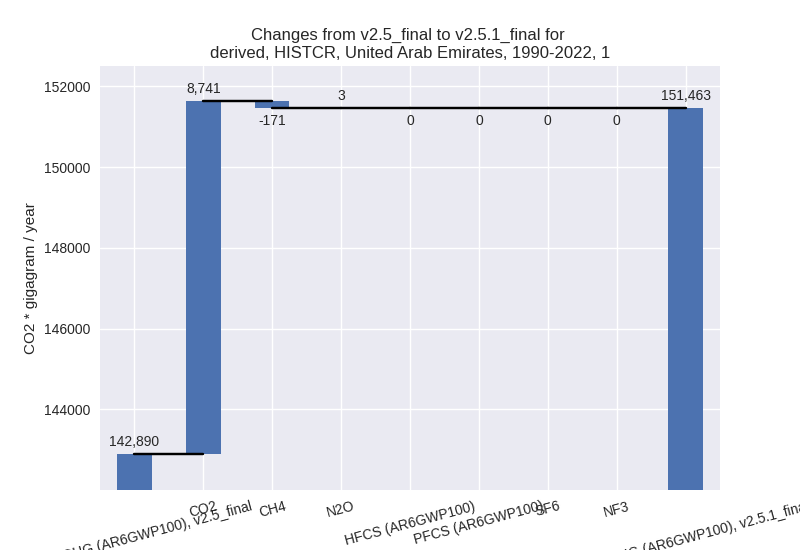
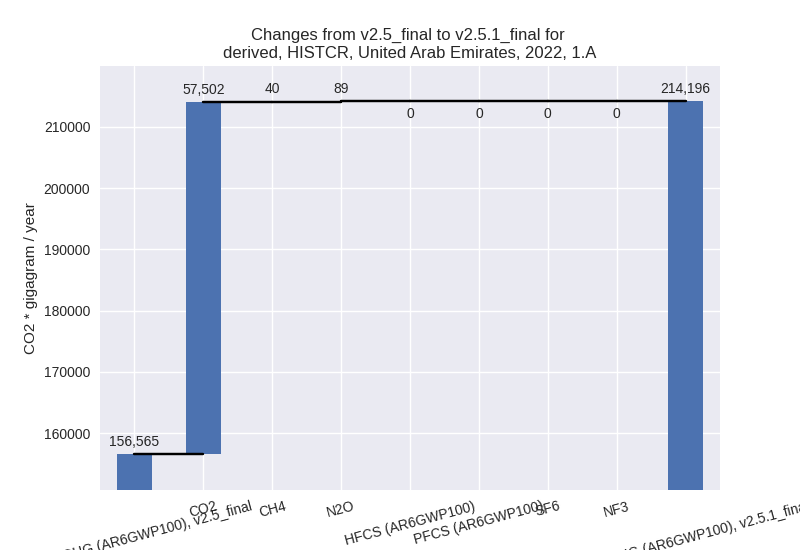
The changes come from the following subsectors:- 1.A: Total sectoral emissions in 2022 are 214196.33
Gg CO2 / year which is 85.4% of category 1 emissions. 2022 Emissions
have changed by 36.8% (57631.42 Gg
CO2 / year). 1990-2022 Emissions have changed by 7.5% (8745.03 Gg CO2 / year). For 2022 the
changes per gas
are:
For 1990-2022 the changes per gas are:
There is no subsector information available in PRIMAP-hist. - 1.B.2: Total sectoral emissions in 2022 are
36762.98 Gg CO2 / year which is 14.6% of category 1 emissions. 2022
Emissions have changed by -4.2%
(-1626.39 Gg CO2 / year). 1990-2022 Emissions have changed by -0.6% (-172.35 Gg CO2 / year). For 2022
the changes per gas
are:

There is no subsector information available in PRIMAP-hist.
- 1.A: Total sectoral emissions in 2022 are 214196.33
Gg CO2 / year which is 85.4% of category 1 emissions. 2022 Emissions
have changed by 36.8% (57631.42 Gg
CO2 / year). 1990-2022 Emissions have changed by 7.5% (8745.03 Gg CO2 / year). For 2022 the
changes per gas
are:
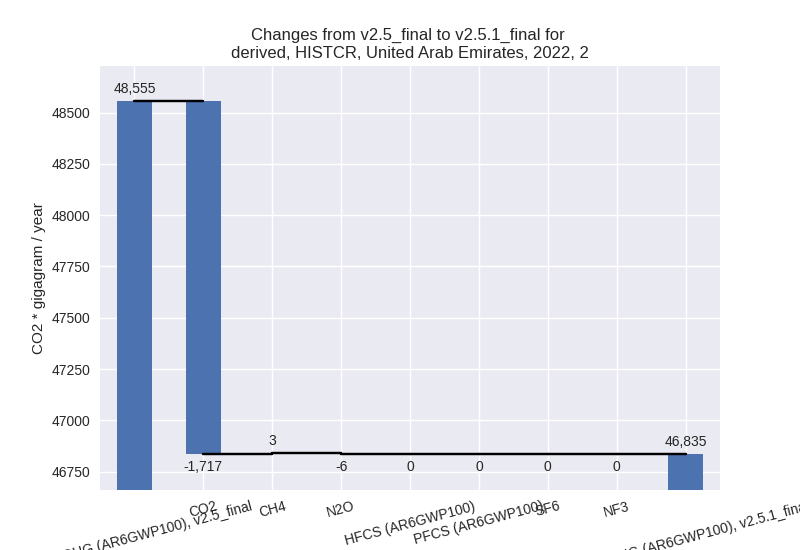
- 2: Total sectoral emissions in 2022 are 46835.04 Gg
CO2 / year which is 14.8% of M.0.EL emissions. 2022 Emissions have
changed by -3.5% (-1719.87 Gg CO2 /
year). 1990-2022 Emissions have changed by -0.8% (-165.66 Gg CO2 / year). For 2022
the changes per gas
are:
- M.AG: Total sectoral emissions in 2022 are 1360.27
Gg CO2 / year which is 0.4% of M.0.EL emissions. 2022 Emissions have
changed by 37.7% (372.40 Gg CO2 /
year). 1990-2022 Emissions have changed by 0.1% (2.32 Gg CO2 / year). For 2022 the
changes per gas
are:

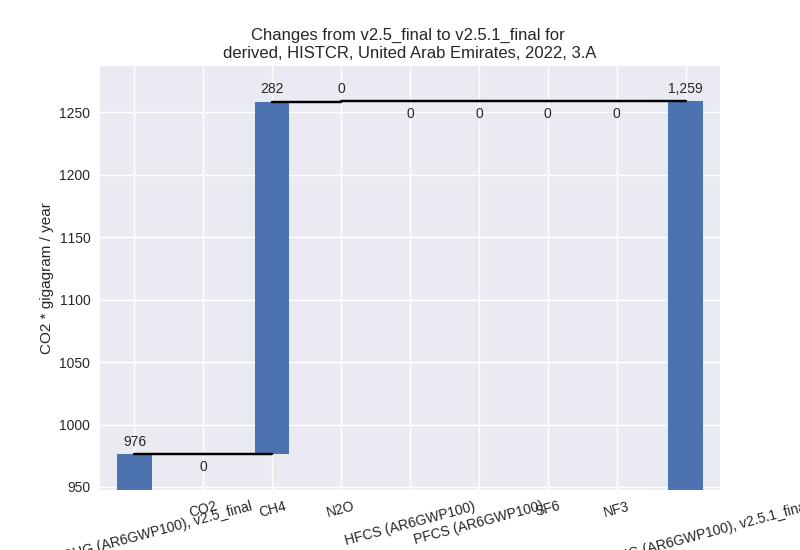
The changes come from the following subsectors:- 3.A: Total sectoral emissions in 2022 are 1258.73
Gg CO2 / year which is 92.5% of category M.AG emissions. 2022 Emissions
have changed by 28.9% (282.49 Gg CO2
/ year). 1990-2022 Emissions have changed by 0.5% (8.08 Gg CO2 / year). For 2022 the
changes per gas
are:
There is no subsector information available in PRIMAP-hist. - M.AG.ELV: Total sectoral emissions in 2022 are
101.54 Gg CO2 / year which is 7.5% of category M.AG emissions. 2022
Emissions have changed by 773.4%
(89.92 Gg CO2 / year). 1990-2022 Emissions have changed by -0.5% (-5.77 Gg CO2 / year). For 2022 the
changes per gas
are:

There is no subsector information available in PRIMAP-hist.
- 3.A: Total sectoral emissions in 2022 are 1258.73
Gg CO2 / year which is 92.5% of category M.AG emissions. 2022 Emissions
have changed by 28.9% (282.49 Gg CO2
/ year). 1990-2022 Emissions have changed by 0.5% (8.08 Gg CO2 / year). For 2022 the
changes per gas
are:
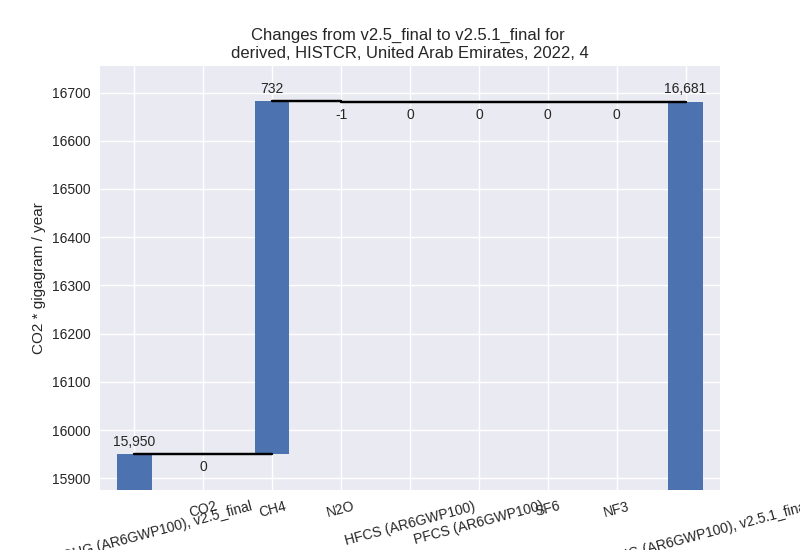
- 4: Total sectoral emissions in 2022 are 16680.62 Gg
CO2 / year which is 5.3% of M.0.EL emissions. 2022 Emissions have
changed by 4.6% (730.49 Gg CO2 /
year). 1990-2022 Emissions have changed by 0.2% (22.14 Gg CO2 / year). For 2022 the
changes per gas
are:
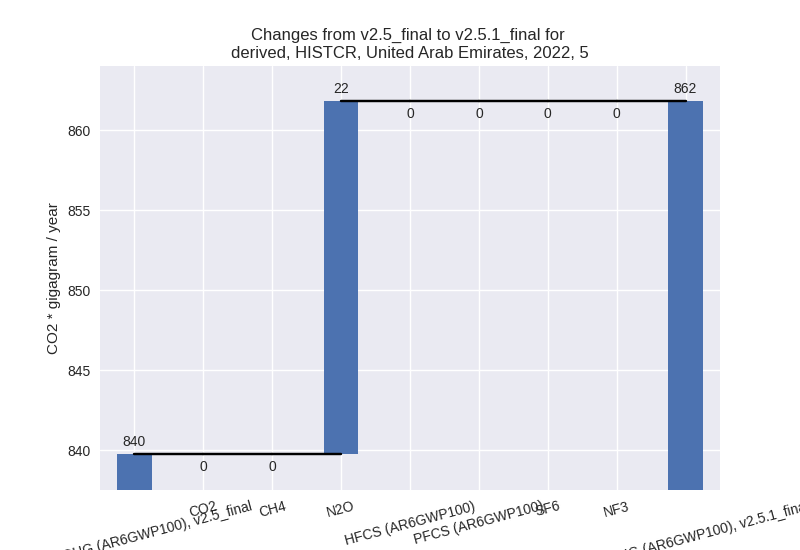
- 5: Total sectoral emissions in 2022 are 861.82 Gg
CO2 / year which is 0.3% of M.0.EL emissions. 2022 Emissions have
changed by 2.6% (22.06 Gg CO2 /
year). 1990-2022 Emissions have changed by 0.1% (0.67 Gg CO2 / year). For 2022 the
changes per gas
are:
third party scenario (HISTTP):
Most important changes per time frame
For 2022 the following sector-gas combinations have the highest absolute impact on national total KyotoGHG (AR6GWP100) emissions in 2022 (top 5):
- 1: 1.A, CO2 with 64201.05 Gg CO2 / year (32.9%)
- 2: 1.B.2, CH4 with -2288.60 Gg CO2 / year (-5.6%)
- 3: 2, CO2 with -656.75 Gg CO2 / year (-3.7%)
- 4: 1.A, N2O with 60.28 Gg CO2 / year (15.0%)
- 5: 3.A, CH4 with -50.17 Gg CO2 / year (-3.3%)
For 1990-2022 the following sector-gas combinations have the highest absolute impact on national total KyotoGHG (AR6GWP100) emissions in 1990-2022 (top 5):
- 1: 1.A, CO2 with 8001.11 Gg CO2 / year (6.2%)
- 2: 1.B.2, CH4 with -533.85 Gg CO2 / year (-1.6%)
- 3: 2, CO2 with -125.28 Gg CO2 / year (-1.2%)
- 4: M.AG.ELV, CO2 with -8.79 Gg CO2 / year (-100.0%)
- 5: 1.A, N2O with 4.09 Gg CO2 / year (1.3%)
Changes in the main sectors for aggregate KyotoGHG (AR6GWP100) are
- 1: Total sectoral emissions in 2022 are 301119.43
Gg CO2 / year which is 84.6% of M.0.EL emissions. 2022 Emissions have
changed by 25.9% (61969.24 Gg CO2 /
year). 1990-2022 Emissions have changed by 4.6% (7471.78 Gg CO2 / year). For 2022 the
changes per gas
are:

For 1990-2022 the changes per gas are:
The changes come from the following subsectors:- 1.A: Total sectoral emissions in 2022 are 260244.21
Gg CO2 / year which is 86.4% of category 1 emissions. 2022 Emissions
have changed by 32.8% (64258.57 Gg
CO2 / year). 1990-2022 Emissions have changed by 6.2% (8005.68 Gg CO2 / year). For 2022 the
changes per gas
are:

For 1990-2022 the changes per gas are:
There is no subsector information available in PRIMAP-hist. - 1.B.2: Total sectoral emissions in 2022 are
40875.21 Gg CO2 / year which is 13.6% of category 1 emissions. 2022
Emissions have changed by -5.3%
(-2289.34 Gg CO2 / year). 1990-2022 Emissions have changed by -1.5% (-533.90 Gg CO2 / year). For 2022
the changes per gas
are:

There is no subsector information available in PRIMAP-hist.
- 1.A: Total sectoral emissions in 2022 are 260244.21
Gg CO2 / year which is 86.4% of category 1 emissions. 2022 Emissions
have changed by 32.8% (64258.57 Gg
CO2 / year). 1990-2022 Emissions have changed by 6.2% (8005.68 Gg CO2 / year). For 2022 the
changes per gas
are:
- 2: Total sectoral emissions in 2022 are 42321.04 Gg CO2 / year which is 11.9% of M.0.EL emissions. 2022 Emissions have changed by -1.5% (-659.81 Gg CO2 / year). 1990-2022 Emissions have changed by -0.6% (-123.45 Gg CO2 / year).
- M.AG: Total sectoral emissions in 2022 are 2223.71
Gg CO2 / year which is 0.6% of M.0.EL emissions. 2022 Emissions have
changed by -3.1% (-71.66 Gg CO2 /
year). 1990-2022 Emissions have changed by -0.7% (-11.01 Gg CO2 / year). For 2022 the
changes per gas
are:

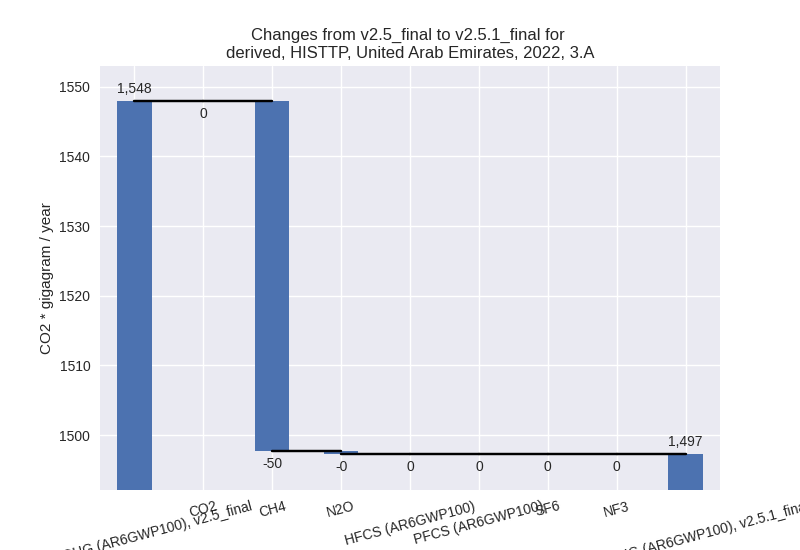
The changes come from the following subsectors:- 3.A: Total sectoral emissions in 2022 are 1497.26
Gg CO2 / year which is 67.3% of category M.AG emissions. 2022 Emissions
have changed by -3.3% (-50.64 Gg CO2
/ year). 1990-2022 Emissions have changed by -0.2% (-2.07 Gg CO2 / year). For 2022 the
changes per gas
are:
There is no subsector information available in PRIMAP-hist. - M.AG.ELV: Total sectoral emissions in 2022 are
726.45 Gg CO2 / year which is 32.7% of category M.AG emissions. 2022
Emissions have changed by -2.8%
(-21.02 Gg CO2 / year). 1990-2022 Emissions have changed by -1.7% (-8.94 Gg CO2 / year). For 2022 the
changes per gas
are:

There is no subsector information available in PRIMAP-hist.
- 3.A: Total sectoral emissions in 2022 are 1497.26
Gg CO2 / year which is 67.3% of category M.AG emissions. 2022 Emissions
have changed by -3.3% (-50.64 Gg CO2
/ year). 1990-2022 Emissions have changed by -0.2% (-2.07 Gg CO2 / year). For 2022 the
changes per gas
are:
- 4: Total sectoral emissions in 2022 are 9296.44 Gg CO2 / year which is 2.6% of M.0.EL emissions. 2022 Emissions have changed by -0.5% (-44.86 Gg CO2 / year). 1990-2022 Emissions have changed by -0.0% (-1.36 Gg CO2 / year).
- 5: Total sectoral emissions in 2022 are 861.82 Gg
CO2 / year which is 0.2% of M.0.EL emissions. 2022 Emissions have
changed by 2.6% (22.06 Gg CO2 /
year). 1990-2022 Emissions have changed by 0.1% (0.67 Gg CO2 / year). For 2022 the
changes per gas
are:
