Changes in PRIMAP-hist v2.5.1_final compared to v2.5_final for Armenia
2024-02-29
Johannes Gütschow
Change analysis for Armenia for PRIMAP-hist v2.5.1_final compared to v2.5_final
Overview over emissions by sector and gas
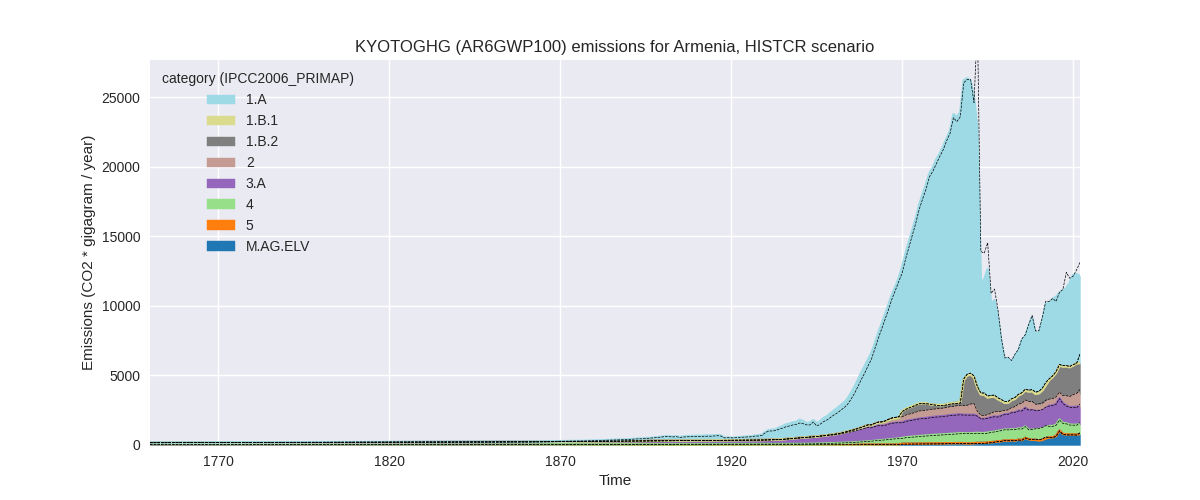
The following figures show the aggregate national total emissions excluding LULUCF AR6GWP100 for the country reported priority scenario. The dotted linesshow the v2.5_final data.

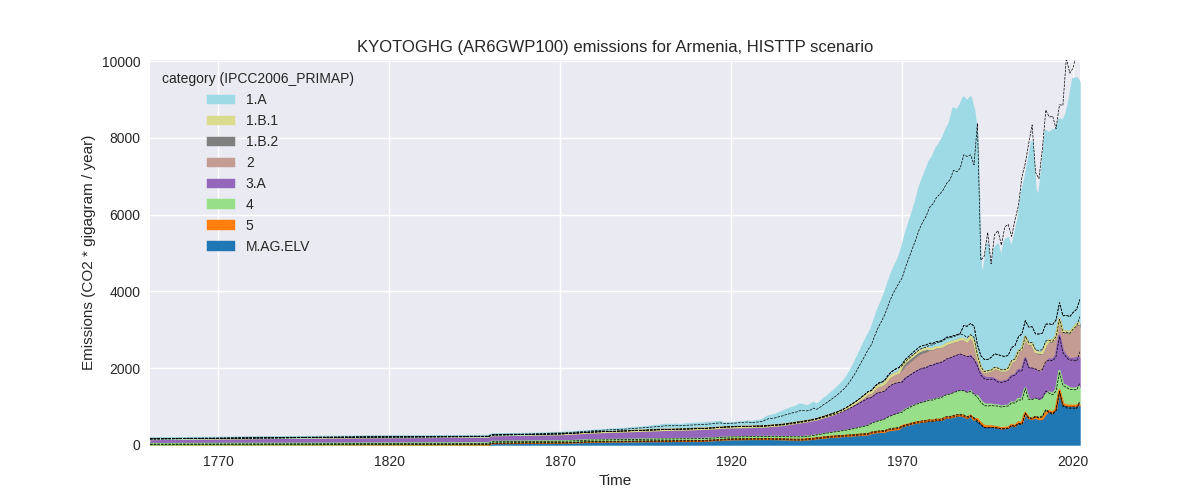
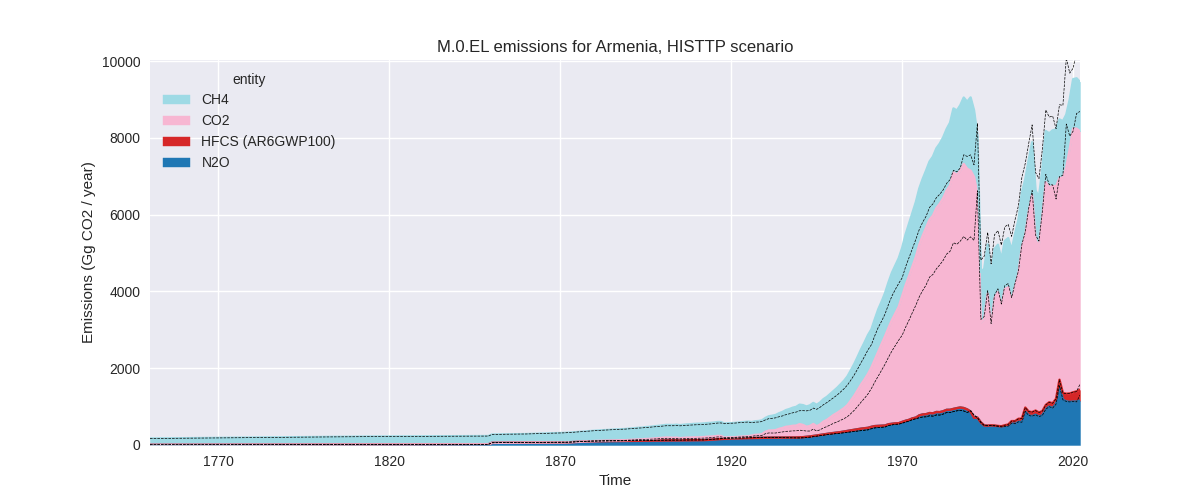
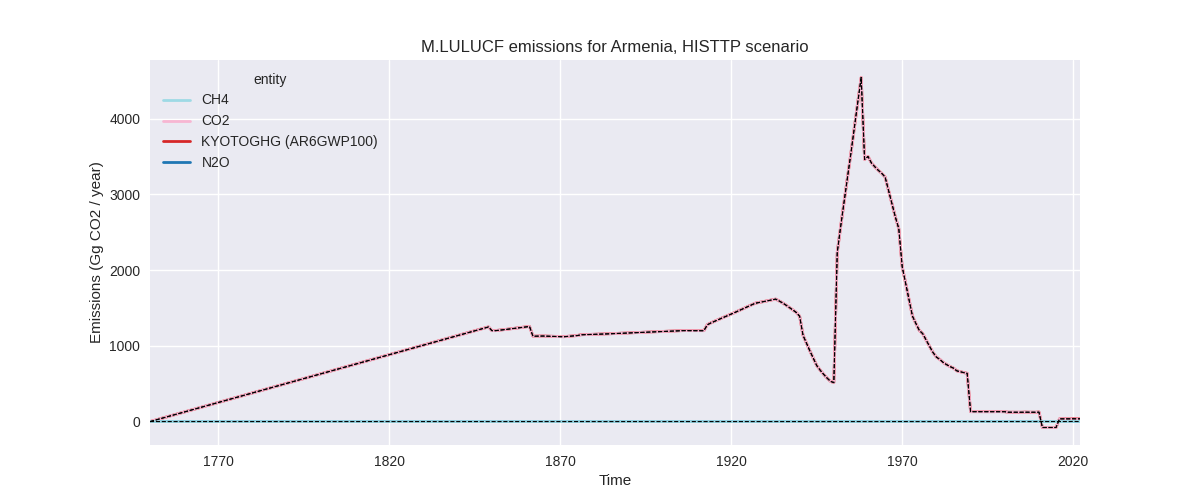
The following figures show the aggregate national total emissions excluding LULUCF AR6GWP100 for the third party priority scenario. The dotted linesshow the v2.5_final data.
Overview over changes
In the country reported priority scenario we have the following changes for aggregate Kyoto GHG and national total emissions excluding LULUCF (M.0.EL):
- Emissions in 2022 have changed by -7.3%% (-962.85 Gg CO2 / year)
- Emissions in 1990-2022 have changed by -5.2%% (-599.97 Gg CO2 / year)
In the third party priority scenario we have the following changes for aggregate Kyoto GHG and national total emissions excluding LULUCF (M.0.EL):
- Emissions in 2022 have changed by -9.2%% (-962.00 Gg CO2 / year)
- Emissions in 1990-2022 have changed by -4.6%% (-337.09 Gg CO2 / year)
Most important changes per scenario and time frame
In the country reported priority scenario the following sector-gas combinations have the highest absolute impact on national total KyotoGHG (AR6GWP100) emissions in 2022 (top 5):
- 1: 1.B.2, CH4 with -330.01 Gg CO2 / year (-13.0%)
- 2: 1.A, CO2 with -303.79 Gg CO2 / year (-4.7%)
- 3: M.AG.ELV, N2O with -125.16 Gg CO2 / year (-14.5%)
- 4: 2, CO2 with -109.50 Gg CO2 / year (-14.5%)
- 5: 3.A, CH4 with -62.36 Gg CO2 / year (-5.1%)
In the country reported priority scenario the following sector-gas combinations have the highest absolute impact on national total KyotoGHG (AR6GWP100) emissions in 1990-2022 (top 5):
- 1: 1.A, CO2 with -483.48 Gg CO2 / year (-6.8%)
- 2: 2, CO2 with -105.63 Gg CO2 / year (-24.9%)
- 3: 1.B.2, CH4 with -14.49 Gg CO2 / year (-1.0%)
- 4: M.AG.ELV, CO2 with 8.82 Gg CO2 / year (34.0%)
- 5: M.AG.ELV, N2O with -2.85 Gg CO2 / year (-0.7%)
In the third party priority scenario the following sector-gas combinations have the highest absolute impact on national total KyotoGHG (AR6GWP100) emissions in 2022 (top 5):
- 1: 1.B.2, CH4 with -351.07 Gg CO2 / year (-79.2%)
- 2: 1.A, CO2 with -302.30 Gg CO2 / year (-4.7%)
- 3: M.AG.ELV, N2O with -121.07 Gg CO2 / year (-11.0%)
- 4: 2, CO2 with -109.19 Gg CO2 / year (-17.4%)
- 5: 3.A, CH4 with -51.63 Gg CO2 / year (-6.6%)
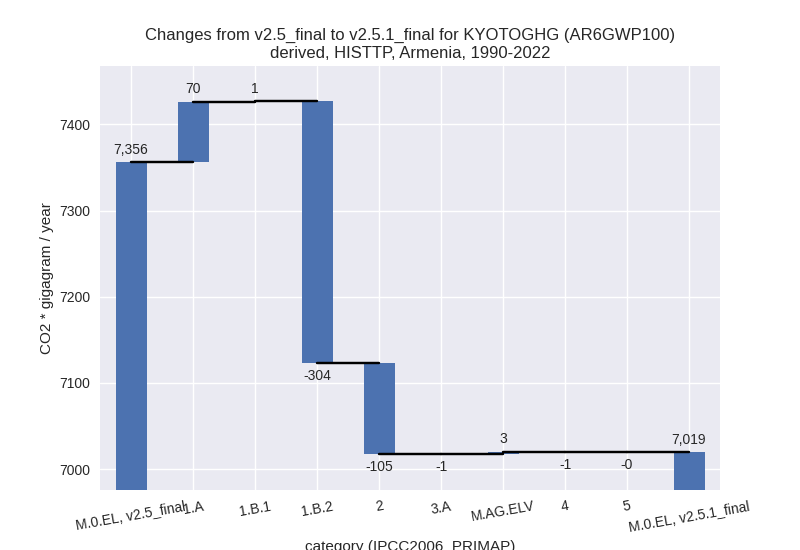
In the third party priority scenario the following sector-gas combinations have the highest absolute impact on national total KyotoGHG (AR6GWP100) emissions in 1990-2022 (top 5):
- 1: 1.B.2, CH4 with -303.63 Gg CO2 / year (-79.5%)
- 2: 2, CO2 with -105.46 Gg CO2 / year (-27.0%)
- 3: 1.A, CO2 with 71.47 Gg CO2 / year (1.6%)
- 4: M.AG.ELV, CO2 with 8.82 Gg CO2 / year (34.0%)
- 5: M.AG.ELV, N2O with -6.09 Gg CO2 / year (-0.9%)
Notes on data changes
Here we list notes explaining important emissions changes for the country. ’' means that the following text only applies to the TP time series, while means that it only applies to the CR scenario. Otherwise the note applies to both scenarios.
- 1.B.2, CH4: EDGAR 8.0 emissions are much lower than EDGAR 7.0 for all years.
- 1.A, CO2: A change in downscaling of CDIAC data for the former Soviet Union to its member states has lowered pre-1990 emissions. The shares are now calculated based on the shares in the first year with data for the individual states instead of a multi year average. This is more realistic as the rapid emissions decline after 1990 differs by country. The new CDIAC data have also changed emissions for the last years.
- 2, CO2: Emissions in 2.D (non-energy products from fuels and solvent use) are much lower in EDGAR 8.0 than in EDGAR 7.0 and thus emissions in PRIMAP-hist v2.5.1 are lower than in v2.5. As there are no country reported data for 2.D, CO2 the CR time-series are affected as well.
Changes by sector and gas
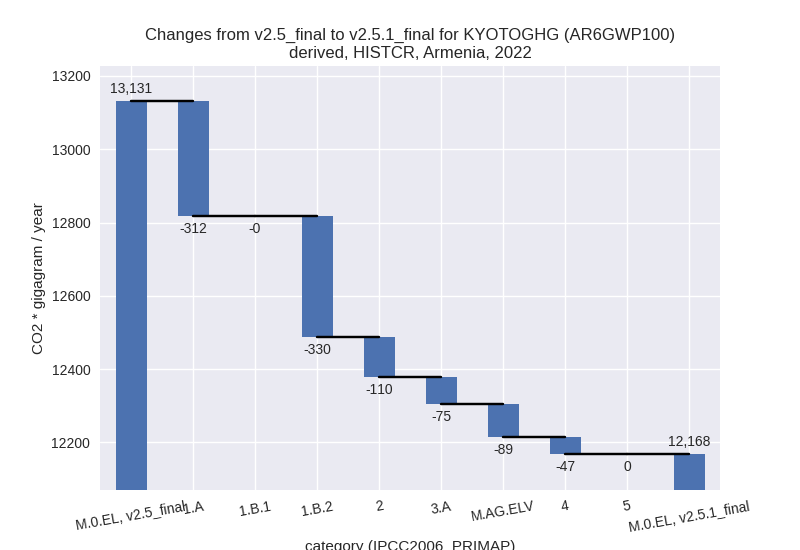
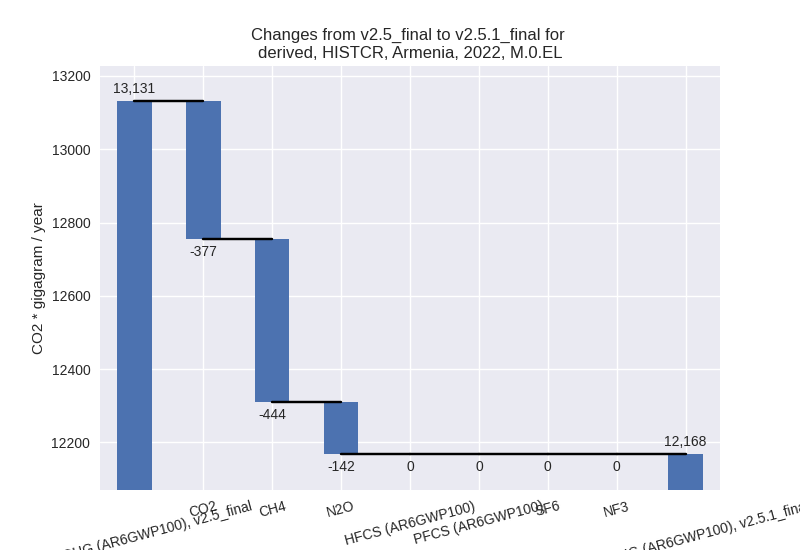
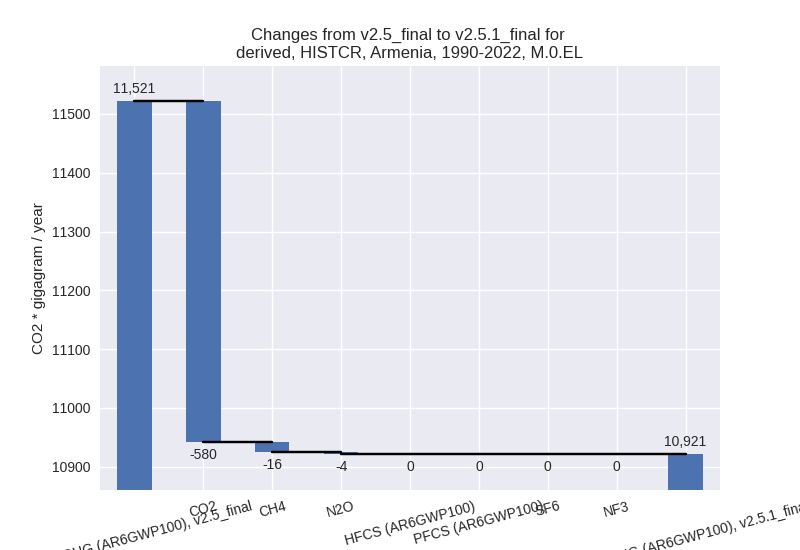
For each scenario and time frame the changes are displayed for all individual sectors and all individual gases. In the sector plot we use aggregate Kyoto GHGs in AR6GWP100. In the gas plot we usenational total emissions without LULUCF. ## country reported scenario
2022
1990-2022

third party scenario
2022


1990-2022

Detailed changes for the scenarios:
country reported scenario (HISTCR):
Most important changes per time frame
For 2022 the following sector-gas combinations have the highest absolute impact on national total KyotoGHG (AR6GWP100) emissions in 2022 (top 5):
- 1: 1.B.2, CH4 with -330.01 Gg CO2 / year (-13.0%)
- 2: 1.A, CO2 with -303.79 Gg CO2 / year (-4.7%)
- 3: M.AG.ELV, N2O with -125.16 Gg CO2 / year (-14.5%)
- 4: 2, CO2 with -109.50 Gg CO2 / year (-14.5%)
- 5: 3.A, CH4 with -62.36 Gg CO2 / year (-5.1%)
For 1990-2022 the following sector-gas combinations have the highest absolute impact on national total KyotoGHG (AR6GWP100) emissions in 1990-2022 (top 5):
- 1: 1.A, CO2 with -483.48 Gg CO2 / year (-6.8%)
- 2: 2, CO2 with -105.63 Gg CO2 / year (-24.9%)
- 3: 1.B.2, CH4 with -14.49 Gg CO2 / year (-1.0%)
- 4: M.AG.ELV, CO2 with 8.82 Gg CO2 / year (34.0%)
- 5: M.AG.ELV, N2O with -2.85 Gg CO2 / year (-0.7%)
Changes in the main sectors for aggregate KyotoGHG (AR6GWP100) are
- 1: Total sectoral emissions in 2022 are 8489.14 Gg
CO2 / year which is 69.8% of M.0.EL emissions. 2022 Emissions have
changed by -7.0% (-642.38 Gg CO2 /
year). 1990-2022 Emissions have changed by -5.8% (-498.21 Gg CO2 / year). For 2022
the changes per gas
are:

For 1990-2022 the changes per gas are:
The changes come from the following subsectors:- 1.A: Total sectoral emissions in 2022 are 6283.35
Gg CO2 / year which is 74.0% of category 1 emissions. 2022 Emissions
have changed by -4.7% (-312.37 Gg
CO2 / year). 1990-2022 Emissions have changed by -6.8% (-484.22 Gg CO2 / year). For 2022
the changes per gas
are:

For 1990-2022 the changes per gas are:
There is no subsector information available in PRIMAP-hist. - 1.B.1: Total sectoral emissions in 2022 are 0.00 Gg
CO2 / year which is 0.0% of category 1 emissions. 2022 Emissions have
changed by -3.5% (-0.00 Gg CO2 /
year). 1990-2022 Emissions have changed by 12190850.8% (0.50 Gg CO2 / year). For 2022
the changes per gas
are:

For 1990-2022 the changes per gas are:
There is no subsector information available in PRIMAP-hist. - 1.B.2: Total sectoral emissions in 2022 are 2205.79
Gg CO2 / year which is 26.0% of category 1 emissions. 2022 Emissions
have changed by -13.0% (-330.01 Gg
CO2 / year). 1990-2022 Emissions have changed by -1.0% (-14.49 Gg CO2 / year). For 2022 the
changes per gas
are:

There is no subsector information available in PRIMAP-hist.
- 1.A: Total sectoral emissions in 2022 are 6283.35
Gg CO2 / year which is 74.0% of category 1 emissions. 2022 Emissions
have changed by -4.7% (-312.37 Gg
CO2 / year). 1990-2022 Emissions have changed by -6.8% (-484.22 Gg CO2 / year). For 2022
the changes per gas
are:
- 2: Total sectoral emissions in 2022 are 936.47 Gg
CO2 / year which is 7.7% of M.0.EL emissions. 2022 Emissions have
changed by -10.5% (-109.89 Gg CO2 /
year). 1990-2022 Emissions have changed by -20.0% (-105.68 Gg CO2 / year). For 2022
the changes per gas
are:

For 1990-2022 the changes per gas are:
- M.AG: Total sectoral emissions in 2022 are 2036.10
Gg CO2 / year which is 16.7% of M.0.EL emissions. 2022 Emissions have
changed by -7.4% (-163.52 Gg CO2 /
year). 1990-2022 Emissions have changed by 0.3% (5.35 Gg CO2 / year). For 2022 the
changes per gas
are:

The changes come from the following subsectors:- 3.A: Total sectoral emissions in 2022 are 1254.83
Gg CO2 / year which is 61.6% of category M.AG emissions. 2022 Emissions
have changed by -5.6% (-74.59 Gg CO2
/ year). 1990-2022 Emissions have changed by -0.0% (-0.63 Gg CO2 / year). For 2022 the
changes per gas
are:
There is no subsector information available in PRIMAP-hist. - M.AG.ELV: Total sectoral emissions in 2022 are
781.26 Gg CO2 / year which is 38.4% of category M.AG emissions. 2022
Emissions have changed by -10.2%
(-88.93 Gg CO2 / year). 1990-2022 Emissions have changed by 1.4% (5.98 Gg CO2 / year). For 2022 the
changes per gas
are:

There is no subsector information available in PRIMAP-hist.
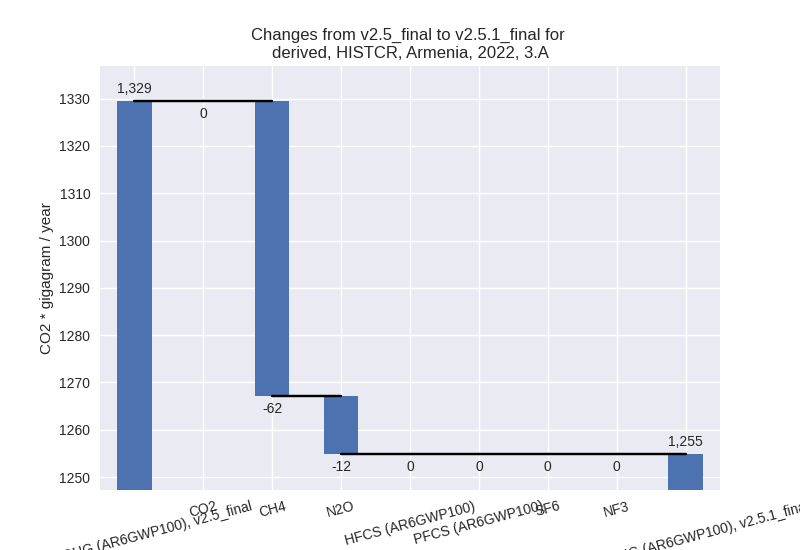
- 3.A: Total sectoral emissions in 2022 are 1254.83
Gg CO2 / year which is 61.6% of category M.AG emissions. 2022 Emissions
have changed by -5.6% (-74.59 Gg CO2
/ year). 1990-2022 Emissions have changed by -0.0% (-0.63 Gg CO2 / year). For 2022 the
changes per gas
are:
- 4: Total sectoral emissions in 2022 are 706.27 Gg
CO2 / year which is 5.8% of M.0.EL emissions. 2022 Emissions have
changed by -6.2% (-47.05 Gg CO2 /
year). 1990-2022 Emissions have changed by -0.2% (-1.43 Gg CO2 / year). For 2022 the
changes per gas
are:

- 5: No data
third party scenario (HISTTP):
Most important changes per time frame
For 2022 the following sector-gas combinations have the highest absolute impact on national total KyotoGHG (AR6GWP100) emissions in 2022 (top 5):
- 1: 1.B.2, CH4 with -351.07 Gg CO2 / year (-79.2%)
- 2: 1.A, CO2 with -302.30 Gg CO2 / year (-4.7%)
- 3: M.AG.ELV, N2O with -121.07 Gg CO2 / year (-11.0%)
- 4: 2, CO2 with -109.19 Gg CO2 / year (-17.4%)
- 5: 3.A, CH4 with -51.63 Gg CO2 / year (-6.6%)
For 1990-2022 the following sector-gas combinations have the highest absolute impact on national total KyotoGHG (AR6GWP100) emissions in 1990-2022 (top 5):
- 1: 1.B.2, CH4 with -303.63 Gg CO2 / year (-79.5%)
- 2: 2, CO2 with -105.46 Gg CO2 / year (-27.0%)
- 3: 1.A, CO2 with 71.47 Gg CO2 / year (1.6%)
- 4: M.AG.ELV, CO2 with 8.82 Gg CO2 / year (34.0%)
- 5: M.AG.ELV, N2O with -6.09 Gg CO2 / year (-0.9%)
Changes in the main sectors for aggregate KyotoGHG (AR6GWP100) are
- 1: Total sectoral emissions in 2022 are 6372.97 Gg
CO2 / year which is 67.4% of M.0.EL emissions. 2022 Emissions have
changed by -9.8% (-693.43 Gg CO2 /
year). 1990-2022 Emissions have changed by -4.8% (-233.15 Gg CO2 / year). For 2022
the changes per gas
are:
For 1990-2022 the changes per gas are: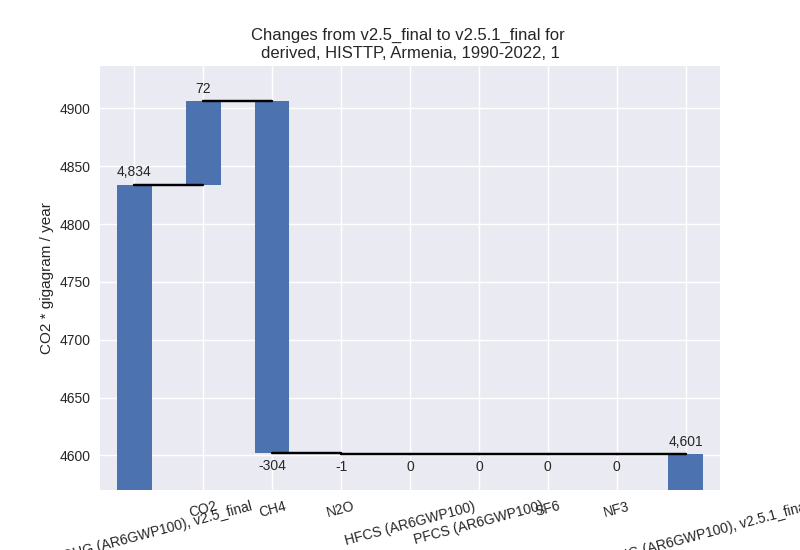
The changes come from the following subsectors:- 1.A: Total sectoral emissions in 2022 are 6280.79
Gg CO2 / year which is 98.6% of category 1 emissions. 2022 Emissions
have changed by -5.2% (-342.35 Gg
CO2 / year). 1990-2022 Emissions have changed by 1.6% (69.70 Gg CO2 / year). For 2022 the
changes per gas
are:

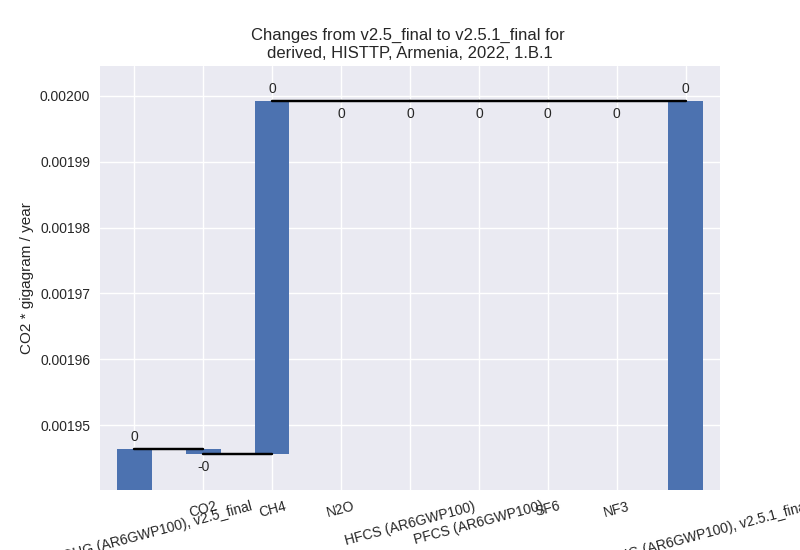
There is no subsector information available in PRIMAP-hist. - 1.B.1: Total sectoral emissions in 2022 are 0.00 Gg
CO2 / year which is 0.0% of category 1 emissions. 2022 Emissions have
changed by 2.7% (0.00 Gg CO2 /
year). 1990-2022 Emissions have changed by 217633.4% (0.78 Gg CO2 / year). For 2022
the changes per gas
are:
For 1990-2022 the changes per gas are: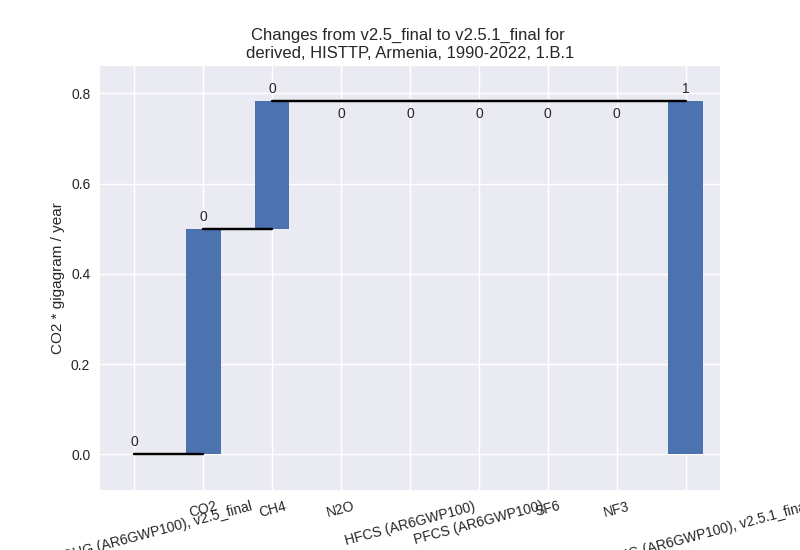
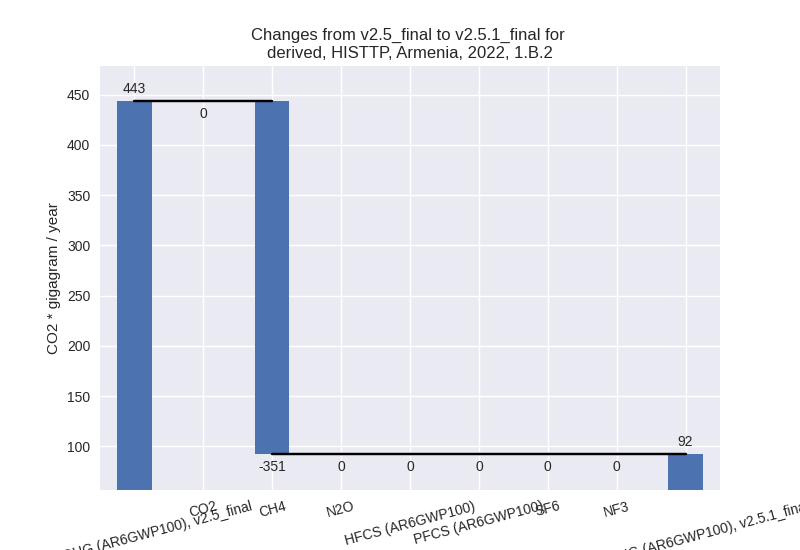
There is no subsector information available in PRIMAP-hist. - 1.B.2: Total sectoral emissions in 2022 are 92.18
Gg CO2 / year which is 1.4% of category 1 emissions. 2022 Emissions have
changed by -79.2% (-351.07 Gg CO2 /
year). 1990-2022 Emissions have changed by -79.5% (-303.63 Gg CO2 / year). For 2022
the changes per gas
are:
For 1990-2022 the changes per gas are:
There is no subsector information available in PRIMAP-hist.
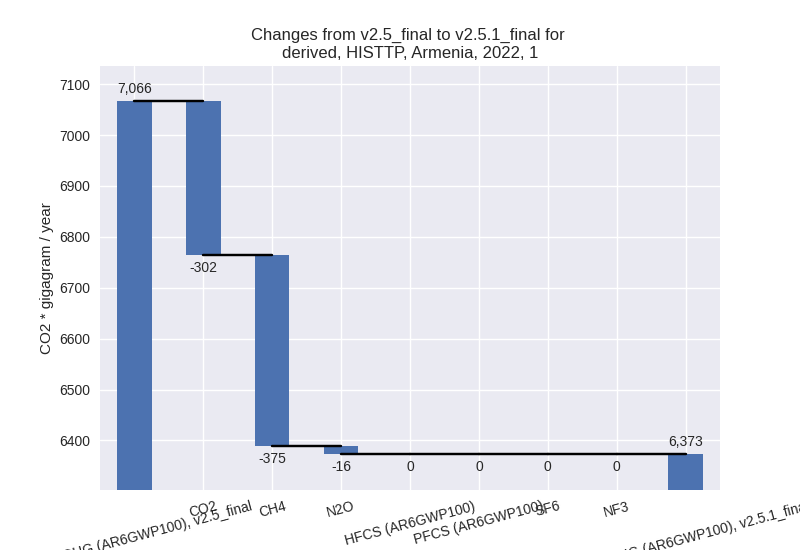
- 1.A: Total sectoral emissions in 2022 are 6280.79
Gg CO2 / year which is 98.6% of category 1 emissions. 2022 Emissions
have changed by -5.2% (-342.35 Gg
CO2 / year). 1990-2022 Emissions have changed by 1.6% (69.70 Gg CO2 / year). For 2022 the
changes per gas
are:
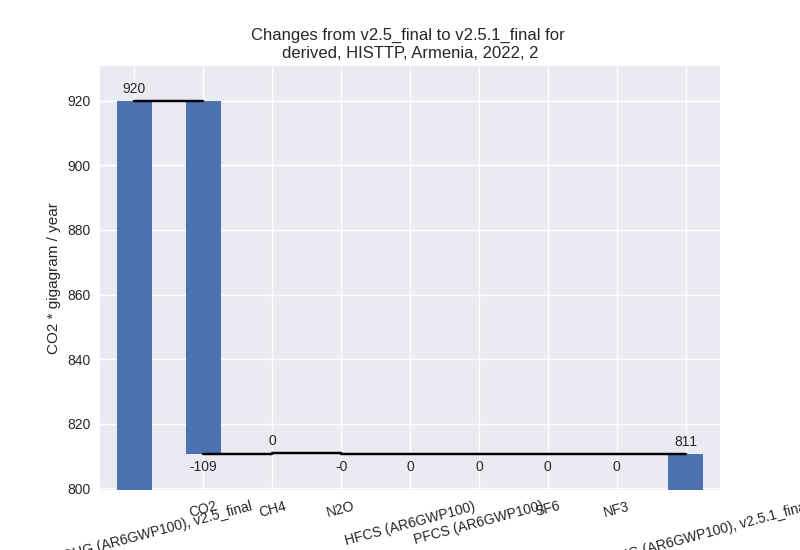
- 2: Total sectoral emissions in 2022 are 810.53 Gg
CO2 / year which is 8.6% of M.0.EL emissions. 2022 Emissions have
changed by -11.9% (-109.31 Gg CO2 /
year). 1990-2022 Emissions have changed by -21.3% (-105.43 Gg CO2 / year). For 2022
the changes per gas
are:
For 1990-2022 the changes per gas are:
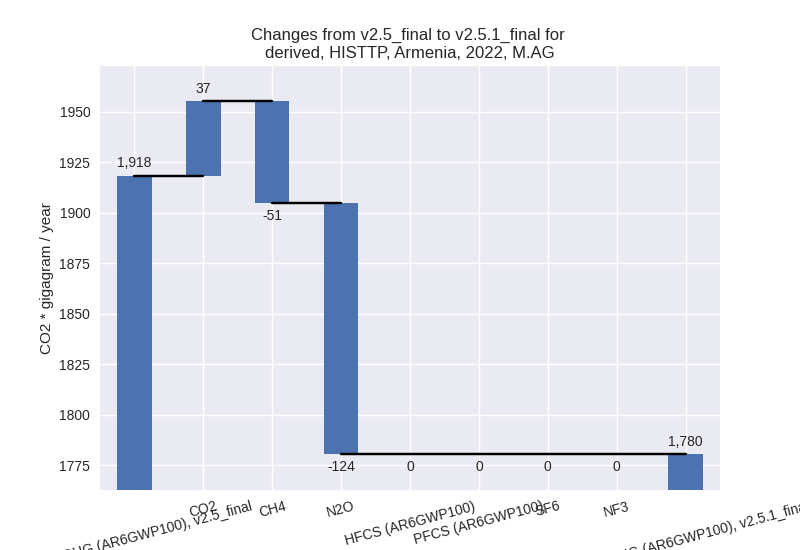
- M.AG: Total sectoral emissions in 2022 are 1780.39
Gg CO2 / year which is 18.8% of M.0.EL emissions. 2022 Emissions have
changed by -7.2% (-138.05 Gg CO2 /
year). 1990-2022 Emissions have changed by 0.1% (2.14 Gg CO2 / year). For 2022 the
changes per gas
are:
The changes come from the following subsectors:- 3.A: Total sectoral emissions in 2022 are 757.65 Gg
CO2 / year which is 42.6% of category M.AG emissions. 2022 Emissions
have changed by -6.7% (-54.82 Gg CO2
/ year). 1990-2022 Emissions have changed by -0.1% (-0.55 Gg CO2 / year). For 2022 the
changes per gas
are:

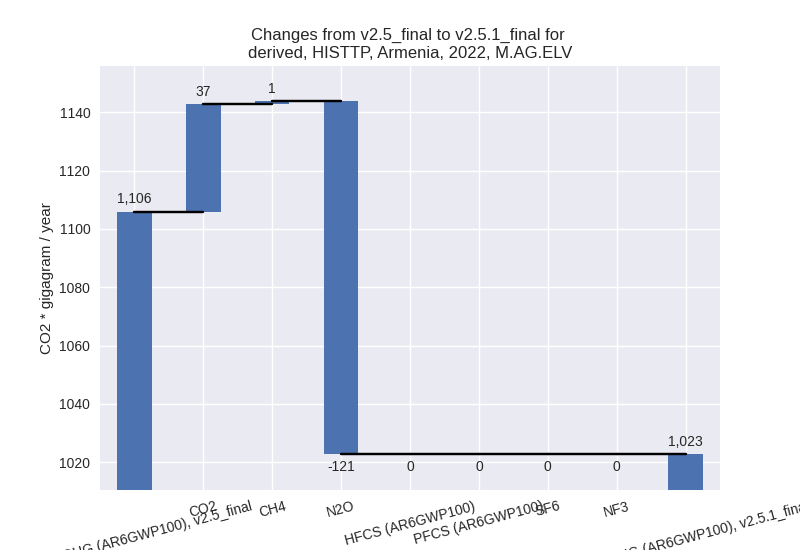
There is no subsector information available in PRIMAP-hist. - M.AG.ELV: Total sectoral emissions in 2022 are
1022.73 Gg CO2 / year which is 57.4% of category M.AG emissions. 2022
Emissions have changed by -7.5%
(-83.24 Gg CO2 / year). 1990-2022 Emissions have changed by 0.4% (2.69 Gg CO2 / year). For 2022 the
changes per gas
are:
There is no subsector information available in PRIMAP-hist.
- 3.A: Total sectoral emissions in 2022 are 757.65 Gg
CO2 / year which is 42.6% of category M.AG emissions. 2022 Emissions
have changed by -6.7% (-54.82 Gg CO2
/ year). 1990-2022 Emissions have changed by -0.1% (-0.55 Gg CO2 / year). For 2022 the
changes per gas
are:
- 4: Total sectoral emissions in 2022 are 453.46 Gg
CO2 / year which is 4.8% of M.0.EL emissions. 2022 Emissions have
changed by -4.2% (-19.64 Gg CO2 /
year). 1990-2022 Emissions have changed by -0.1% (-0.60 Gg CO2 / year). For 2022 the
changes per gas
are:

- 5: Total sectoral emissions in 2022 are 36.81 Gg
CO2 / year which is 0.4% of M.0.EL emissions. 2022 Emissions have
changed by -4.1% (-1.56 Gg CO2 /
year). 1990-2022 Emissions have changed by -0.2% (-0.05 Gg CO2 / year). For 2022 the
changes per gas
are:
