Changes in PRIMAP-hist v2.5.1_final compared to v2.5_final for Australia
2024-02-29
Johannes Gütschow
Change analysis for Australia for PRIMAP-hist v2.5.1_final compared to v2.5_final
Overview over emissions by sector and gas
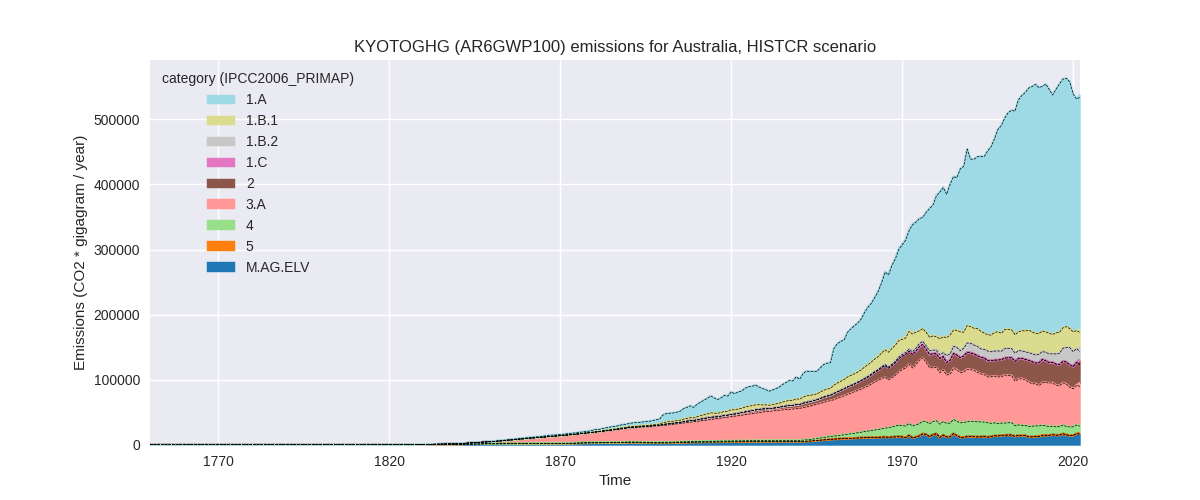
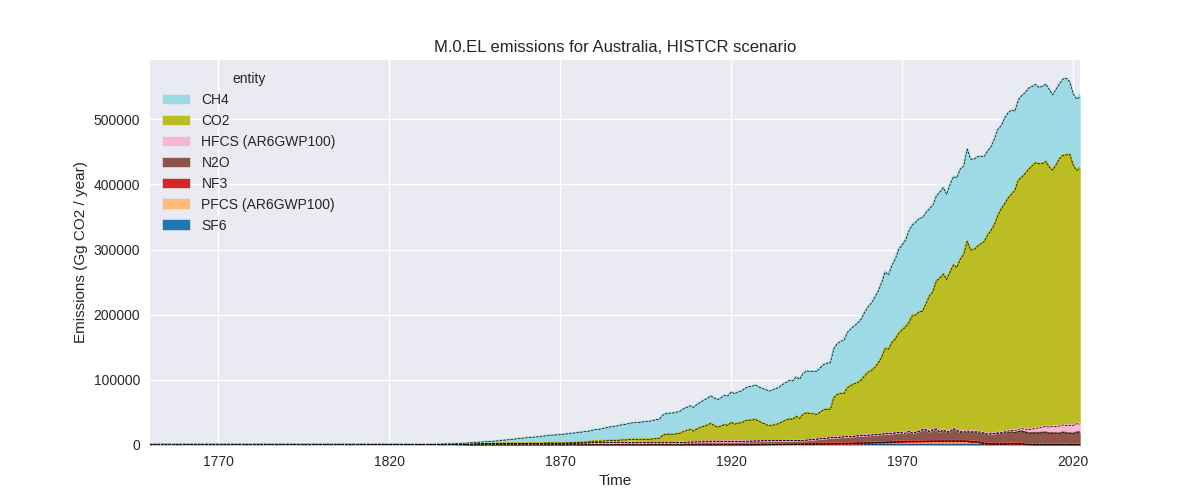
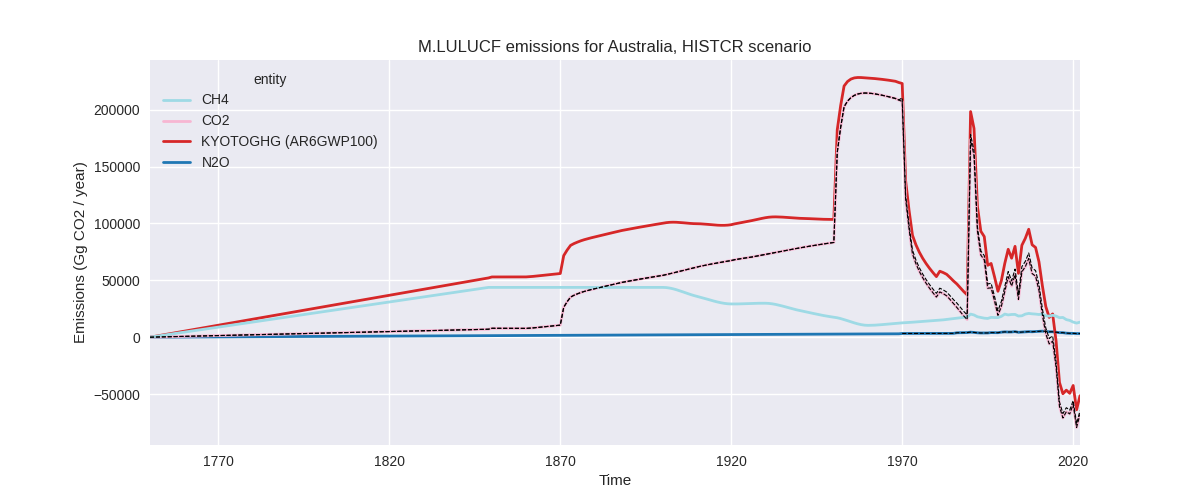
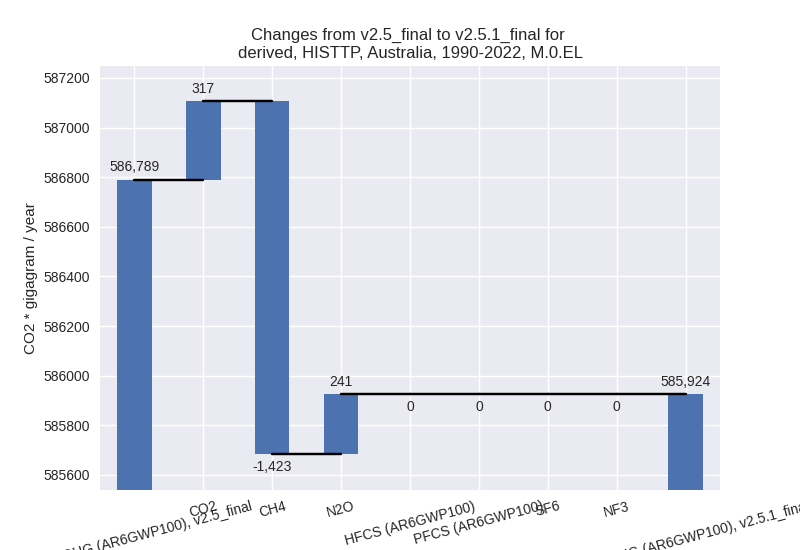
The following figures show the aggregate national total emissions excluding LULUCF AR6GWP100 for the country reported priority scenario. The dotted linesshow the v2.5_final data.
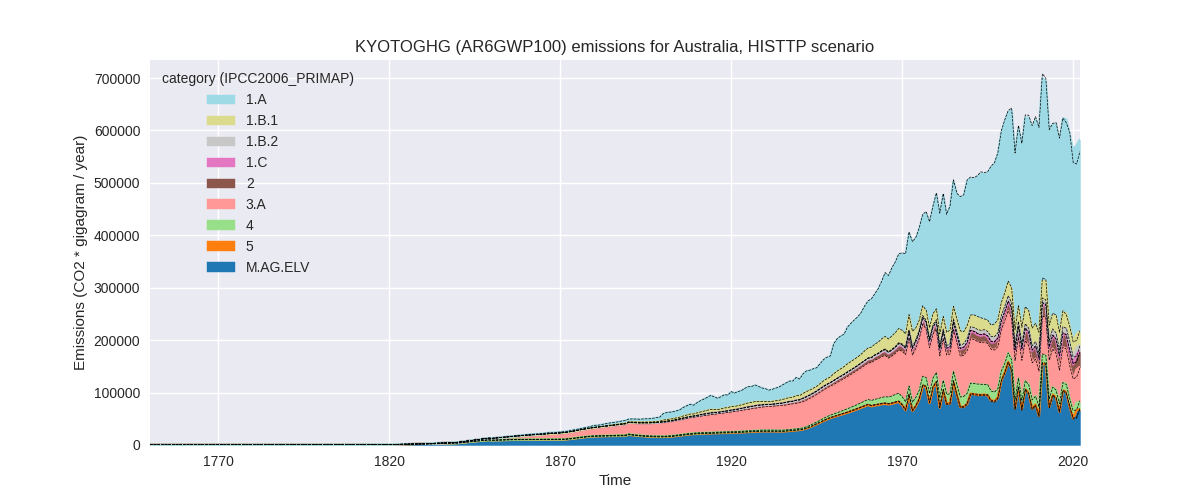
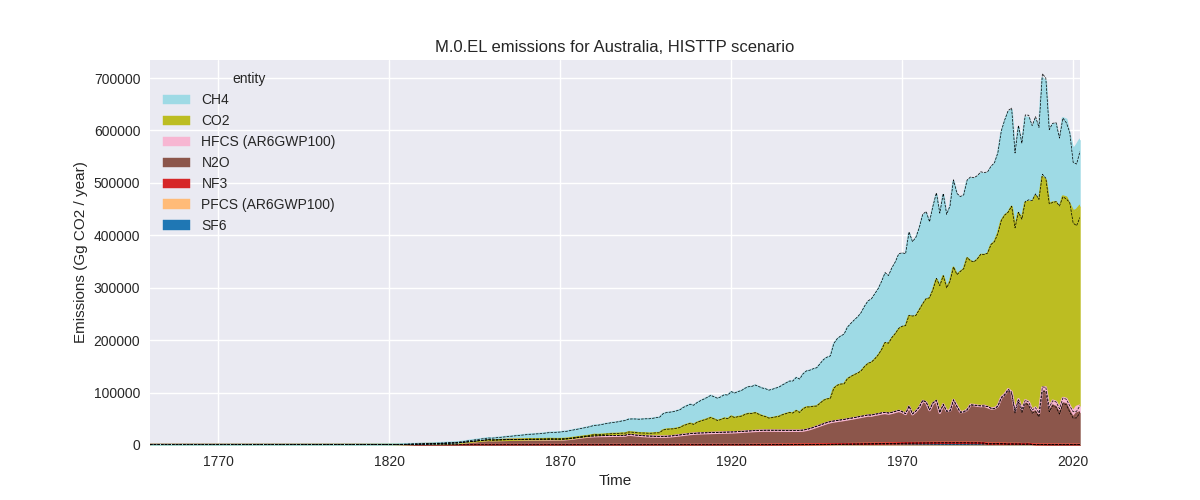
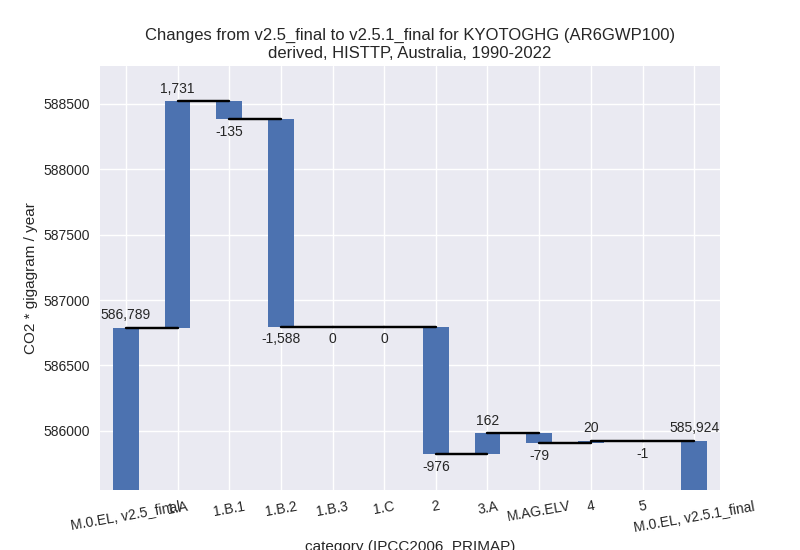
The following figures show the aggregate national total emissions excluding LULUCF AR6GWP100 for the third party priority scenario. The dotted linesshow the v2.5_final data.

Overview over changes
In the country reported priority scenario we have the following changes for aggregate Kyoto GHG and national total emissions excluding LULUCF (M.0.EL):
- Emissions in 2022 have changed by 0.8%% (4089.28 Gg CO2 / year)
- Emissions in 1990-2022 have changed by 0.0%% (123.92 Gg CO2 / year)
In the third party priority scenario we have the following changes for aggregate Kyoto GHG and national total emissions excluding LULUCF (M.0.EL):
- Emissions in 2022 have changed by 3.9%% (22102.05 Gg CO2 / year)
- Emissions in 1990-2022 have changed by -0.1%% (-864.71 Gg CO2 / year)
Most important changes per scenario and time frame
In the country reported priority scenario the following sector-gas combinations have the highest absolute impact on national total KyotoGHG (AR6GWP100) emissions in 2022 (top 5):
- 1: 3.A, CH4 with 3012.11 Gg CO2 / year (5.0%)
- 2: 1.B.1, CH4 with -2008.73 Gg CO2 / year (-7.5%)
- 3: 4, CH4 with 1262.17 Gg CO2 / year (10.8%)
- 4: 2, CO2 with 1053.41 Gg CO2 / year (5.8%)
- 5: M.AG.ELV, N2O with 1028.32 Gg CO2 / year (7.8%)
In the country reported priority scenario the following sector-gas combinations have the highest absolute impact on national total KyotoGHG (AR6GWP100) emissions in 1990-2022 (top 5):
- 1: 3.A, CH4 with 91.28 Gg CO2 / year (0.1%)
- 2: 1.B.1, CH4 with -60.87 Gg CO2 / year (-0.2%)
- 3: 4, CH4 with 38.25 Gg CO2 / year (0.2%)
- 4: 2, CO2 with 31.92 Gg CO2 / year (0.2%)
- 5: M.AG.ELV, N2O with 31.16 Gg CO2 / year (0.3%)
In the third party priority scenario the following sector-gas combinations have the highest absolute impact on national total KyotoGHG (AR6GWP100) emissions in 2022 (top 5):
- 1: 1.A, CO2 with 23462.48 Gg CO2 / year (7.0%)
- 2: 3.A, CH4 with 3948.63 Gg CO2 / year (6.5%)
- 3: 1.B.1, CH4 with -2052.47 Gg CO2 / year (-8.8%)
- 4: M.AG.ELV, CH4 with -1880.57 Gg CO2 / year (-11.3%)
- 5: 1.B.2, CH4 with -766.43 Gg CO2 / year (-6.6%)
In the third party priority scenario the following sector-gas combinations have the highest absolute impact on national total KyotoGHG (AR6GWP100) emissions in 1990-2022 (top 5):
- 1: 1.A, CO2 with 1687.91 Gg CO2 / year (0.5%)
- 2: 1.B.2, CH4 with -1587.65 Gg CO2 / year (-17.5%)
- 3: 2, CO2 with -992.92 Gg CO2 / year (-8.1%)
- 4: M.AG.ELV, CO2 with -331.04 Gg CO2 / year (-17.2%)
- 5: M.AG.ELV, N2O with 183.94 Gg CO2 / year (0.3%)
Notes on data changes
No country specific notes present for this changelog.
Changes by sector and gas
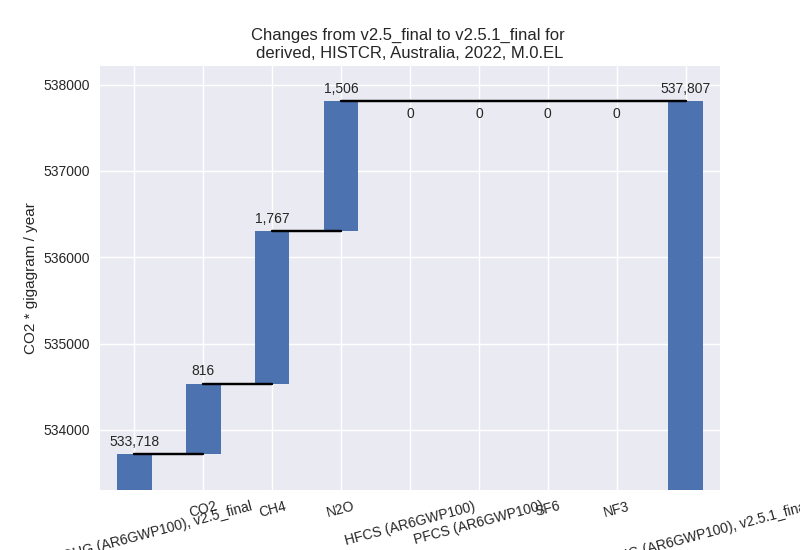
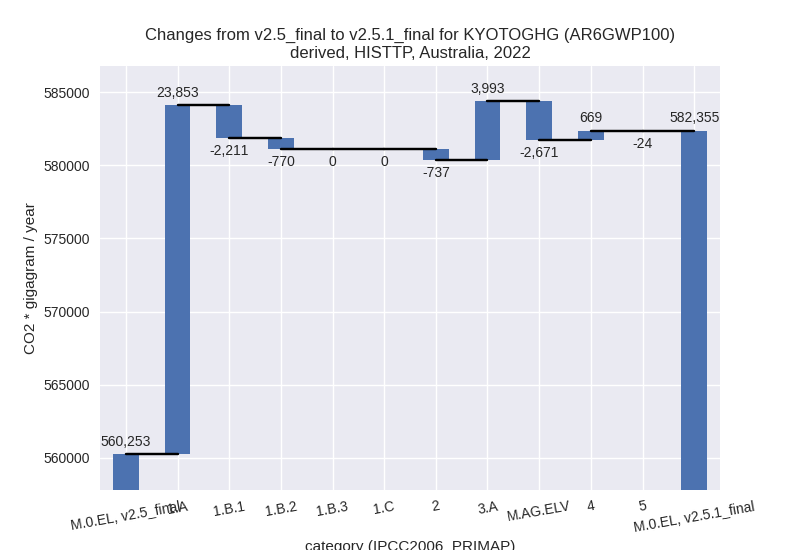
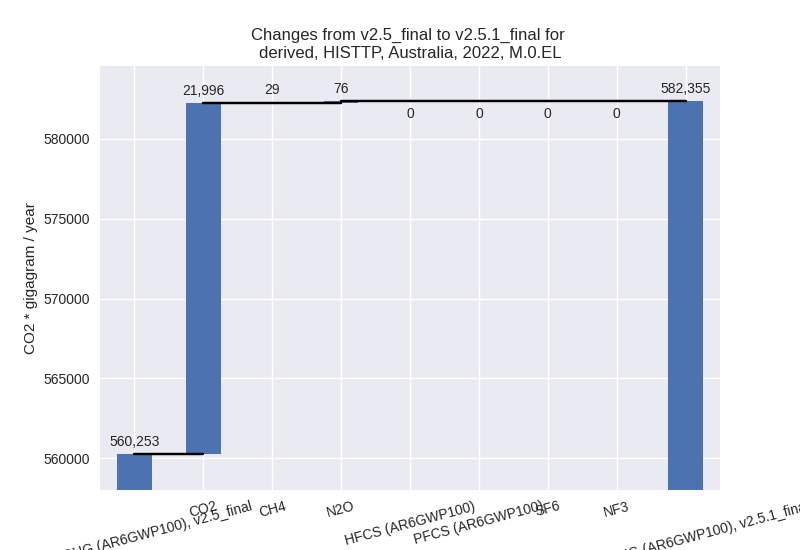
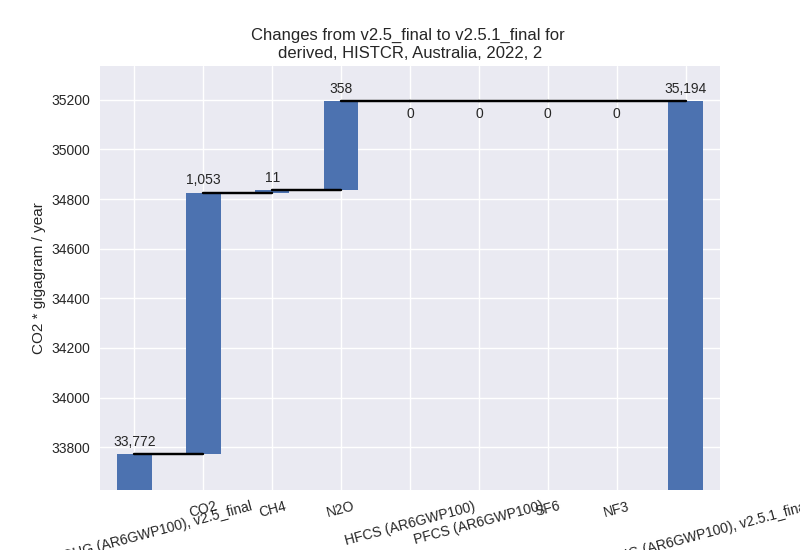
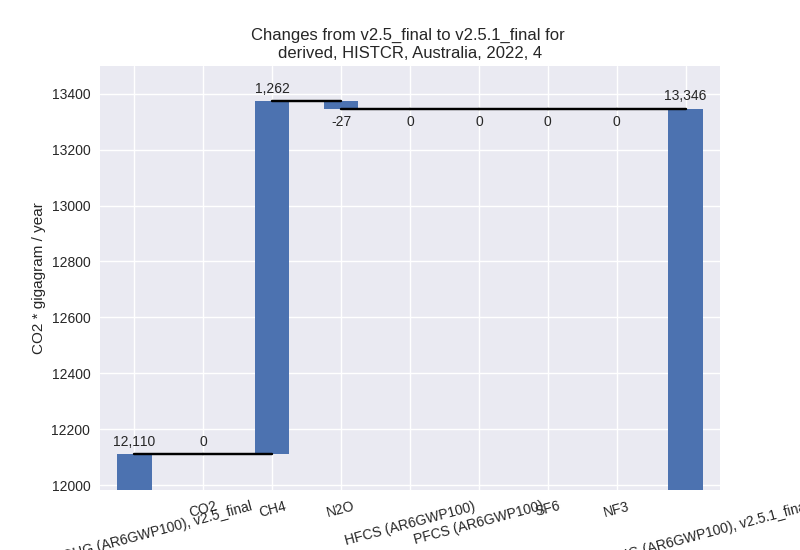
For each scenario and time frame the changes are displayed for all individual sectors and all individual gases. In the sector plot we use aggregate Kyoto GHGs in AR6GWP100. In the gas plot we usenational total emissions without LULUCF. ## country reported scenario
2022

1990-2022


third party scenario
2022
1990-2022
Detailed changes for the scenarios:
country reported scenario (HISTCR):
Most important changes per time frame
For 2022 the following sector-gas combinations have the highest absolute impact on national total KyotoGHG (AR6GWP100) emissions in 2022 (top 5):
- 1: 3.A, CH4 with 3012.11 Gg CO2 / year (5.0%)
- 2: 1.B.1, CH4 with -2008.73 Gg CO2 / year (-7.5%)
- 3: 4, CH4 with 1262.17 Gg CO2 / year (10.8%)
- 4: 2, CO2 with 1053.41 Gg CO2 / year (5.8%)
- 5: M.AG.ELV, N2O with 1028.32 Gg CO2 / year (7.8%)
For 1990-2022 the following sector-gas combinations have the highest absolute impact on national total KyotoGHG (AR6GWP100) emissions in 1990-2022 (top 5):
- 1: 3.A, CH4 with 91.28 Gg CO2 / year (0.1%)
- 2: 1.B.1, CH4 with -60.87 Gg CO2 / year (-0.2%)
- 3: 4, CH4 with 38.25 Gg CO2 / year (0.2%)
- 4: 2, CO2 with 31.92 Gg CO2 / year (0.2%)
- 5: M.AG.ELV, N2O with 31.16 Gg CO2 / year (0.3%)
Changes in the main sectors for aggregate KyotoGHG (AR6GWP100) are
- 1: Total sectoral emissions in 2022 are 407340.44 Gg CO2 / year which is 75.7% of M.0.EL emissions. 2022 Emissions have changed by -0.7% (-2704.69 Gg CO2 / year). 1990-2022 Emissions have changed by -0.0% (-81.96 Gg CO2 / year).
- 2: Total sectoral emissions in 2022 are 35194.26 Gg
CO2 / year which is 6.5% of M.0.EL emissions. 2022 Emissions have
changed by 4.2% (1422.60 Gg CO2 /
year). 1990-2022 Emissions have changed by 0.1% (43.11 Gg CO2 / year). For 2022 the
changes per gas
are:
- M.AG: Total sectoral emissions in 2022 are 81926.05
Gg CO2 / year which is 15.2% of M.0.EL emissions. 2022 Emissions have
changed by 5.3% (4135.60 Gg CO2 /
year). 1990-2022 Emissions have changed by 0.2% (125.32 Gg CO2 / year). For 2022 the
changes per gas
are:

The changes come from the following subsectors:- 3.A: Total sectoral emissions in 2022 are 64056.15
Gg CO2 / year which is 78.2% of category M.AG emissions. 2022 Emissions
have changed by 4.9% (3013.87 Gg CO2
/ year). 1990-2022 Emissions have changed by 0.1% (91.33 Gg CO2 / year). For 2022 the
changes per gas
are:

There is no subsector information available in PRIMAP-hist. - M.AG.ELV: Total sectoral emissions in 2022 are
17869.90 Gg CO2 / year which is 21.8% of category M.AG emissions. 2022
Emissions have changed by 6.7%
(1121.73 Gg CO2 / year). 1990-2022 Emissions have changed by 0.2% (33.99 Gg CO2 / year). For 2022 the
changes per gas
are:

There is no subsector information available in PRIMAP-hist.
- 3.A: Total sectoral emissions in 2022 are 64056.15
Gg CO2 / year which is 78.2% of category M.AG emissions. 2022 Emissions
have changed by 4.9% (3013.87 Gg CO2
/ year). 1990-2022 Emissions have changed by 0.1% (91.33 Gg CO2 / year). For 2022 the
changes per gas
are:
- 4: Total sectoral emissions in 2022 are 13346.24 Gg
CO2 / year which is 2.5% of M.0.EL emissions. 2022 Emissions have
changed by 10.2% (1235.78 Gg CO2 /
year). 1990-2022 Emissions have changed by 0.2% (37.45 Gg CO2 / year). For 2022 the
changes per gas
are:
- 5: No data
third party scenario (HISTTP):
Most important changes per time frame
For 2022 the following sector-gas combinations have the highest absolute impact on national total KyotoGHG (AR6GWP100) emissions in 2022 (top 5):
- 1: 1.A, CO2 with 23462.48 Gg CO2 / year (7.0%)
- 2: 3.A, CH4 with 3948.63 Gg CO2 / year (6.5%)
- 3: 1.B.1, CH4 with -2052.47 Gg CO2 / year (-8.8%)
- 4: M.AG.ELV, CH4 with -1880.57 Gg CO2 / year (-11.3%)
- 5: 1.B.2, CH4 with -766.43 Gg CO2 / year (-6.6%)
For 1990-2022 the following sector-gas combinations have the highest absolute impact on national total KyotoGHG (AR6GWP100) emissions in 1990-2022 (top 5):
- 1: 1.A, CO2 with 1687.91 Gg CO2 / year (0.5%)
- 2: 1.B.2, CH4 with -1587.65 Gg CO2 / year (-17.5%)
- 3: 2, CO2 with -992.92 Gg CO2 / year (-8.1%)
- 4: M.AG.ELV, CO2 with -331.04 Gg CO2 / year (-17.2%)
- 5: M.AG.ELV, N2O with 183.94 Gg CO2 / year (0.3%)
Changes in the main sectors for aggregate KyotoGHG (AR6GWP100) are
- 1: Total sectoral emissions in 2022 are 403992.50
Gg CO2 / year which is 69.4% of M.0.EL emissions. 2022 Emissions have
changed by 5.4% (20871.82 Gg CO2 /
year). 1990-2022 Emissions have changed by 0.0% (9.03 Gg CO2 / year). For 2022 the
changes per gas
are:
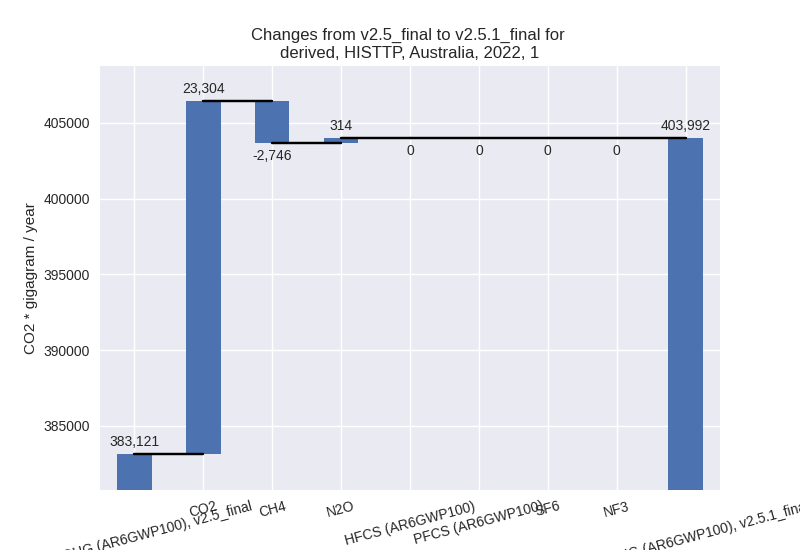
The changes come from the following subsectors:- 1.A: Total sectoral emissions in 2022 are 365931.83
Gg CO2 / year which is 90.6% of category 1 emissions. 2022 Emissions
have changed by 7.0% (23852.69 Gg
CO2 / year). 1990-2022 Emissions have changed by 0.5% (1731.48 Gg CO2 / year). For 2022 the
changes per gas
are:

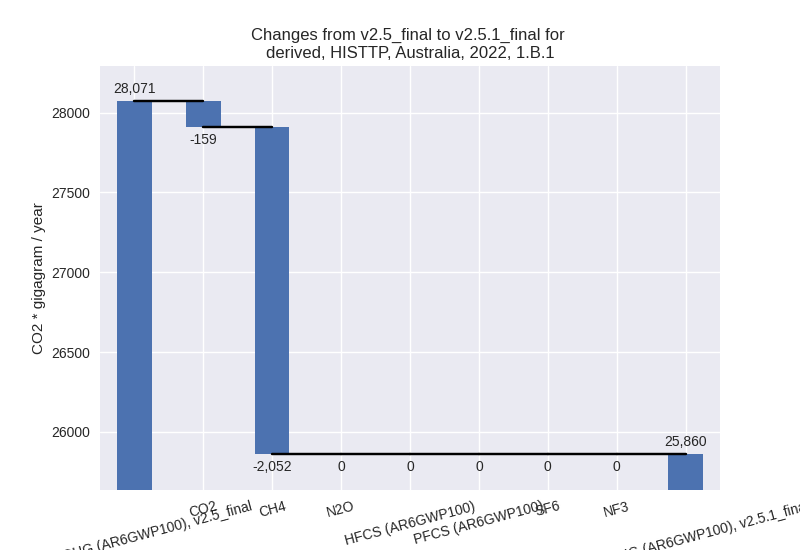
There is no subsector information available in PRIMAP-hist. - 1.B.1: Total sectoral emissions in 2022 are
25860.08 Gg CO2 / year which is 6.4% of category 1 emissions. 2022
Emissions have changed by -7.9%
(-2211.26 Gg CO2 / year). 1990-2022 Emissions have changed by -0.5% (-134.70 Gg CO2 / year). For 2022
the changes per gas
are:
There is no subsector information available in PRIMAP-hist. - 1.B.2: Total sectoral emissions in 2022 are
12197.03 Gg CO2 / year which is 3.0% of category 1 emissions. 2022
Emissions have changed by -5.9%
(-769.61 Gg CO2 / year). 1990-2022 Emissions have changed by -16.0% (-1587.75 Gg CO2 / year). For 2022
the changes per gas
are:
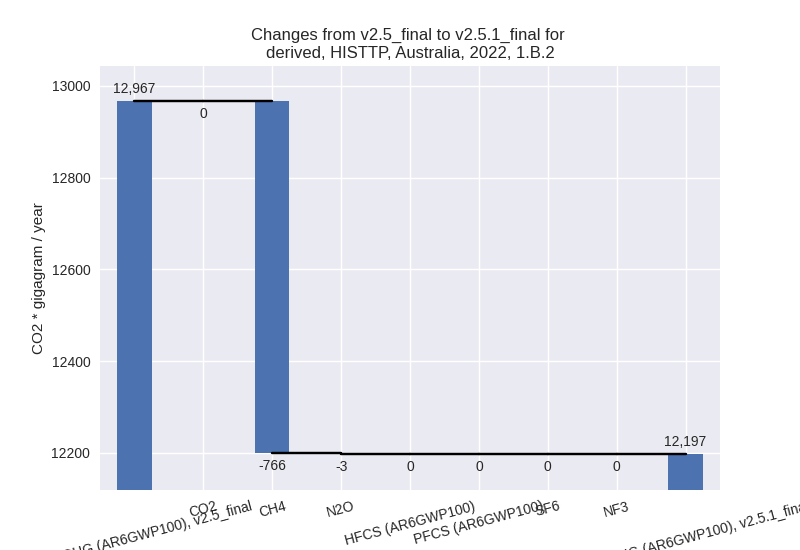
For 1990-2022 the changes per gas are:
There is no subsector information available in PRIMAP-hist. - 1.C: Total sectoral emissions in 2022 are 3.56 Gg CO2 / year which is 0.0% of category 1 emissions. 2022 Emissions have changed by 0.0% (0.00 Gg CO2 / year). 1990-2022 Emissions have changed by 0.0% (0.00 Gg CO2 / year).
- 1.A: Total sectoral emissions in 2022 are 365931.83
Gg CO2 / year which is 90.6% of category 1 emissions. 2022 Emissions
have changed by 7.0% (23852.69 Gg
CO2 / year). 1990-2022 Emissions have changed by 0.5% (1731.48 Gg CO2 / year). For 2022 the
changes per gas
are:
- 2: Total sectoral emissions in 2022 are 29211.84 Gg
CO2 / year which is 5.0% of M.0.EL emissions. 2022 Emissions have
changed by -2.5% (-737.40 Gg CO2 /
year). 1990-2022 Emissions have changed by -4.4% (-976.19 Gg CO2 / year). For 2022
the changes per gas
are:

For 1990-2022 the changes per gas are:
- M.AG: Total sectoral emissions in 2022 are 133035.57 Gg CO2 / year which is 22.8% of M.0.EL emissions. 2022 Emissions have changed by 1.0% (1322.11 Gg CO2 / year). 1990-2022 Emissions have changed by 0.0% (82.88 Gg CO2 / year).
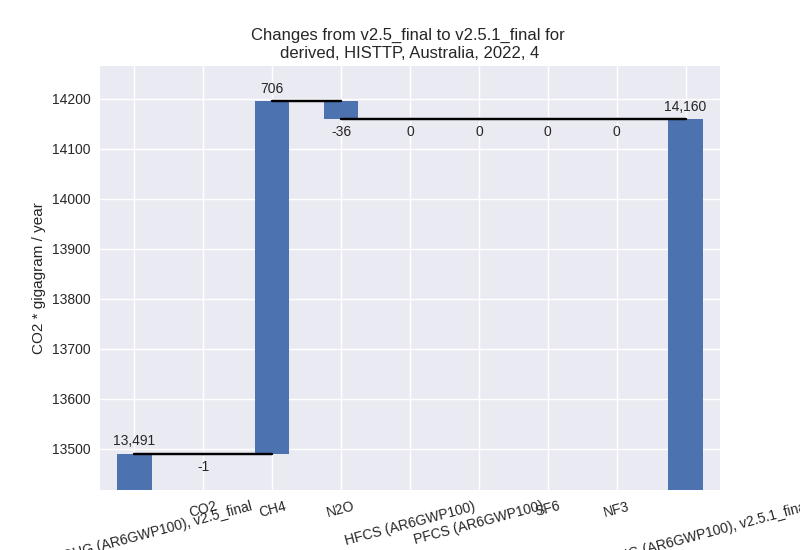
- 4: Total sectoral emissions in 2022 are 14159.88 Gg
CO2 / year which is 2.4% of M.0.EL emissions. 2022 Emissions have
changed by 5.0% (669.38 Gg CO2 /
year). 1990-2022 Emissions have changed by 0.1% (20.28 Gg CO2 / year). For 2022 the
changes per gas
are:
- 5: Total sectoral emissions in 2022 are 1955.13 Gg CO2 / year which is 0.3% of M.0.EL emissions. 2022 Emissions have changed by -1.2% (-23.85 Gg CO2 / year). 1990-2022 Emissions have changed by -0.0% (-0.72 Gg CO2 / year).