Changes in PRIMAP-hist v2.5.1_final compared to v2.5_final for Azerbaijan
2024-02-29
Johannes Gütschow
Change analysis for Azerbaijan for PRIMAP-hist v2.5.1_final compared to v2.5_final
Overview over emissions by sector and gas
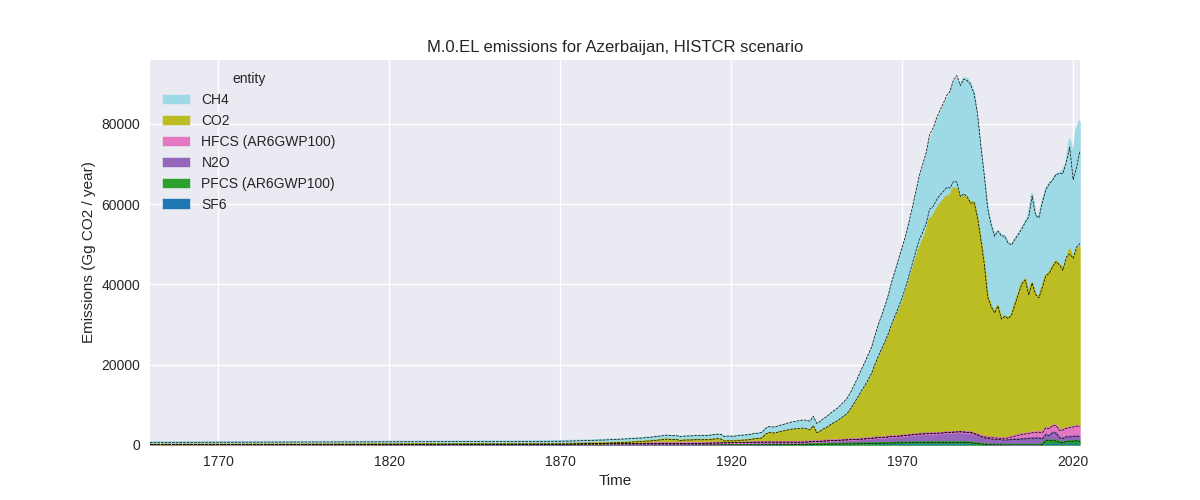
The following figures show the aggregate national total emissions excluding LULUCF AR6GWP100 for the country reported priority scenario. The dotted linesshow the v2.5_final data.

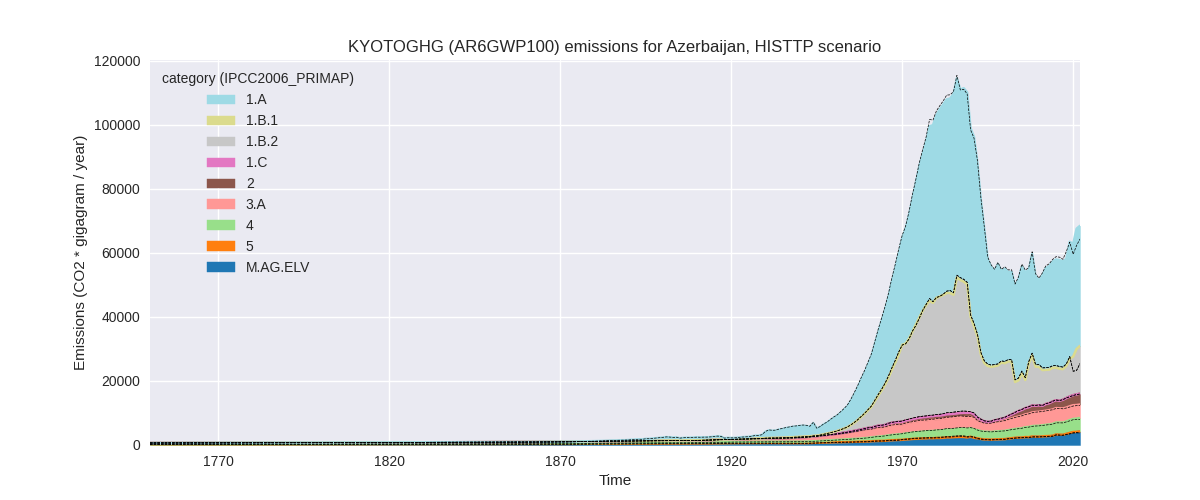
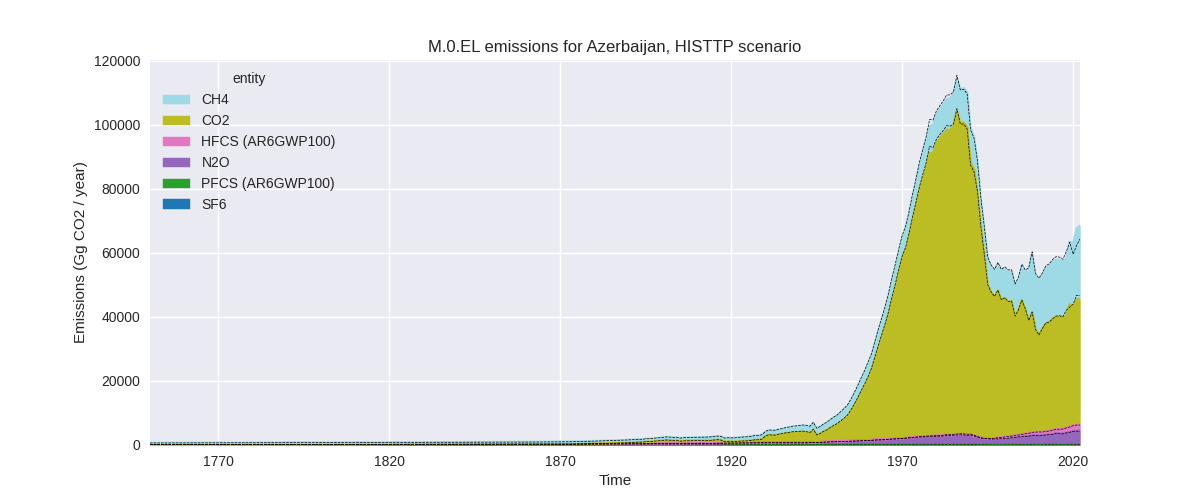
The following figures show the aggregate national total emissions excluding LULUCF AR6GWP100 for the third party priority scenario. The dotted linesshow the v2.5_final data.

Overview over changes
In the country reported priority scenario we have the following changes for aggregate Kyoto GHG and national total emissions excluding LULUCF (M.0.EL):
- Emissions in 2022 have changed by 10.1%% (7394.69 Gg CO2 / year)
- Emissions in 1990-2022 have changed by 1.0%% (653.46 Gg CO2 / year)
In the third party priority scenario we have the following changes for aggregate Kyoto GHG and national total emissions excluding LULUCF (M.0.EL):
- Emissions in 2022 have changed by 6.4%% (4120.94 Gg CO2 / year)
- Emissions in 1990-2022 have changed by -0.3%% (-184.89 Gg CO2 / year)
Most important changes per scenario and time frame
In the country reported priority scenario the following sector-gas combinations have the highest absolute impact on national total KyotoGHG (AR6GWP100) emissions in 2022 (top 5):
- 1: 1.B.2, CH4 with 8042.34 Gg CO2 / year (85.7%)
- 2: 1.A, CO2 with -1235.37 Gg CO2 / year (-3.1%)
- 3: M.AG.ELV, CH4 with 456.55 Gg CO2 / year (10.6%)
- 4: 2, CO2 with 389.23 Gg CO2 / year (19.6%)
- 5: 3.A, CH4 with -312.82 Gg CO2 / year (-4.3%)
In the country reported priority scenario the following sector-gas combinations have the highest absolute impact on national total KyotoGHG (AR6GWP100) emissions in 1990-2022 (top 5):
- 1: 1.B.2, CH4 with 722.08 Gg CO2 / year (5.9%)
- 2: 1.A, CO2 with -156.33 Gg CO2 / year (-0.4%)
- 3: M.AG.ELV, CH4 with 54.40 Gg CO2 / year (5.4%)
- 4: 2, CO2 with 42.44 Gg CO2 / year (4.1%)
- 5: 3.A, CH4 with -10.69 Gg CO2 / year (-0.2%)
In the third party priority scenario the following sector-gas combinations have the highest absolute impact on national total KyotoGHG (AR6GWP100) emissions in 2022 (top 5):
- 1: 1.B.2, CH4 with 5413.95 Gg CO2 / year (59.5%)
- 2: 1.A, CO2 with -1439.49 Gg CO2 / year (-3.7%)
- 3: M.AG.ELV, CO2 with 265.14 Gg CO2 / year (3282.0%)
- 4: 3.A, CH4 with -177.82 Gg CO2 / year (-4.1%)
- 5: M.AG.ELV, N2O with 173.30 Gg CO2 / year (4.8%)
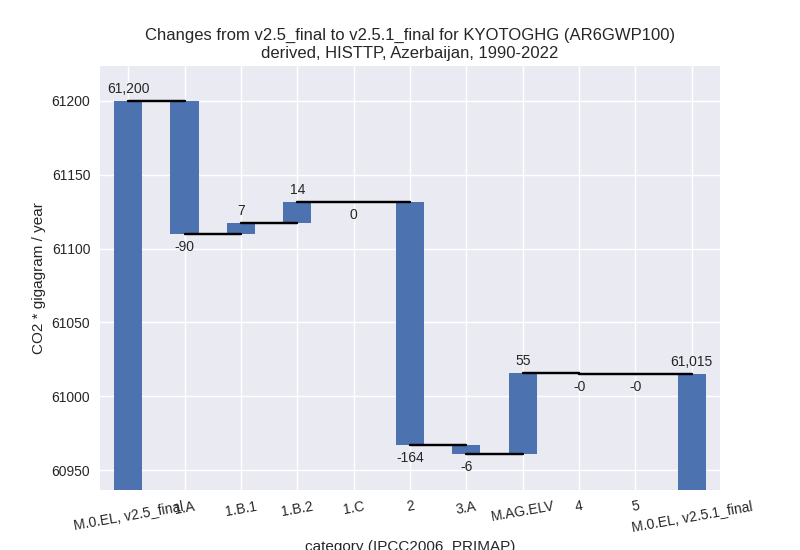
In the third party priority scenario the following sector-gas combinations have the highest absolute impact on national total KyotoGHG (AR6GWP100) emissions in 1990-2022 (top 5):
- 1: 2, CO2 with -164.35 Gg CO2 / year (-17.1%)
- 2: 1.A, CO2 with -91.28 Gg CO2 / year (-0.3%)
- 3: M.AG.ELV, CO2 with 60.16 Gg CO2 / year (231.3%)
- 4: 1.B.2, CH4 with 14.26 Gg CO2 / year (0.2%)
- 5: 1.B.1, CH4 with 7.14 Gg CO2 / year (462.9%)
Notes on data changes
Here we list notes explaining important emissions changes for the country. ’' means that the following text only applies to the TP time series, while means that it only applies to the CR scenario. Otherwise the note applies to both scenarios.
- 1.B.2, CH4: 2022 emissions are much higher as the new EDGAR 8.0 data shows a continuous growth in emissions while EDGAR 7.0 showed a steep decline in 2020. The impact on cumulative emissions is much smaller.
- 1.A, CO2: 2020 and cumulative emissions are slightly smaller due to the updated CDIAC data.
Changes by sector and gas
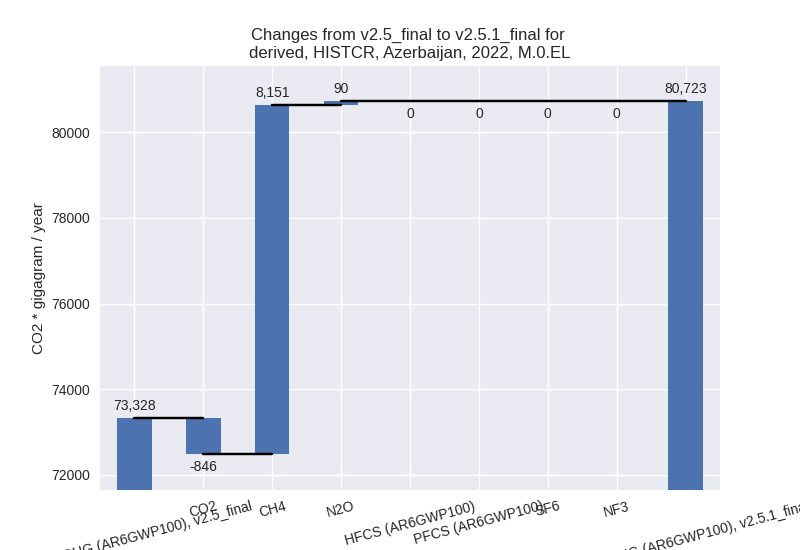
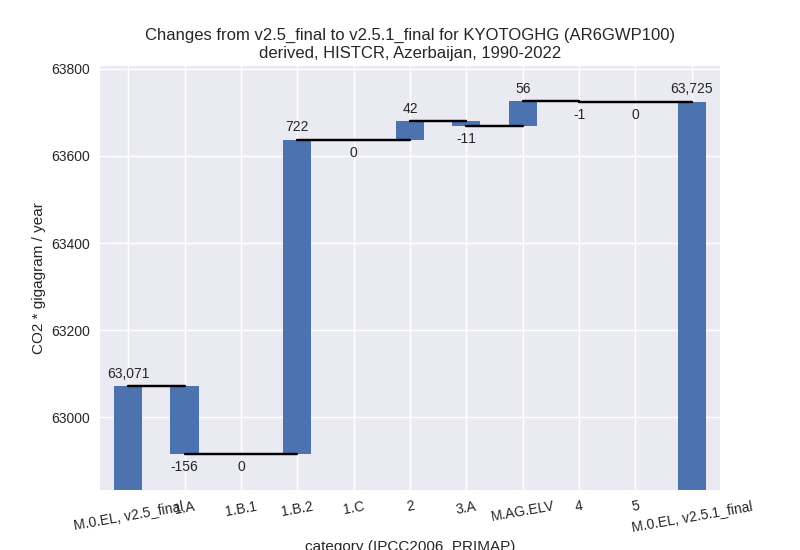
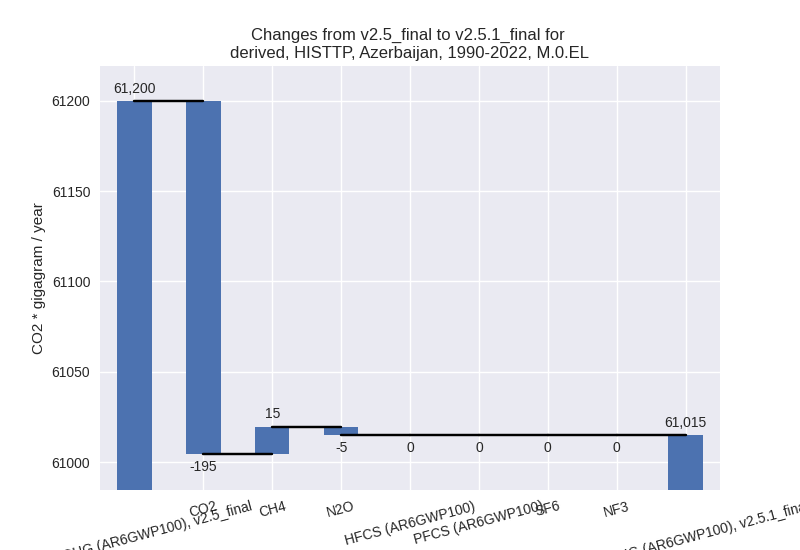
For each scenario and time frame the changes are displayed for all individual sectors and all individual gases. In the sector plot we use aggregate Kyoto GHGs in AR6GWP100. In the gas plot we usenational total emissions without LULUCF. ## country reported scenario
2022

1990-2022

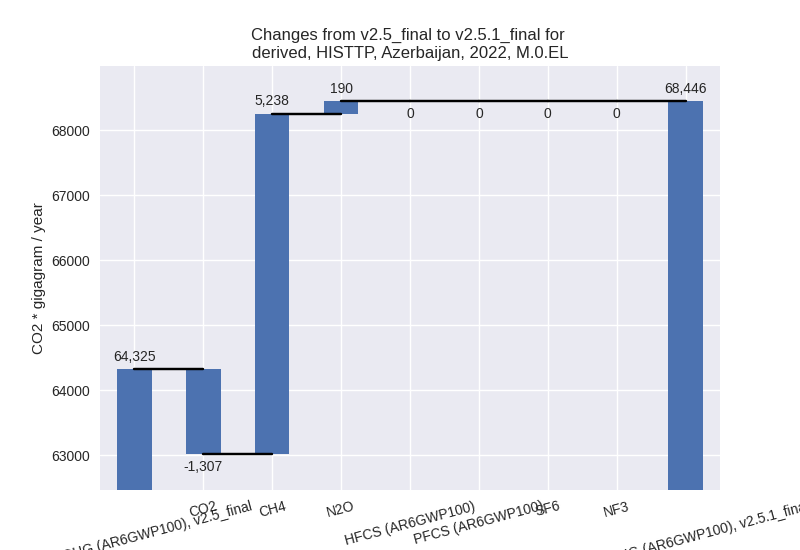
third party scenario
2022

1990-2022
Detailed changes for the scenarios:
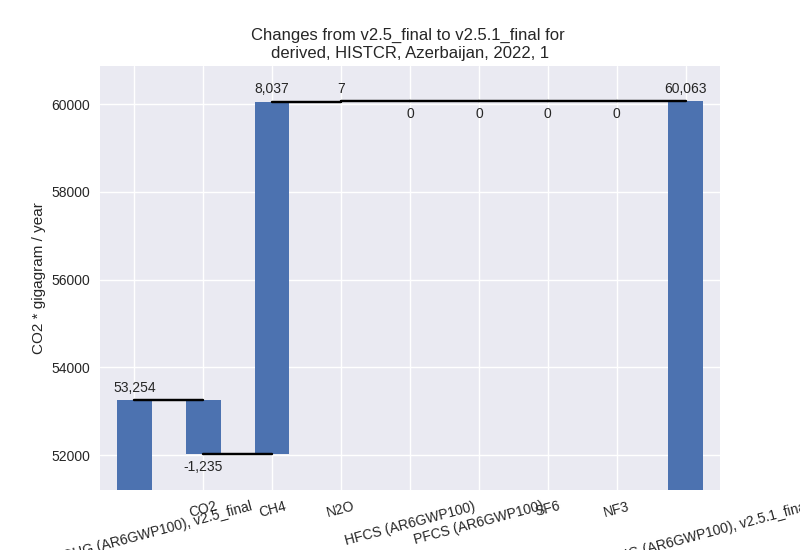
country reported scenario (HISTCR):
Most important changes per time frame
For 2022 the following sector-gas combinations have the highest absolute impact on national total KyotoGHG (AR6GWP100) emissions in 2022 (top 5):
- 1: 1.B.2, CH4 with 8042.34 Gg CO2 / year (85.7%)
- 2: 1.A, CO2 with -1235.37 Gg CO2 / year (-3.1%)
- 3: M.AG.ELV, CH4 with 456.55 Gg CO2 / year (10.6%)
- 4: 2, CO2 with 389.23 Gg CO2 / year (19.6%)
- 5: 3.A, CH4 with -312.82 Gg CO2 / year (-4.3%)
For 1990-2022 the following sector-gas combinations have the highest absolute impact on national total KyotoGHG (AR6GWP100) emissions in 1990-2022 (top 5):
- 1: 1.B.2, CH4 with 722.08 Gg CO2 / year (5.9%)
- 2: 1.A, CO2 with -156.33 Gg CO2 / year (-0.4%)
- 3: M.AG.ELV, CH4 with 54.40 Gg CO2 / year (5.4%)
- 4: 2, CO2 with 42.44 Gg CO2 / year (4.1%)
- 5: 3.A, CH4 with -10.69 Gg CO2 / year (-0.2%)
Changes in the main sectors for aggregate KyotoGHG (AR6GWP100) are
- 1: Total sectoral emissions in 2022 are 60062.50 Gg
CO2 / year which is 74.4% of M.0.EL emissions. 2022 Emissions have
changed by 12.8% (6808.57 Gg CO2 /
year). 1990-2022 Emissions have changed by 1.1% (566.17 Gg CO2 / year). For 2022 the
changes per gas
are:
The changes come from the following subsectors:- 1.A: Total sectoral emissions in 2022 are 38505.58
Gg CO2 / year which is 64.1% of category 1 emissions. 2022 Emissions
have changed by -3.1% (-1234.83 Gg
CO2 / year). 1990-2022 Emissions have changed by -0.4% (-156.02 Gg CO2 / year). For 2022
the changes per gas
are:

There is no subsector information available in PRIMAP-hist. - 1.B.2: Total sectoral emissions in 2022 are
21556.92 Gg CO2 / year which is 35.9% of category 1 emissions. 2022
Emissions have changed by 59.5%
(8043.40 Gg CO2 / year). 1990-2022 Emissions have changed by 4.7% (722.19 Gg CO2 / year). For 2022 the
changes per gas
are:

For 1990-2022 the changes per gas are:
There is no subsector information available in PRIMAP-hist.
- 1.A: Total sectoral emissions in 2022 are 38505.58
Gg CO2 / year which is 64.1% of category 1 emissions. 2022 Emissions
have changed by -3.1% (-1234.83 Gg
CO2 / year). 1990-2022 Emissions have changed by -0.4% (-156.02 Gg CO2 / year). For 2022
the changes per gas
are:
- 2: Total sectoral emissions in 2022 are 5927.15 Gg
CO2 / year which is 7.3% of M.0.EL emissions. 2022 Emissions have
changed by 7.0% (389.23 Gg CO2 /
year). 1990-2022 Emissions have changed by 1.6% (42.44 Gg CO2 / year). For 2022 the
changes per gas
are:

- M.AG: Total sectoral emissions in 2022 are 12791.40 Gg CO2 / year which is 15.8% of M.0.EL emissions. 2022 Emissions have changed by 1.8% (226.46 Gg CO2 / year). 1990-2022 Emissions have changed by 0.5% (45.74 Gg CO2 / year).
- 4: Total sectoral emissions in 2022 are 1941.50 Gg CO2 / year which is 2.4% of M.0.EL emissions. 2022 Emissions have changed by -1.5% (-29.57 Gg CO2 / year). 1990-2022 Emissions have changed by -0.1% (-0.90 Gg CO2 / year).
- 5: No data
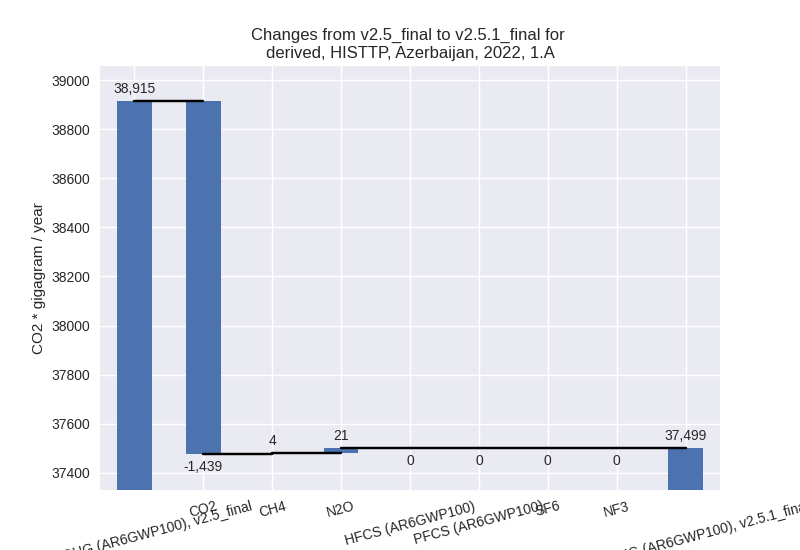
third party scenario (HISTTP):
Most important changes per time frame
For 2022 the following sector-gas combinations have the highest absolute impact on national total KyotoGHG (AR6GWP100) emissions in 2022 (top 5):
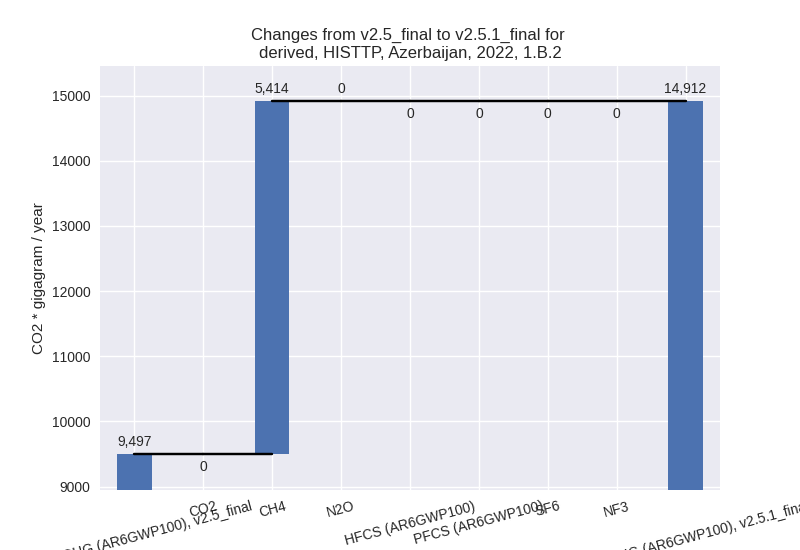
- 1: 1.B.2, CH4 with 5413.95 Gg CO2 / year (59.5%)
- 2: 1.A, CO2 with -1439.49 Gg CO2 / year (-3.7%)
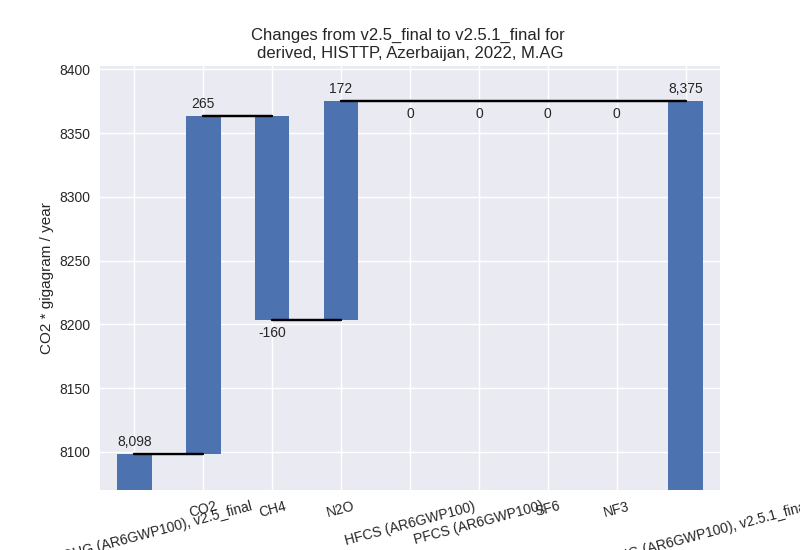
- 3: M.AG.ELV, CO2 with 265.14 Gg CO2 / year (3282.0%)
- 4: 3.A, CH4 with -177.82 Gg CO2 / year (-4.1%)
- 5: M.AG.ELV, N2O with 173.30 Gg CO2 / year (4.8%)
For 1990-2022 the following sector-gas combinations have the highest absolute impact on national total KyotoGHG (AR6GWP100) emissions in 1990-2022 (top 5):
- 1: 2, CO2 with -164.35 Gg CO2 / year (-17.1%)
- 2: 1.A, CO2 with -91.28 Gg CO2 / year (-0.3%)
- 3: M.AG.ELV, CO2 with 60.16 Gg CO2 / year (231.3%)
- 4: 1.B.2, CH4 with 14.26 Gg CO2 / year (0.2%)
- 5: 1.B.1, CH4 with 7.14 Gg CO2 / year (462.9%)
Changes in the main sectors for aggregate KyotoGHG (AR6GWP100) are
- 1: Total sectoral emissions in 2022 are 52411.31 Gg
CO2 / year which is 76.6% of M.0.EL emissions. 2022 Emissions have
changed by 8.3% (3995.78 Gg CO2 /
year). 1990-2022 Emissions have changed by -0.1% (-68.46 Gg CO2 / year). For 2022 the
changes per gas
are:

The changes come from the following subsectors:- 1.A: Total sectoral emissions in 2022 are 37499.38
Gg CO2 / year which is 71.5% of category 1 emissions. 2022 Emissions
have changed by -3.6% (-1415.20 Gg
CO2 / year). 1990-2022 Emissions have changed by -0.3% (-89.89 Gg CO2 / year). For 2022 the
changes per gas
are:
There is no subsector information available in PRIMAP-hist. - 1.B.1: Total sectoral emissions in 2022 are 0.19 Gg
CO2 / year which is 0.0% of category 1 emissions. 2022 Emissions have
changed by -94.5% (-3.29 Gg CO2 /
year). 1990-2022 Emissions have changed by 434.0% (7.14 Gg CO2 / year). For 2022 the
changes per gas
are:

For 1990-2022 the changes per gas are: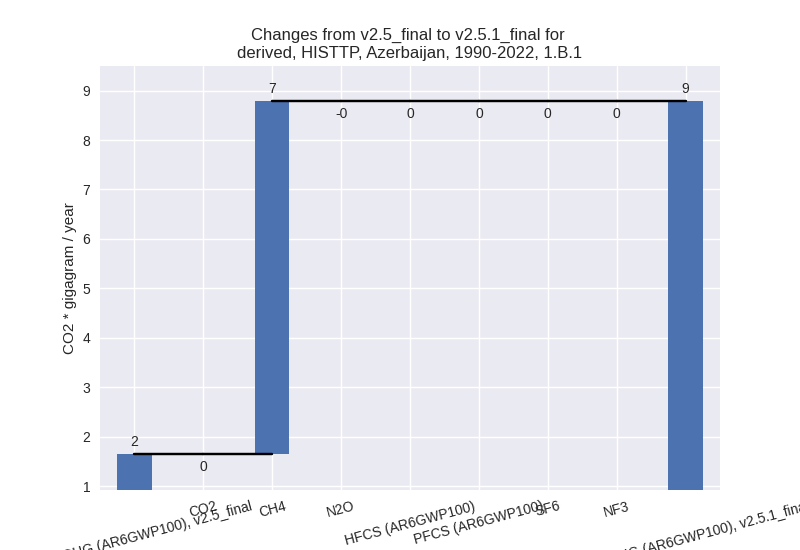
There is no subsector information available in PRIMAP-hist. - 1.B.2: Total sectoral emissions in 2022 are
14911.74 Gg CO2 / year which is 28.5% of category 1 emissions. 2022
Emissions have changed by 57.0%
(5414.27 Gg CO2 / year). 1990-2022 Emissions have changed by 0.1% (14.29 Gg CO2 / year). For 2022 the
changes per gas
are:
There is no subsector information available in PRIMAP-hist.
- 1.A: Total sectoral emissions in 2022 are 37499.38
Gg CO2 / year which is 71.5% of category 1 emissions. 2022 Emissions
have changed by -3.6% (-1415.20 Gg
CO2 / year). 1990-2022 Emissions have changed by -0.3% (-89.89 Gg CO2 / year). For 2022 the
changes per gas
are:
- 2: Total sectoral emissions in 2022 are 3378.54 Gg
CO2 / year which is 4.9% of M.0.EL emissions. 2022 Emissions have
changed by -3.8% (-133.56 Gg CO2 /
year). 1990-2022 Emissions have changed by -8.7% (-164.49 Gg CO2 / year). For 2022
the changes per gas
are:

For 1990-2022 the changes per gas are: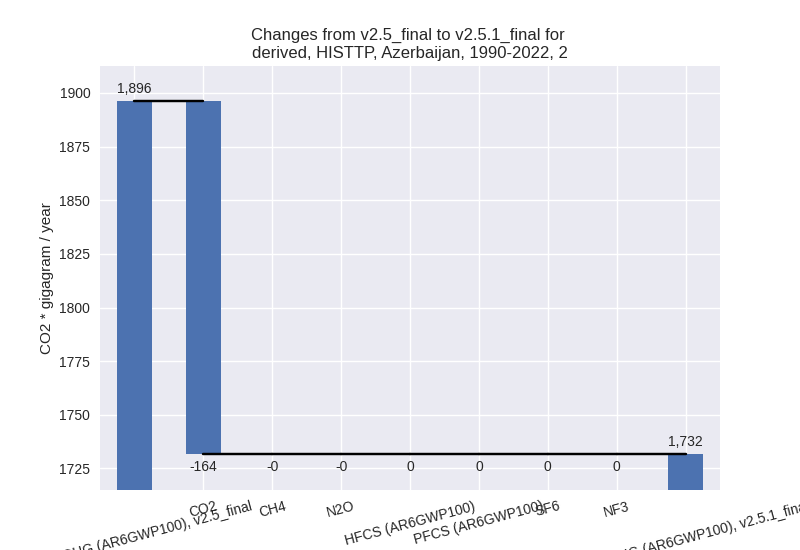
- M.AG: Total sectoral emissions in 2022 are 8374.99
Gg CO2 / year which is 12.2% of M.0.EL emissions. 2022 Emissions have
changed by 3.4% (276.87 Gg CO2 /
year). 1990-2022 Emissions have changed by 0.8% (48.58 Gg CO2 / year). For 2022 the
changes per gas
are:
The changes come from the following subsectors:- 3.A: Total sectoral emissions in 2022 are 4212.88
Gg CO2 / year which is 50.3% of category M.AG emissions. 2022 Emissions
have changed by -4.1% (-179.27 Gg
CO2 / year). 1990-2022 Emissions have changed by -0.2% (-6.12 Gg CO2 / year). For 2022 the
changes per gas
are:

There is no subsector information available in PRIMAP-hist. - M.AG.ELV: Total sectoral emissions in 2022 are
4162.10 Gg CO2 / year which is 49.7% of category M.AG emissions. 2022
Emissions have changed by 12.3%
(456.14 Gg CO2 / year). 1990-2022 Emissions have changed by 2.2% (54.71 Gg CO2 / year). For 2022 the
changes per gas
are:
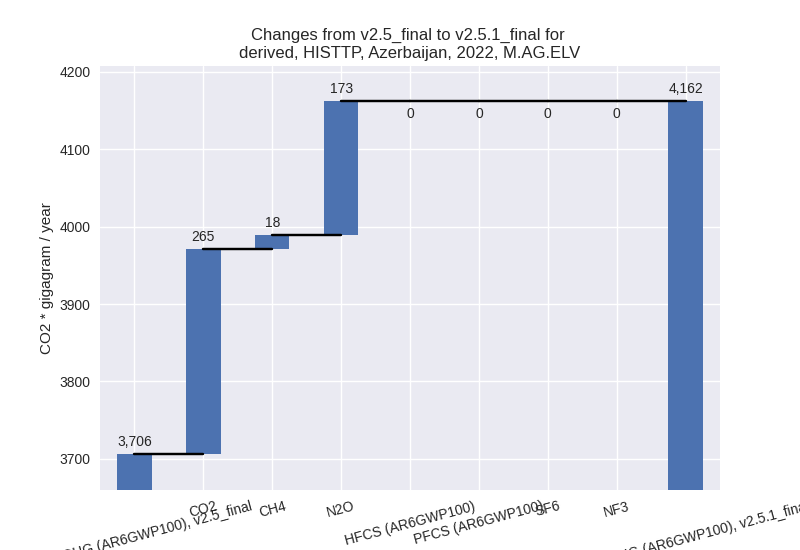
For 1990-2022 the changes per gas are: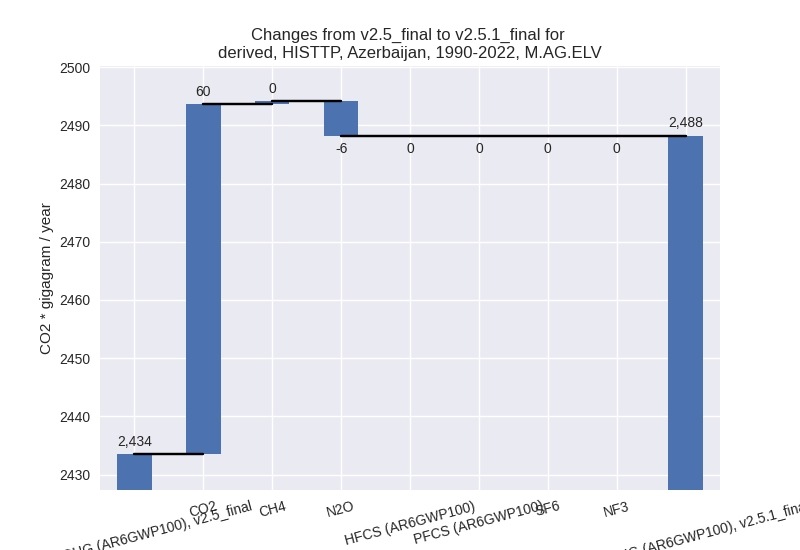
There is no subsector information available in PRIMAP-hist.
- 3.A: Total sectoral emissions in 2022 are 4212.88
Gg CO2 / year which is 50.3% of category M.AG emissions. 2022 Emissions
have changed by -4.1% (-179.27 Gg
CO2 / year). 1990-2022 Emissions have changed by -0.2% (-6.12 Gg CO2 / year). For 2022 the
changes per gas
are:
- 4: Total sectoral emissions in 2022 are 4172.04 Gg CO2 / year which is 6.1% of M.0.EL emissions. 2022 Emissions have changed by -0.4% (-15.52 Gg CO2 / year). 1990-2022 Emissions have changed by -0.0% (-0.44 Gg CO2 / year).
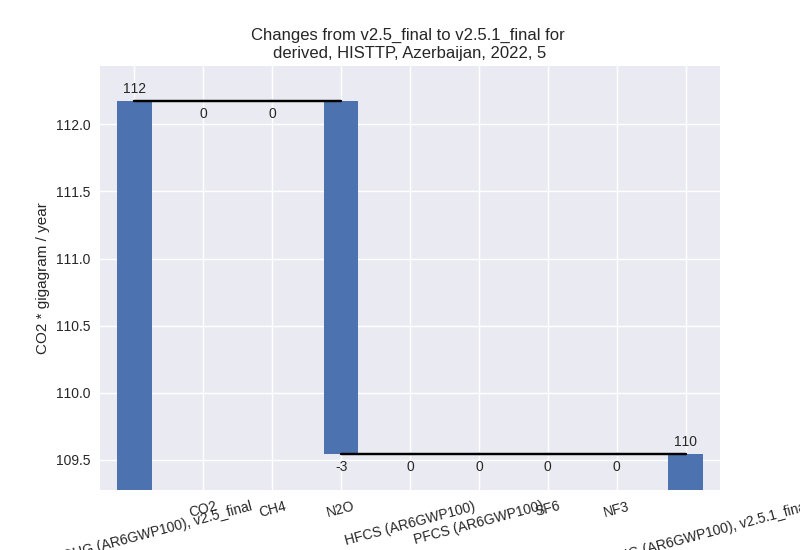
- 5: Total sectoral emissions in 2022 are 109.54 Gg
CO2 / year which is 0.2% of M.0.EL emissions. 2022 Emissions have
changed by -2.3% (-2.63 Gg CO2 /
year). 1990-2022 Emissions have changed by -0.1% (-0.08 Gg CO2 / year). For 2022 the
changes per gas
are: