Changes in PRIMAP-hist v2.5.1_final compared to v2.5_final for BASIC
2024-02-29
Johannes Gütschow
Change analysis for BASIC for PRIMAP-hist v2.5.1_final compared to v2.5_final
Overview over emissions by sector and gas
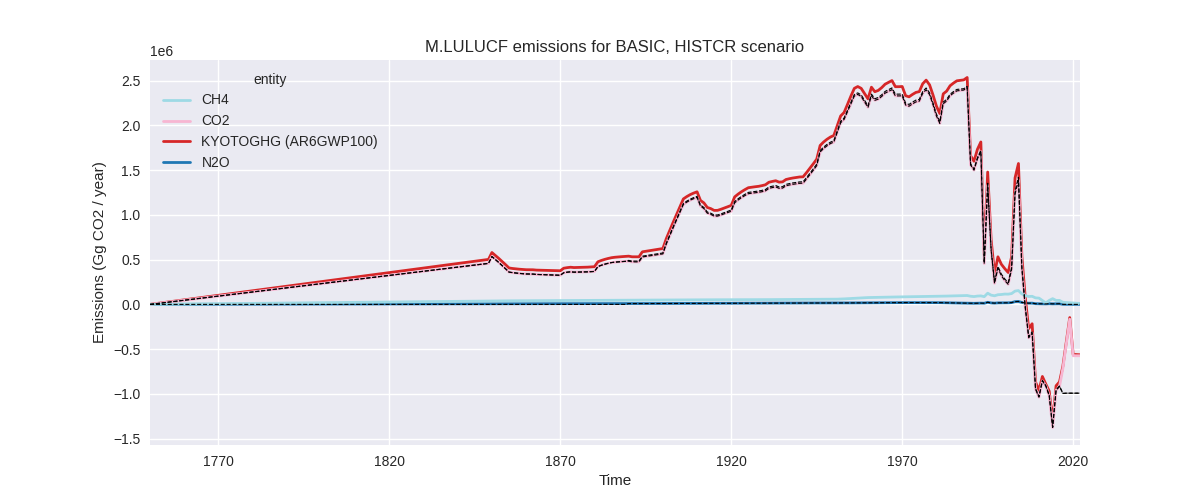
The following figures show the aggregate national total emissions excluding LULUCF AR6GWP100 for the country reported priority scenario. The dotted linesshow the v2.5_final data.


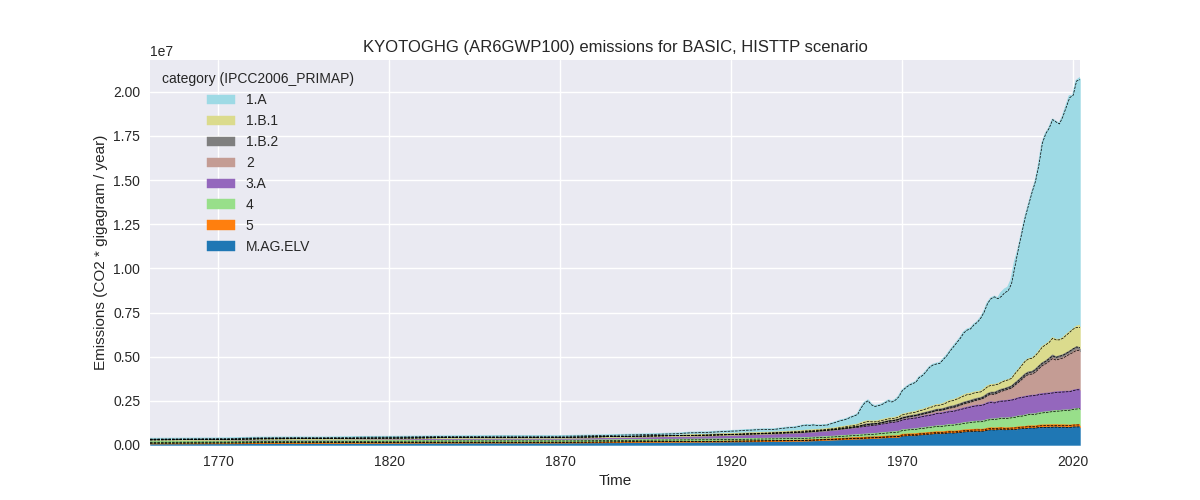
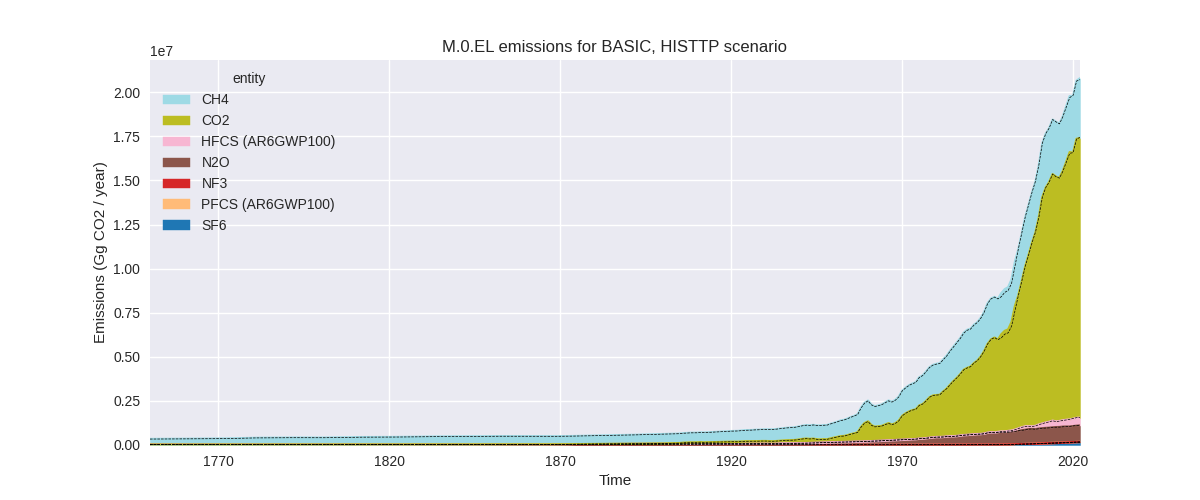
The following figures show the aggregate national total emissions excluding LULUCF AR6GWP100 for the third party priority scenario. The dotted linesshow the v2.5_final data.

Overview over changes
In the country reported priority scenario we have the following changes for aggregate Kyoto GHG and national total emissions excluding LULUCF (M.0.EL):
- Emissions in 2022 have changed by 0.2%% (48517.00 Gg CO2 / year)
- Emissions in 1990-2022 have changed by 0.2%% (19318.75 Gg CO2 / year)
In the third party priority scenario we have the following changes for aggregate Kyoto GHG and national total emissions excluding LULUCF (M.0.EL):
- Emissions in 2022 have changed by 0.4%% (73394.00 Gg CO2 / year)
- Emissions in 1990-2022 have changed by 0.2%% (26496.33 Gg CO2 / year)
Most important changes per scenario and time frame
In the country reported priority scenario the following sector-gas combinations have the highest absolute impact on national total KyotoGHG (AR6GWP100) emissions in 2022 (top 5):
- 1: 1.B.1, CH4 with 113021.90 Gg CO2 / year (19.0%)
- 2: 2, CO2 with -61509.30 Gg CO2 / year (-3.6%)
- 3: 4, CH4 with -26115.26 Gg CO2 / year (-6.0%)
- 4: 1.B.1, CO2 with 22045.43 Gg CO2 / year (5.8%)
- 5: 2, PFCS (AR6GWP100) with 18842.47 Gg CO2 / year (26.3%)
In the country reported priority scenario the following sector-gas combinations have the highest absolute impact on national total KyotoGHG (AR6GWP100) emissions in 1990-2022 (top 5):
- 1: 1.A, CO2 with 43259.25 Gg CO2 / year (0.5%)
- 2: M.AG.ELV, CO2 with -9365.37 Gg CO2 / year (-15.8%)
- 3: 2, CO2 with -9134.39 Gg CO2 / year (-0.9%)
- 4: 1.B.1, CO2 with -6066.88 Gg CO2 / year (-4.2%)
- 5: 2, PFCS (AR6GWP100) with 2483.07 Gg CO2 / year (7.2%)
In the third party priority scenario the following sector-gas combinations have the highest absolute impact on national total KyotoGHG (AR6GWP100) emissions in 2022 (top 5):
- 1: 1.B.1, CH4 with 108337.15 Gg CO2 / year (14.6%)
- 2: 1.B.1, CO2 with 24500.27 Gg CO2 / year (6.2%)
- 3: M.AG.ELV, N2O with -22979.83 Gg CO2 / year (-3.5%)
- 4: 3.A, CH4 with 19789.55 Gg CO2 / year (1.9%)
- 5: 1.B.2, CH4 with -19379.79 Gg CO2 / year (-11.0%)
In the third party priority scenario the following sector-gas combinations have the highest absolute impact on national total KyotoGHG (AR6GWP100) emissions in 1990-2022 (top 5):
- 1: 1.A, CO2 with 33944.07 Gg CO2 / year (0.4%)
- 2: 1.B.1, CH4 with 12549.08 Gg CO2 / year (2.4%)
- 3: 1.B.2, CH4 with -9731.90 Gg CO2 / year (-9.4%)
- 4: M.AG.ELV, CO2 with -9245.49 Gg CO2 / year (-15.7%)
- 5: 1.B.1, CO2 with -7365.15 Gg CO2 / year (-4.1%)
Notes on data changes
No country specific notes present for this changelog.
Changes by sector and gas
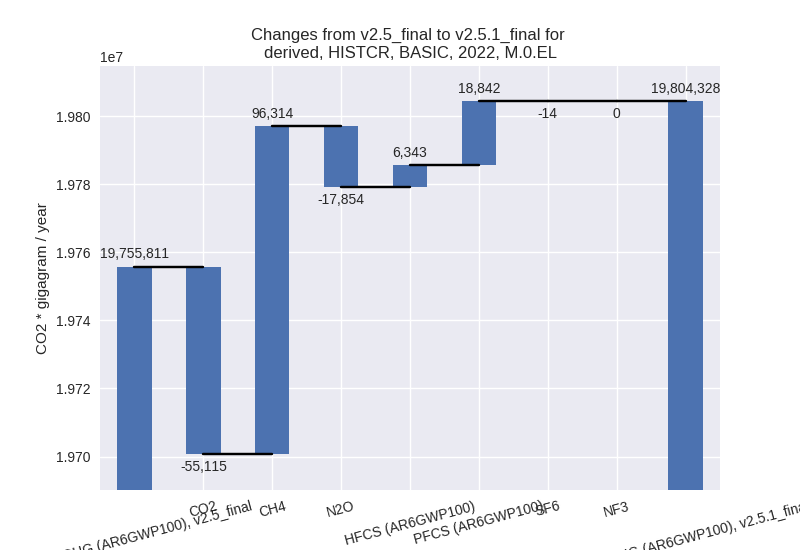
For each scenario and time frame the changes are displayed for all individual sectors and all individual gases. In the sector plot we use aggregate Kyoto GHGs in AR6GWP100. In the gas plot we usenational total emissions without LULUCF. ## country reported scenario
2022

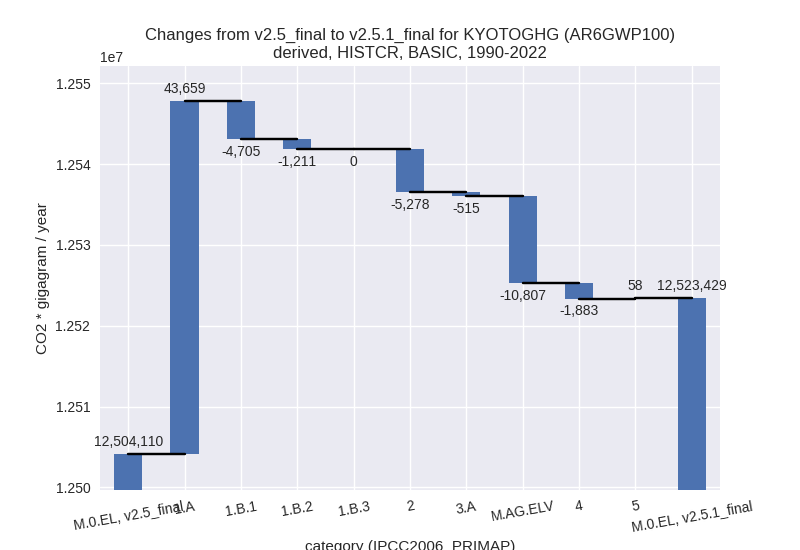
1990-2022

third party scenario
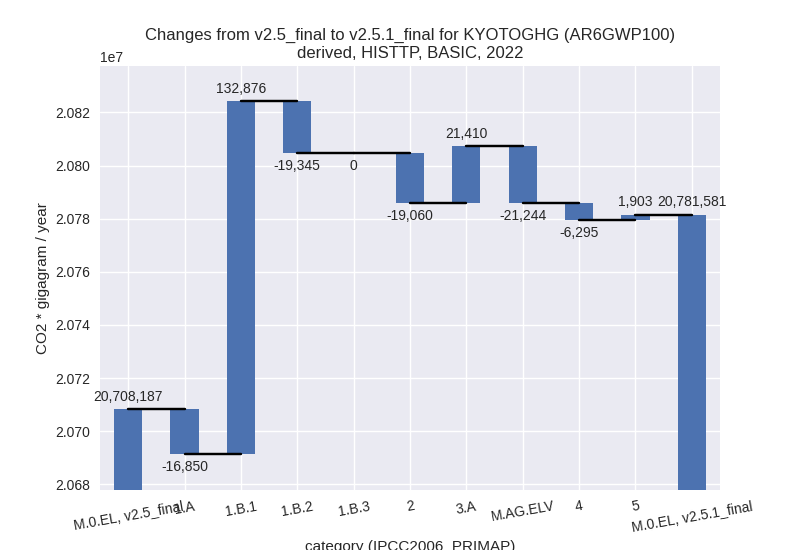
2022

1990-2022

Detailed changes for the scenarios:
country reported scenario (HISTCR):
Most important changes per time frame
For 2022 the following sector-gas combinations have the highest absolute impact on national total KyotoGHG (AR6GWP100) emissions in 2022 (top 5):
- 1: 1.B.1, CH4 with 113021.90 Gg CO2 / year (19.0%)
- 2: 2, CO2 with -61509.30 Gg CO2 / year (-3.6%)
- 3: 4, CH4 with -26115.26 Gg CO2 / year (-6.0%)
- 4: 1.B.1, CO2 with 22045.43 Gg CO2 / year (5.8%)
- 5: 2, PFCS (AR6GWP100) with 18842.47 Gg CO2 / year (26.3%)
For 1990-2022 the following sector-gas combinations have the highest absolute impact on national total KyotoGHG (AR6GWP100) emissions in 1990-2022 (top 5):
- 1: 1.A, CO2 with 43259.25 Gg CO2 / year (0.5%)
- 2: M.AG.ELV, CO2 with -9365.37 Gg CO2 / year (-15.8%)
- 3: 2, CO2 with -9134.39 Gg CO2 / year (-0.9%)
- 4: 1.B.1, CO2 with -6066.88 Gg CO2 / year (-4.2%)
- 5: 2, PFCS (AR6GWP100) with 2483.07 Gg CO2 / year (7.2%)
Changes in the main sectors for aggregate KyotoGHG (AR6GWP100) are
- 1: Total sectoral emissions in 2022 are 14783025.00 Gg CO2 / year which is 74.6% of M.0.EL emissions. 2022 Emissions have changed by 0.9% (129389.00 Gg CO2 / year). 1990-2022 Emissions have changed by 0.4% (37743.77 Gg CO2 / year).
- 2: Total sectoral emissions in 2022 are 2345712.50 Gg CO2 / year which is 11.8% of M.0.EL emissions. 2022 Emissions have changed by -1.4% (-32969.40 Gg CO2 / year). 1990-2022 Emissions have changed by -0.4% (-5278.03 Gg CO2 / year).
- M.AG: Total sectoral emissions in 2022 are 2067807.40 Gg CO2 / year which is 10.4% of M.0.EL emissions. 2022 Emissions have changed by -0.9% (-19681.80 Gg CO2 / year). 1990-2022 Emissions have changed by -0.6% (-11321.87 Gg CO2 / year).
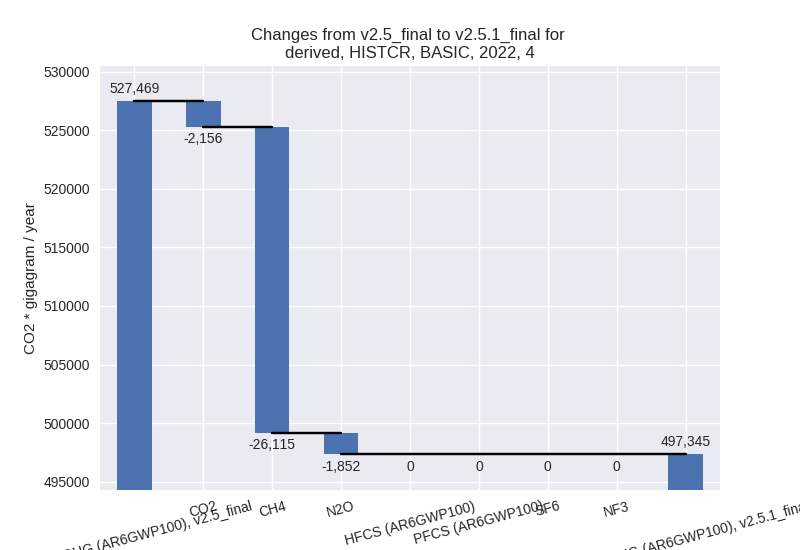
- 4: Total sectoral emissions in 2022 are 497345.24
Gg CO2 / year which is 2.5% of M.0.EL emissions. 2022 Emissions have
changed by -5.7% (-30123.50 Gg CO2 /
year). 1990-2022 Emissions have changed by -0.5% (-1882.71 Gg CO2 / year). For 2022
the changes per gas
are:
- 5: Total sectoral emissions in 2022 are 110437.97 Gg CO2 / year which is 0.6% of M.0.EL emissions. 2022 Emissions have changed by 1.8% (1903.47 Gg CO2 / year). 1990-2022 Emissions have changed by 0.1% (57.68 Gg CO2 / year).
third party scenario (HISTTP):
Most important changes per time frame
For 2022 the following sector-gas combinations have the highest absolute impact on national total KyotoGHG (AR6GWP100) emissions in 2022 (top 5):
- 1: 1.B.1, CH4 with 108337.15 Gg CO2 / year (14.6%)
- 2: 1.B.1, CO2 with 24500.27 Gg CO2 / year (6.2%)
- 3: M.AG.ELV, N2O with -22979.83 Gg CO2 / year (-3.5%)
- 4: 3.A, CH4 with 19789.55 Gg CO2 / year (1.9%)
- 5: 1.B.2, CH4 with -19379.79 Gg CO2 / year (-11.0%)
For 1990-2022 the following sector-gas combinations have the highest absolute impact on national total KyotoGHG (AR6GWP100) emissions in 1990-2022 (top 5):
- 1: 1.A, CO2 with 33944.07 Gg CO2 / year (0.4%)
- 2: 1.B.1, CH4 with 12549.08 Gg CO2 / year (2.4%)
- 3: 1.B.2, CH4 with -9731.90 Gg CO2 / year (-9.4%)
- 4: M.AG.ELV, CO2 with -9245.49 Gg CO2 / year (-15.7%)
- 5: 1.B.1, CO2 with -7365.15 Gg CO2 / year (-4.1%)
Changes in the main sectors for aggregate KyotoGHG (AR6GWP100) are
- 1: Total sectoral emissions in 2022 are 15479250.00 Gg CO2 / year which is 74.5% of M.0.EL emissions. 2022 Emissions have changed by 0.6% (96679.00 Gg CO2 / year). 1990-2022 Emissions have changed by 0.3% (30053.25 Gg CO2 / year).
- 2: Total sectoral emissions in 2022 are 2183298.20 Gg CO2 / year which is 10.5% of M.0.EL emissions. 2022 Emissions have changed by -0.9% (-19060.40 Gg CO2 / year). 1990-2022 Emissions have changed by 0.7% (7739.29 Gg CO2 / year).
- M.AG: Total sectoral emissions in 2022 are 2096108.00 Gg CO2 / year which is 10.1% of M.0.EL emissions. 2022 Emissions have changed by 0.0% (166.10 Gg CO2 / year). 1990-2022 Emissions have changed by -0.6% (-11163.24 Gg CO2 / year).
- 4: Total sectoral emissions in 2022 are 912486.24 Gg CO2 / year which is 4.4% of M.0.EL emissions. 2022 Emissions have changed by -0.7% (-6295.04 Gg CO2 / year). 1990-2022 Emissions have changed by -0.0% (-190.76 Gg CO2 / year).
- 5: Total sectoral emissions in 2022 are 110437.97 Gg CO2 / year which is 0.5% of M.0.EL emissions. 2022 Emissions have changed by 1.8% (1903.47 Gg CO2 / year). 1990-2022 Emissions have changed by 0.1% (57.68 Gg CO2 / year).