Changes in PRIMAP-hist v2.5.1_final compared to v2.5_final for Burundi
2024-02-29
Johannes Gütschow
Change analysis for Burundi for PRIMAP-hist v2.5.1_final compared to v2.5_final
Overview over emissions by sector and gas
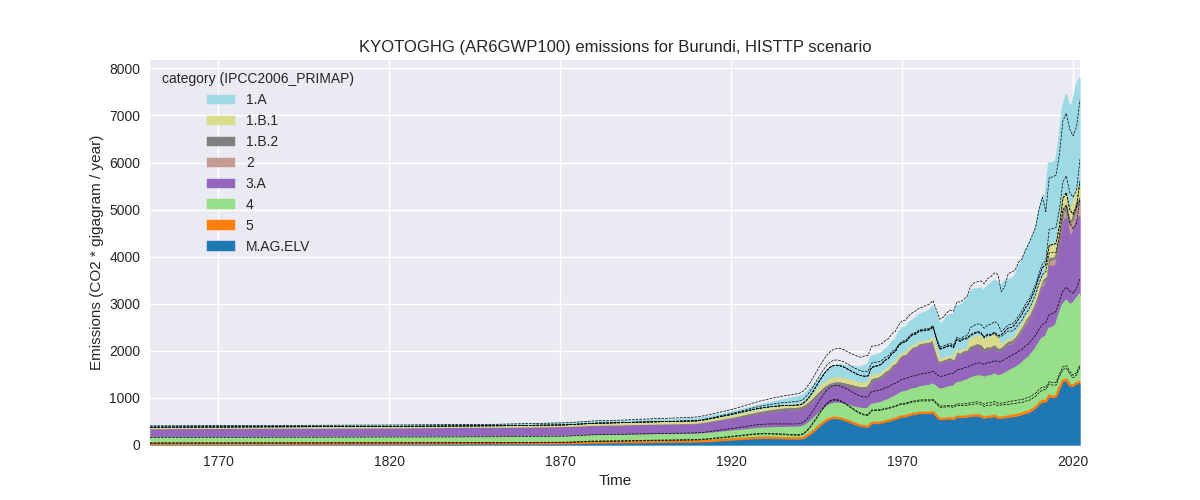
The following figures show the aggregate national total emissions excluding LULUCF AR6GWP100 for the country reported priority scenario. The dotted linesshow the v2.5_final data.
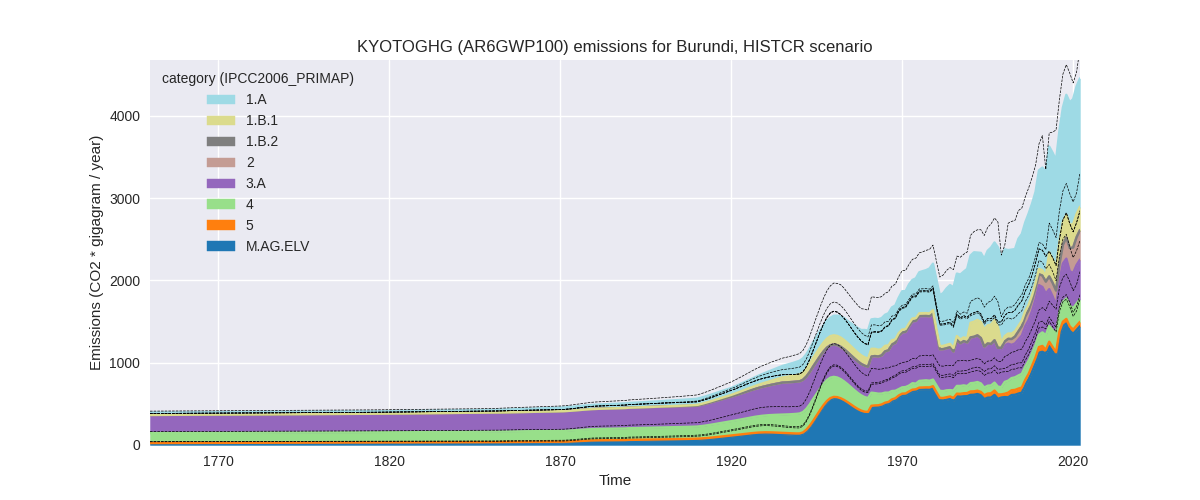
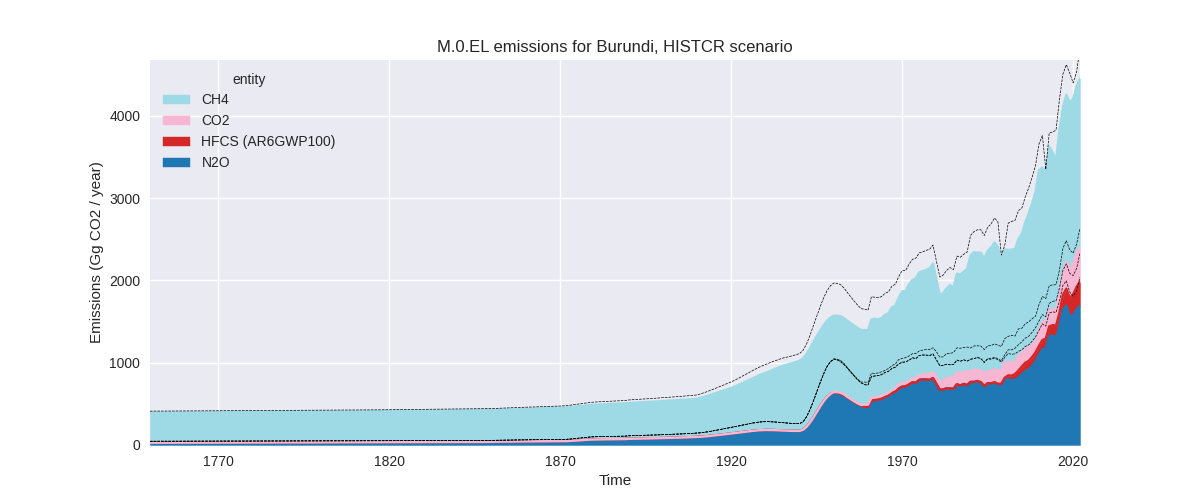
The following figures show the aggregate national total emissions excluding LULUCF AR6GWP100 for the third party priority scenario. The dotted linesshow the v2.5_final data.


Overview over changes
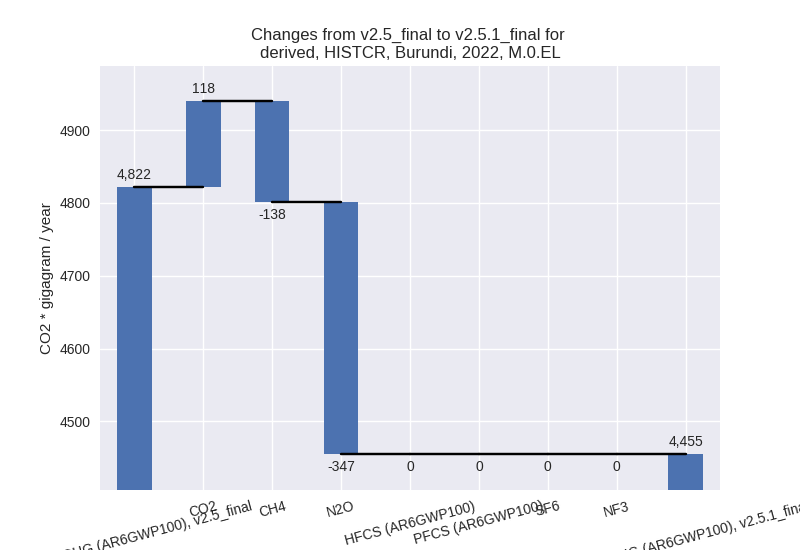
In the country reported priority scenario we have the following changes for aggregate Kyoto GHG and national total emissions excluding LULUCF (M.0.EL):
- Emissions in 2022 have changed by -7.6%% (-367.05 Gg CO2 / year)
- Emissions in 1990-2022 have changed by -8.6%% (-282.47 Gg CO2 / year)
In the third party priority scenario we have the following changes for aggregate Kyoto GHG and national total emissions excluding LULUCF (M.0.EL):
- Emissions in 2022 have changed by 6.2%% (456.73 Gg CO2 / year)
- Emissions in 1990-2022 have changed by 1.6%% (76.60 Gg CO2 / year)
Most important changes per scenario and time frame
In the country reported priority scenario the following sector-gas combinations have the highest absolute impact on national total KyotoGHG (AR6GWP100) emissions in 2022 (top 5):
- 1: M.AG.ELV, N2O with -345.24 Gg CO2 / year (-22.9%)
- 2: 1.B.1, CH4 with -175.46 Gg CO2 / year (-38.6%)
- 3: 1.A, CO2 with 116.98 Gg CO2 / year (49.6%)
- 4: 3.A, CH4 with 98.22 Gg CO2 / year (37.9%)
- 5: 1.A, CH4 with -63.53 Gg CO2 / year (-5.6%)
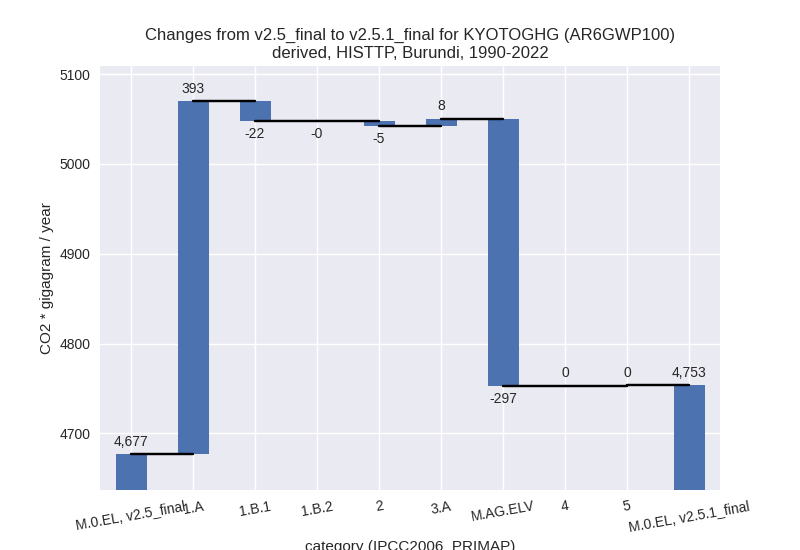
In the country reported priority scenario the following sector-gas combinations have the highest absolute impact on national total KyotoGHG (AR6GWP100) emissions in 1990-2022 (top 5):
- 1: M.AG.ELV, N2O with -296.24 Gg CO2 / year (-29.5%)
- 2: 1.B.1, CH4 with -22.07 Gg CO2 / year (-11.6%)
- 3: 1.A, CH4 with 20.21 Gg CO2 / year (2.4%)
- 4: 1.A, CO2 with 14.17 Gg CO2 / year (8.8%)
- 5: 3.A, CH4 with 5.47 Gg CO2 / year (1.3%)
In the third party priority scenario the following sector-gas combinations have the highest absolute impact on national total KyotoGHG (AR6GWP100) emissions in 2022 (top 5):
- 1: 1.A, CH4 with 677.61 Gg CO2 / year (109.2%)
- 2: M.AG.ELV, N2O with -345.24 Gg CO2 / year (-22.9%)
- 3: 1.A, CO2 with 273.30 Gg CO2 / year (49.6%)
- 4: 1.B.1, CH4 with -175.46 Gg CO2 / year (-38.6%)
- 5: 1.A, N2O with 86.97 Gg CO2 / year (98.3%)
In the third party priority scenario the following sector-gas combinations have the highest absolute impact on national total KyotoGHG (AR6GWP100) emissions in 1990-2022 (top 5):
- 1: 1.A, CH4 with 320.02 Gg CO2 / year (44.7%)
- 2: M.AG.ELV, N2O with -296.24 Gg CO2 / year (-29.5%)
- 3: 1.A, N2O with 39.89 Gg CO2 / year (40.4%)
- 4: 1.A, CO2 with 33.11 Gg CO2 / year (11.0%)
- 5: 1.B.1, CH4 with -22.07 Gg CO2 / year (-11.6%)
Notes on data changes
Here we list notes explaining important emissions changes for the country. ’' means that the following text only applies to the TP time series, while means that it only applies to the CR scenario. Otherwise the note applies to both scenarios.
- M.AG.ELV, N2O: Updated FAO data are much lower than the data used in v2.5. for all years.
- 1.B.1, CH4: New EDGAR data are lower for most years.
- 1.A, CH4: New EDGAR data are much higher, especially for 2012 and later years. This affects the TP time series more, but also the CR time-series.
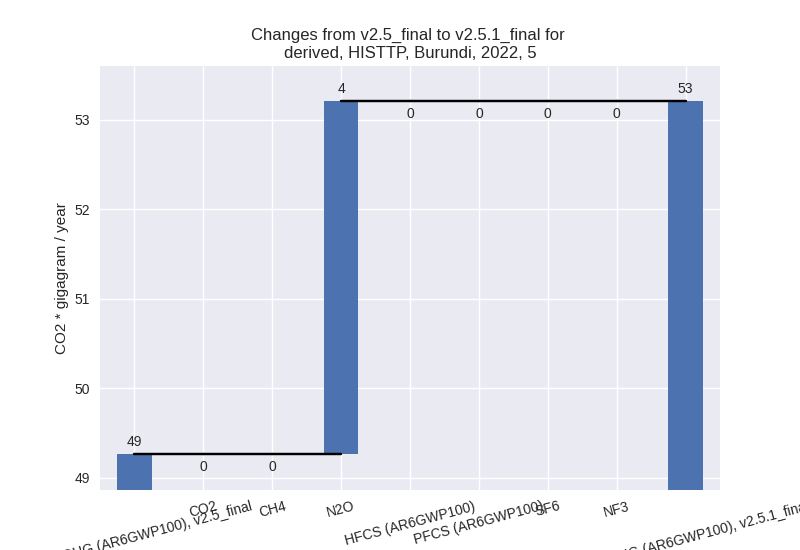
Changes by sector and gas
For each scenario and time frame the changes are displayed for all individual sectors and all individual gases. In the sector plot we use aggregate Kyoto GHGs in AR6GWP100. In the gas plot we usenational total emissions without LULUCF. ## country reported scenario
2022
1990-2022


third party scenario
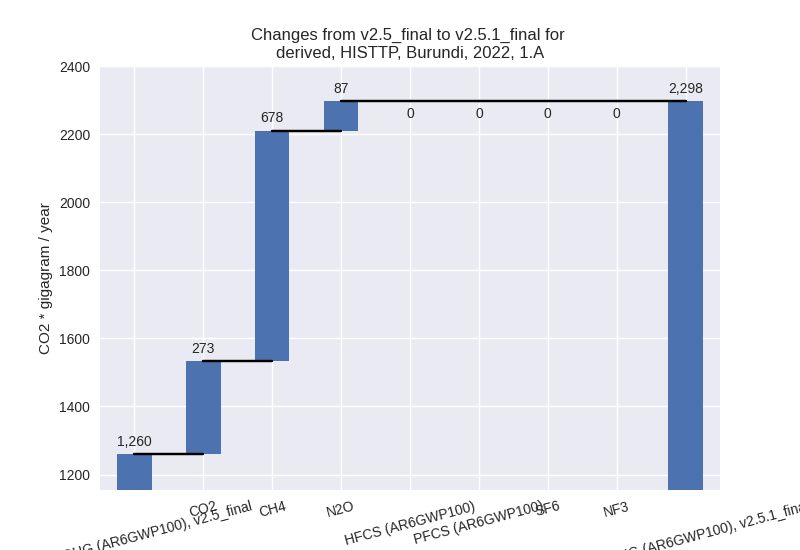
2022

1990-2022

Detailed changes for the scenarios:
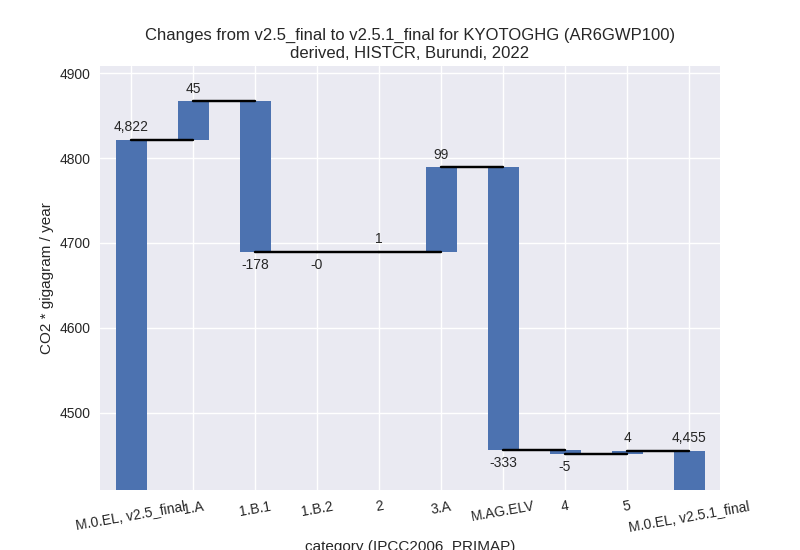
country reported scenario (HISTCR):
Most important changes per time frame
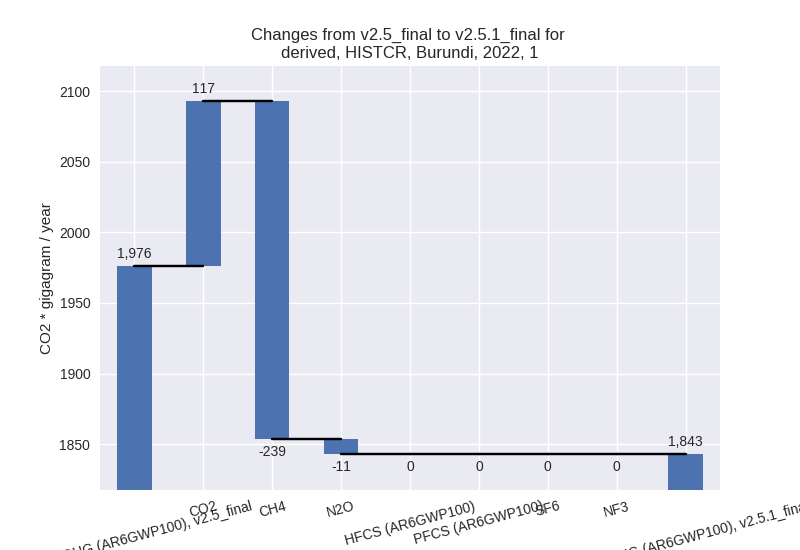
For 2022 the following sector-gas combinations have the highest absolute impact on national total KyotoGHG (AR6GWP100) emissions in 2022 (top 5):
- 1: M.AG.ELV, N2O with -345.24 Gg CO2 / year (-22.9%)
- 2: 1.B.1, CH4 with -175.46 Gg CO2 / year (-38.6%)
- 3: 1.A, CO2 with 116.98 Gg CO2 / year (49.6%)
- 4: 3.A, CH4 with 98.22 Gg CO2 / year (37.9%)
- 5: 1.A, CH4 with -63.53 Gg CO2 / year (-5.6%)
For 1990-2022 the following sector-gas combinations have the highest absolute impact on national total KyotoGHG (AR6GWP100) emissions in 1990-2022 (top 5):
- 1: M.AG.ELV, N2O with -296.24 Gg CO2 / year (-29.5%)
- 2: 1.B.1, CH4 with -22.07 Gg CO2 / year (-11.6%)
- 3: 1.A, CH4 with 20.21 Gg CO2 / year (2.4%)
- 4: 1.A, CO2 with 14.17 Gg CO2 / year (8.8%)
- 5: 3.A, CH4 with 5.47 Gg CO2 / year (1.3%)
Changes in the main sectors for aggregate KyotoGHG (AR6GWP100) are
- 1: Total sectoral emissions in 2022 are 1842.83 Gg
CO2 / year which is 41.4% of M.0.EL emissions. 2022 Emissions have
changed by -6.7% (-133.07 Gg CO2 /
year). 1990-2022 Emissions have changed by 1.1% (14.31 Gg CO2 / year). For 2022 the
changes per gas
are:
The changes come from the following subsectors:- 1.A: Total sectoral emissions in 2022 are 1560.32
Gg CO2 / year which is 84.7% of category 1 emissions. 2022 Emissions
have changed by 3.0% (45.14 Gg CO2 /
year). 1990-2022 Emissions have changed by 3.3% (36.76 Gg CO2 / year). For 2022 the
changes per gas
are:

For 1990-2022 the changes per gas are: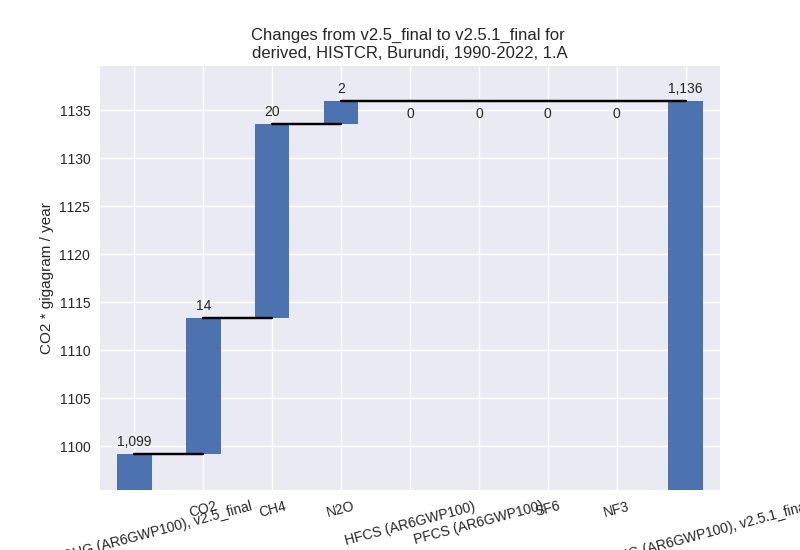
There is no subsector information available in PRIMAP-hist. - 1.B.1: Total sectoral emissions in 2022 are 282.51
Gg CO2 / year which is 15.3% of category 1 emissions. 2022 Emissions
have changed by -38.6% (-177.79 Gg
CO2 / year). 1990-2022 Emissions have changed by -11.6% (-22.36 Gg CO2 / year). For 2022
the changes per gas
are:
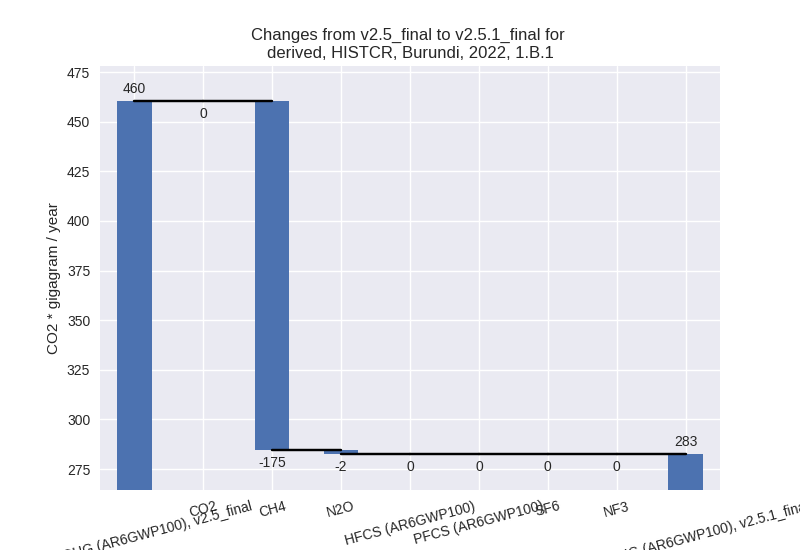
For 1990-2022 the changes per gas are:
There is no subsector information available in PRIMAP-hist. - 1.B.2: Total sectoral emissions in 2022 are 0.00 Gg
CO2 / year which is 0.0% of category 1 emissions. 2022 Emissions have
changed by -99.6% (-0.42 Gg CO2 /
year). 1990-2022 Emissions have changed by -98.1% (-0.09 Gg CO2 / year). For 2022 the
changes per gas
are:

For 1990-2022 the changes per gas are: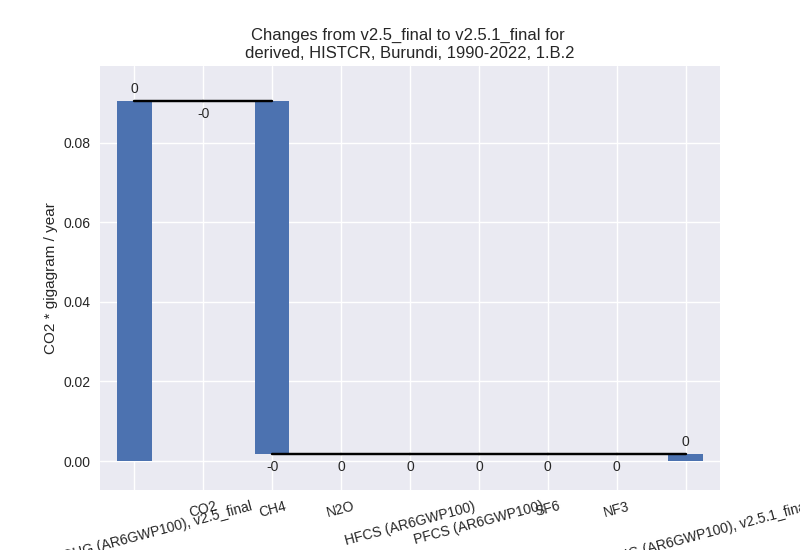
There is no subsector information available in PRIMAP-hist.
- 1.A: Total sectoral emissions in 2022 are 1560.32
Gg CO2 / year which is 84.7% of category 1 emissions. 2022 Emissions
have changed by 3.0% (45.14 Gg CO2 /
year). 1990-2022 Emissions have changed by 3.3% (36.76 Gg CO2 / year). For 2022 the
changes per gas
are:
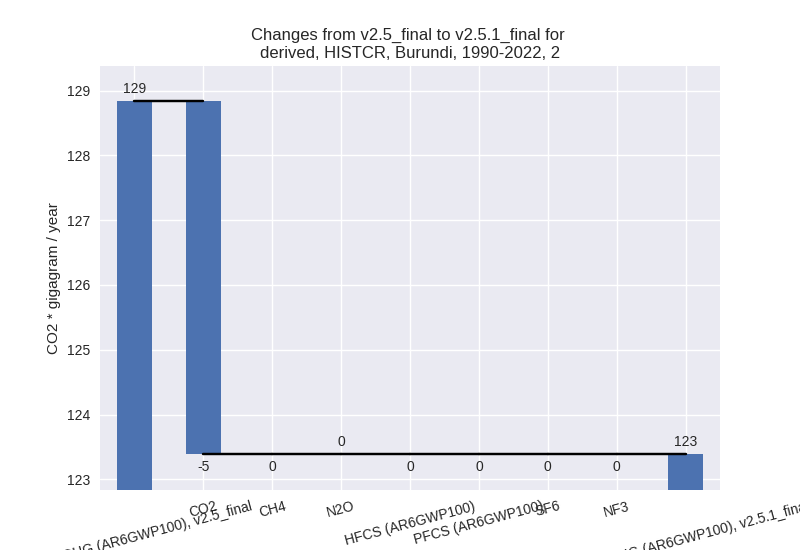
- 2: Total sectoral emissions in 2022 are 360.03 Gg
CO2 / year which is 8.1% of M.0.EL emissions. 2022 Emissions have
changed by 0.3% (1.01 Gg CO2 /
year). 1990-2022 Emissions have changed by -4.2% (-5.45 Gg CO2 / year). For 1990-2022
the changes per gas
are:
- M.AG: Total sectoral emissions in 2022 are 1922.52
Gg CO2 / year which is 43.2% of M.0.EL emissions. 2022 Emissions have
changed by -10.8% (-233.94 Gg CO2 /
year). 1990-2022 Emissions have changed by -17.5% (-291.29 Gg CO2 / year). For 2022
the changes per gas
are:

For 1990-2022 the changes per gas are:
The changes come from the following subsectors:- 3.A: Total sectoral emissions in 2022 are 479.01 Gg
CO2 / year which is 24.9% of category M.AG emissions. 2022 Emissions
have changed by 26.2% (99.50 Gg CO2
/ year). 1990-2022 Emissions have changed by 1.1% (5.40 Gg CO2 / year). For 2022 the
changes per gas
are:

There is no subsector information available in PRIMAP-hist. - M.AG.ELV: Total sectoral emissions in 2022 are
1443.51 Gg CO2 / year which is 75.1% of category M.AG emissions. 2022
Emissions have changed by -18.8%
(-333.44 Gg CO2 / year). 1990-2022 Emissions have changed by -24.9% (-296.69 Gg CO2 / year). For 2022
the changes per gas
are:
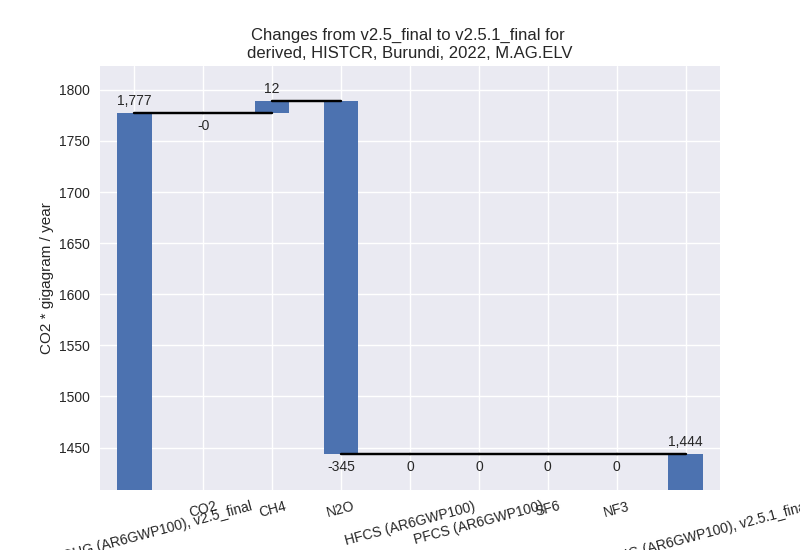
For 1990-2022 the changes per gas are:
There is no subsector information available in PRIMAP-hist.
- 3.A: Total sectoral emissions in 2022 are 479.01 Gg
CO2 / year which is 24.9% of category M.AG emissions. 2022 Emissions
have changed by 26.2% (99.50 Gg CO2
/ year). 1990-2022 Emissions have changed by 1.1% (5.40 Gg CO2 / year). For 2022 the
changes per gas
are:
- 4: Total sectoral emissions in 2022 are 276.25 Gg CO2 / year which is 6.2% of M.0.EL emissions. 2022 Emissions have changed by -1.8% (-4.99 Gg CO2 / year). 1990-2022 Emissions have changed by -0.1% (-0.15 Gg CO2 / year).
- 5: Total sectoral emissions in 2022 are 53.21 Gg
CO2 / year which is 1.2% of M.0.EL emissions. 2022 Emissions have
changed by 8.0% (3.95 Gg CO2 /
year). 1990-2022 Emissions have changed by 0.2% (0.12 Gg CO2 / year). For 2022 the
changes per gas
are:

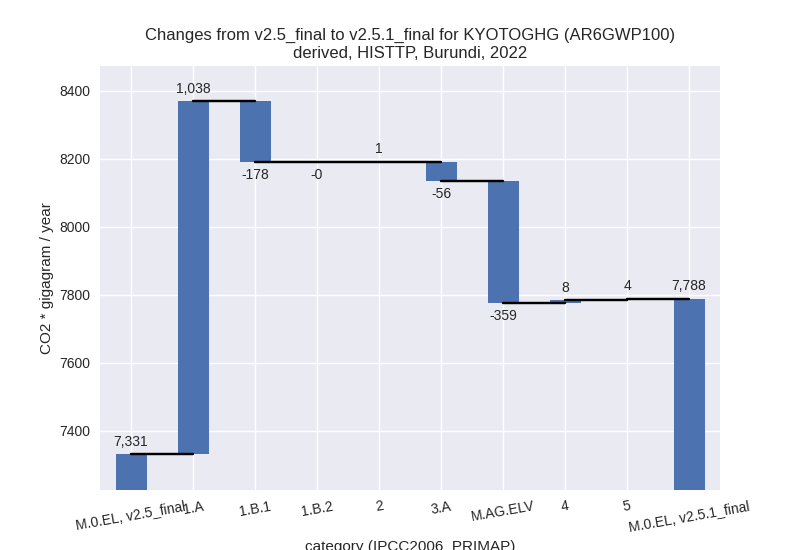
third party scenario (HISTTP):
Most important changes per time frame
For 2022 the following sector-gas combinations have the highest absolute impact on national total KyotoGHG (AR6GWP100) emissions in 2022 (top 5):
- 1: 1.A, CH4 with 677.61 Gg CO2 / year (109.2%)
- 2: M.AG.ELV, N2O with -345.24 Gg CO2 / year (-22.9%)
- 3: 1.A, CO2 with 273.30 Gg CO2 / year (49.6%)
- 4: 1.B.1, CH4 with -175.46 Gg CO2 / year (-38.6%)
- 5: 1.A, N2O with 86.97 Gg CO2 / year (98.3%)
For 1990-2022 the following sector-gas combinations have the highest absolute impact on national total KyotoGHG (AR6GWP100) emissions in 1990-2022 (top 5):
- 1: 1.A, CH4 with 320.02 Gg CO2 / year (44.7%)
- 2: M.AG.ELV, N2O with -296.24 Gg CO2 / year (-29.5%)
- 3: 1.A, N2O with 39.89 Gg CO2 / year (40.4%)
- 4: 1.A, CO2 with 33.11 Gg CO2 / year (11.0%)
- 5: 1.B.1, CH4 with -22.07 Gg CO2 / year (-11.6%)
Changes in the main sectors for aggregate KyotoGHG (AR6GWP100) are
- 1: Total sectoral emissions in 2022 are 2580.08 Gg
CO2 / year which is 33.1% of M.0.EL emissions. 2022 Emissions have
changed by 50.0% (859.67 Gg CO2 /
year). 1990-2022 Emissions have changed by 28.3% (370.57 Gg CO2 / year). For 2022 the
changes per gas
are:
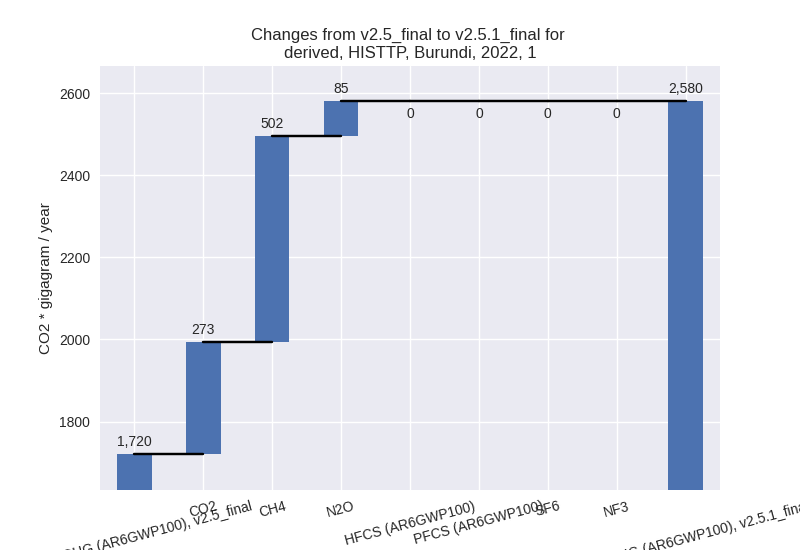
For 1990-2022 the changes per gas are: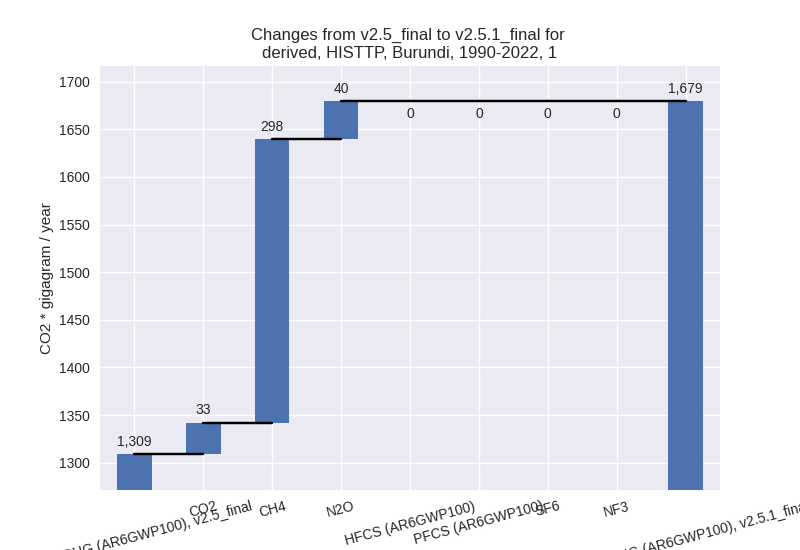
The changes come from the following subsectors:- 1.A: Total sectoral emissions in 2022 are 2297.56
Gg CO2 / year which is 89.1% of category 1 emissions. 2022 Emissions
have changed by 82.4% (1037.88 Gg
CO2 / year). 1990-2022 Emissions have changed by 35.2% (393.02 Gg CO2 / year). For 2022 the
changes per gas
are:
For 1990-2022 the changes per gas are: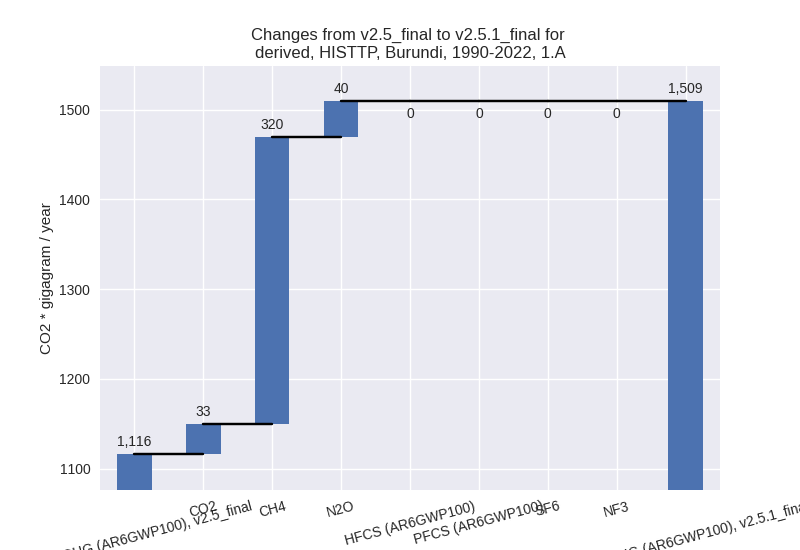
There is no subsector information available in PRIMAP-hist. - 1.B.1: Total sectoral emissions in 2022 are 282.51
Gg CO2 / year which is 10.9% of category 1 emissions. 2022 Emissions
have changed by -38.6% (-177.79 Gg
CO2 / year). 1990-2022 Emissions have changed by -11.6% (-22.36 Gg CO2 / year). For 2022
the changes per gas
are:

For 1990-2022 the changes per gas are: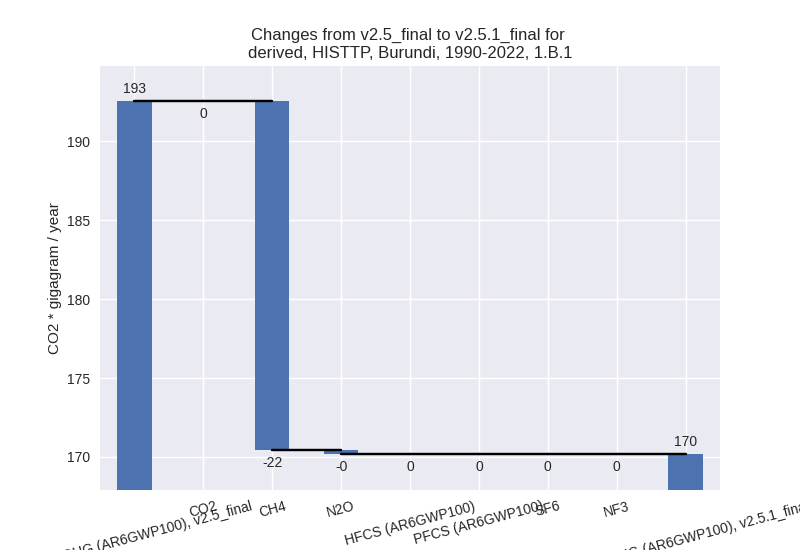
There is no subsector information available in PRIMAP-hist. - 1.B.2: Total sectoral emissions in 2022 are 0.00 Gg
CO2 / year which is 0.0% of category 1 emissions. 2022 Emissions have
changed by -99.6% (-0.42 Gg CO2 /
year). 1990-2022 Emissions have changed by -98.1% (-0.09 Gg CO2 / year). For 2022 the
changes per gas
are:
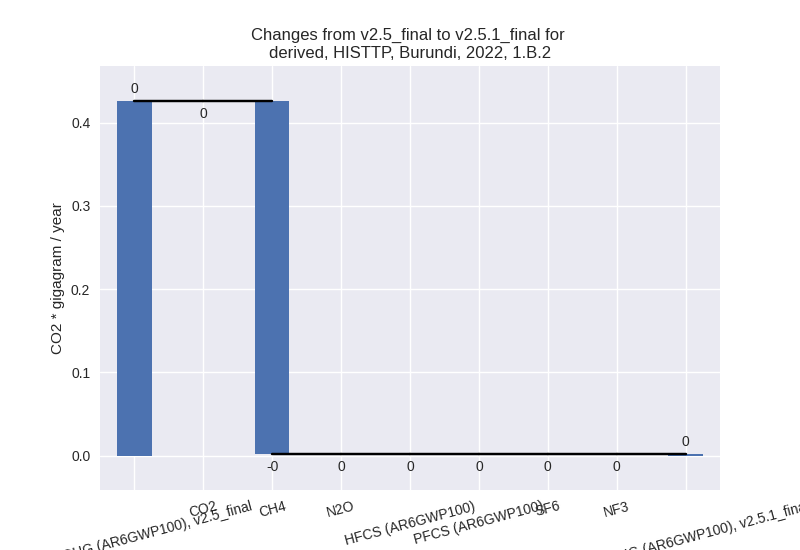
For 1990-2022 the changes per gas are:
There is no subsector information available in PRIMAP-hist.
- 1.A: Total sectoral emissions in 2022 are 2297.56
Gg CO2 / year which is 89.1% of category 1 emissions. 2022 Emissions
have changed by 82.4% (1037.88 Gg
CO2 / year). 1990-2022 Emissions have changed by 35.2% (393.02 Gg CO2 / year). For 2022 the
changes per gas
are:
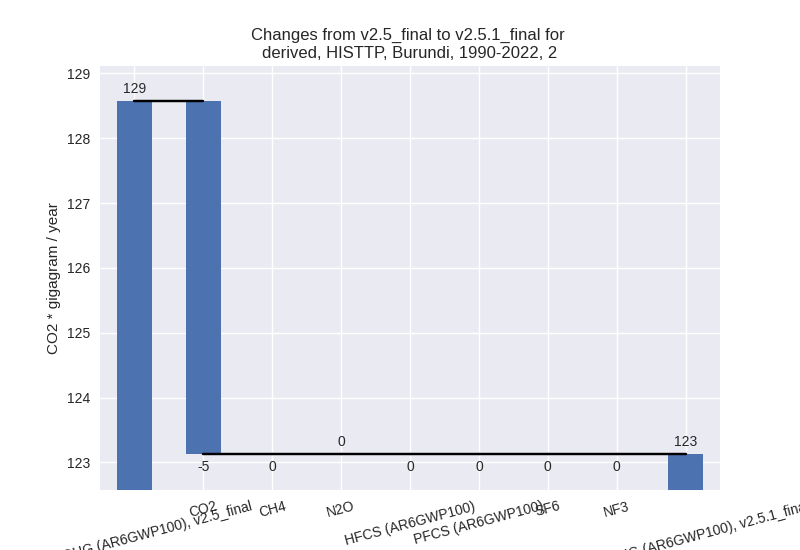
- 2: Total sectoral emissions in 2022 are 360.03 Gg
CO2 / year which is 4.6% of M.0.EL emissions. 2022 Emissions have
changed by 0.3% (1.01 Gg CO2 /
year). 1990-2022 Emissions have changed by -4.2% (-5.44 Gg CO2 / year). For 1990-2022
the changes per gas
are:
- M.AG: Total sectoral emissions in 2022 are 2946.12
Gg CO2 / year which is 37.8% of M.0.EL emissions. 2022 Emissions have
changed by -12.4% (-415.49 Gg CO2 /
year). 1990-2022 Emissions have changed by -14.5% (-288.88 Gg CO2 / year). For 2022
the changes per gas
are:
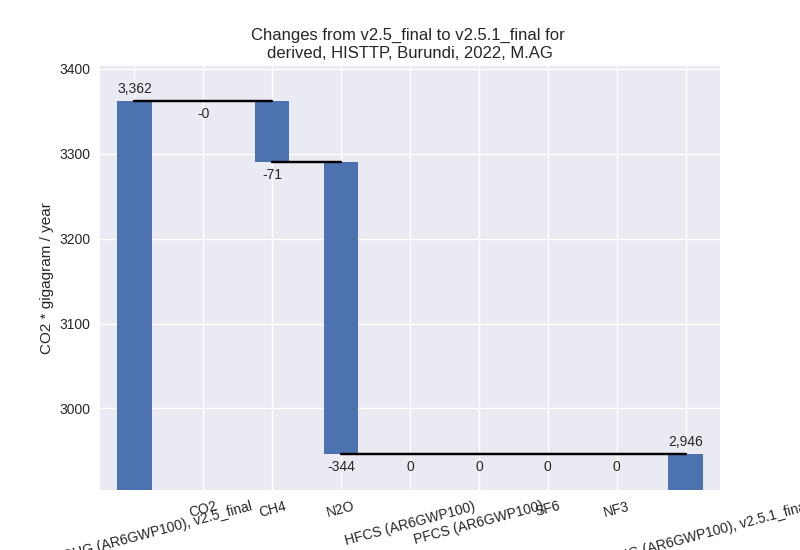
For 1990-2022 the changes per gas are: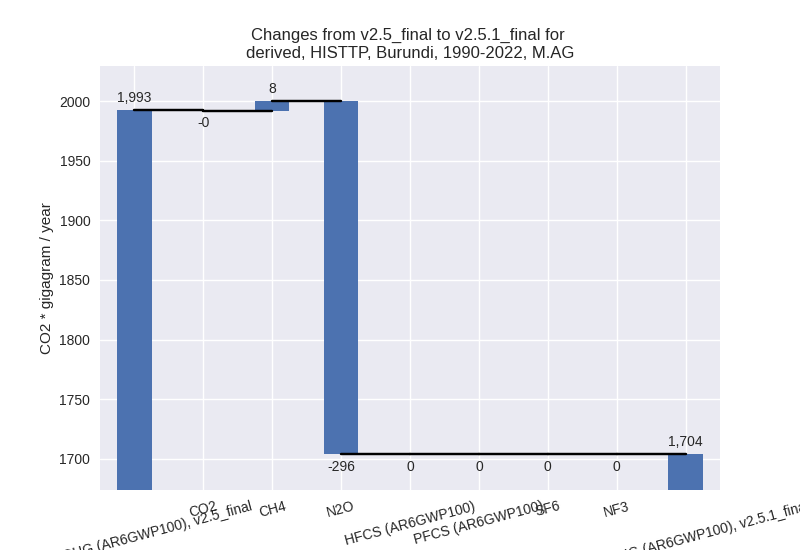
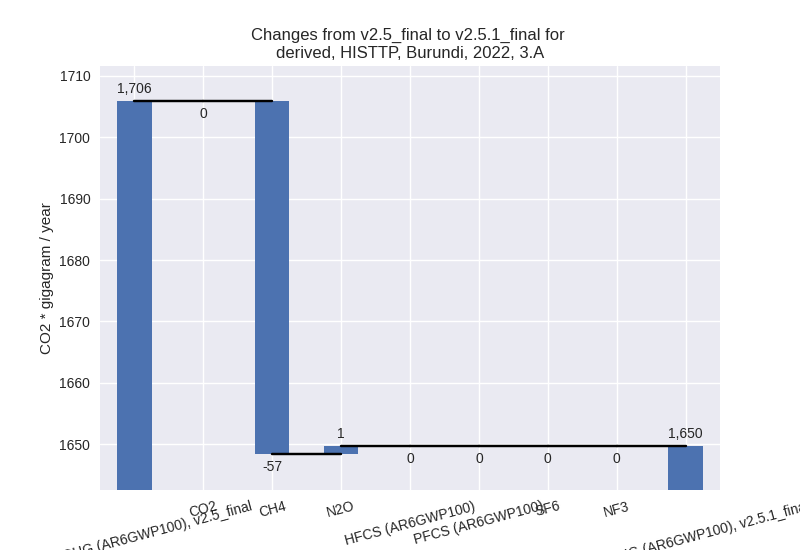
The changes come from the following subsectors:- 3.A: Total sectoral emissions in 2022 are 1649.68
Gg CO2 / year which is 56.0% of category M.AG emissions. 2022 Emissions
have changed by -3.3% (-56.16 Gg CO2
/ year). 1990-2022 Emissions have changed by 0.9% (8.40 Gg CO2 / year). For 2022 the
changes per gas
are:
There is no subsector information available in PRIMAP-hist. - M.AG.ELV: Total sectoral emissions in 2022 are
1296.44 Gg CO2 / year which is 44.0% of category M.AG emissions. 2022
Emissions have changed by -21.7%
(-359.33 Gg CO2 / year). 1990-2022 Emissions have changed by -27.4% (-297.28 Gg CO2 / year). For 2022
the changes per gas
are:
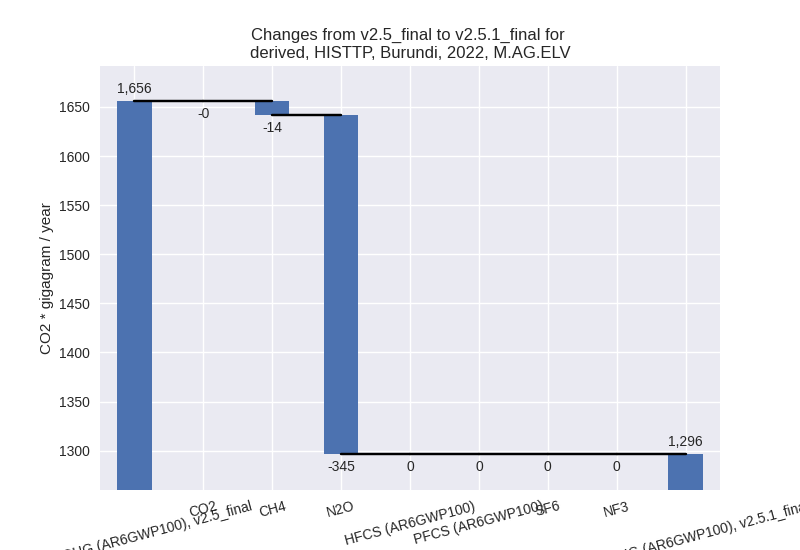
For 1990-2022 the changes per gas are:
There is no subsector information available in PRIMAP-hist.
- 3.A: Total sectoral emissions in 2022 are 1649.68
Gg CO2 / year which is 56.0% of category M.AG emissions. 2022 Emissions
have changed by -3.3% (-56.16 Gg CO2
/ year). 1990-2022 Emissions have changed by 0.9% (8.40 Gg CO2 / year). For 2022 the
changes per gas
are:
- 4: Total sectoral emissions in 2022 are 1848.42 Gg CO2 / year which is 23.7% of M.0.EL emissions. 2022 Emissions have changed by 0.4% (7.60 Gg CO2 / year). 1990-2022 Emissions have changed by 0.0% (0.23 Gg CO2 / year).
- 5: Total sectoral emissions in 2022 are 53.21 Gg
CO2 / year which is 0.7% of M.0.EL emissions. 2022 Emissions have
changed by 8.0% (3.95 Gg CO2 /
year). 1990-2022 Emissions have changed by 0.2% (0.12 Gg CO2 / year). For 2022 the
changes per gas
are: