Changes in PRIMAP-hist v2.5.1_final compared to v2.5_final for Belgium
2024-02-29
Johannes Gütschow
Change analysis for Belgium for PRIMAP-hist v2.5.1_final compared to v2.5_final
Overview over emissions by sector and gas
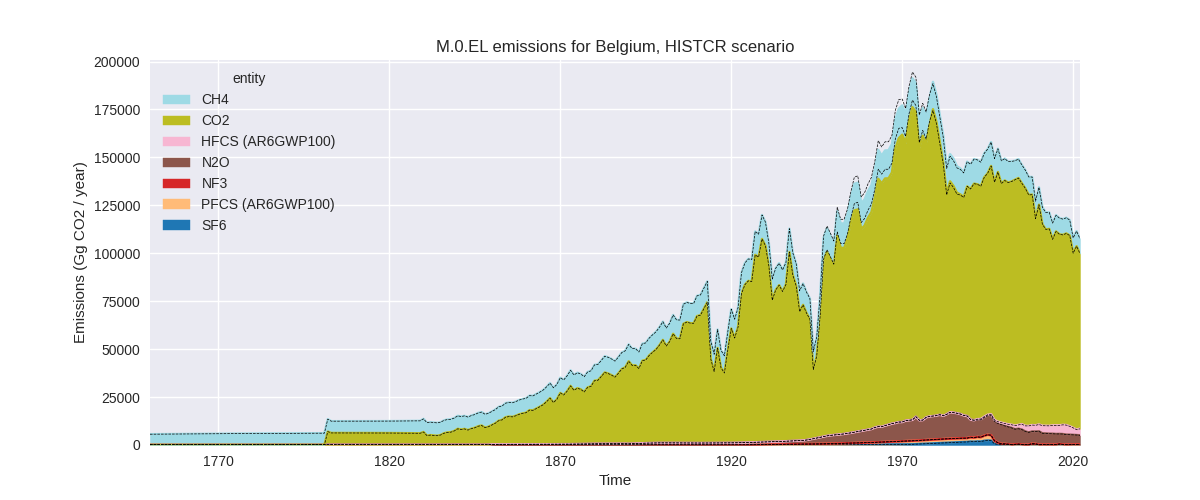
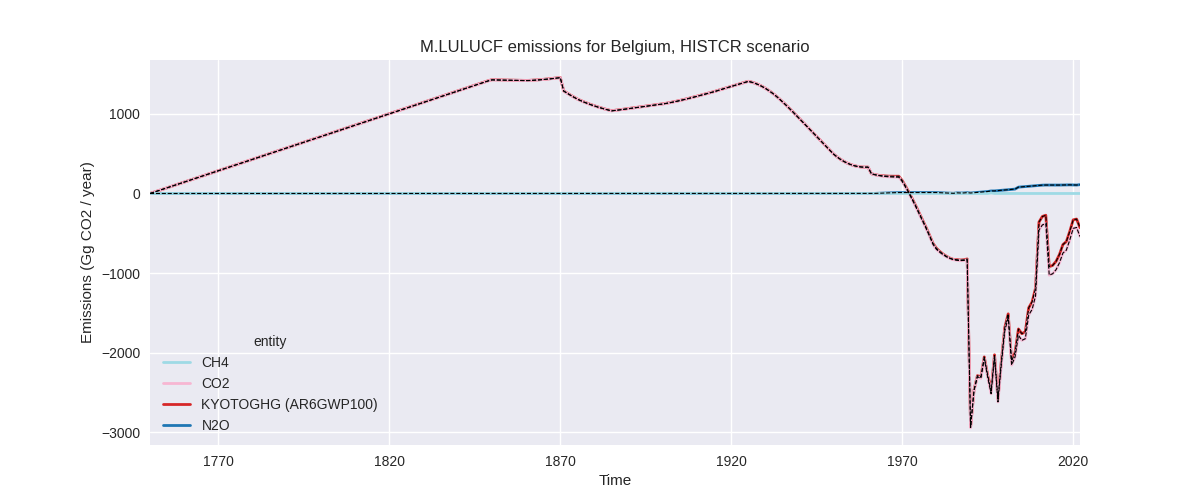
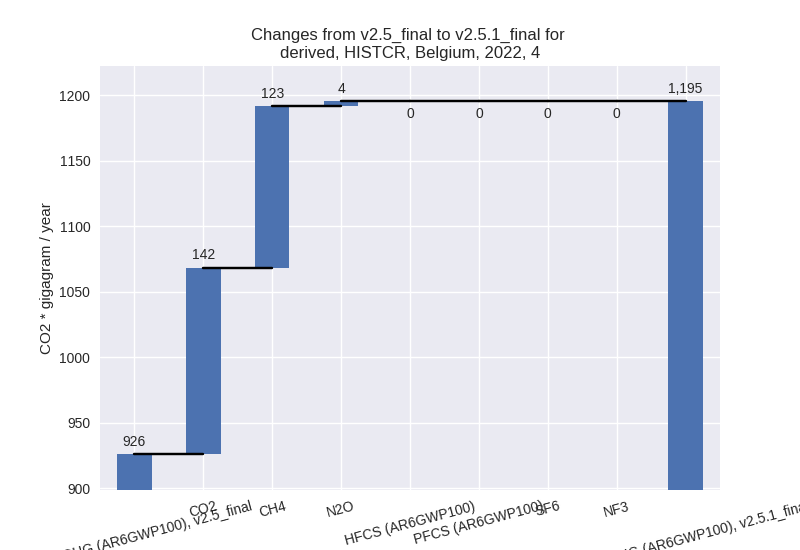
The following figures show the aggregate national total emissions excluding LULUCF AR6GWP100 for the country reported priority scenario. The dotted linesshow the v2.5_final data.

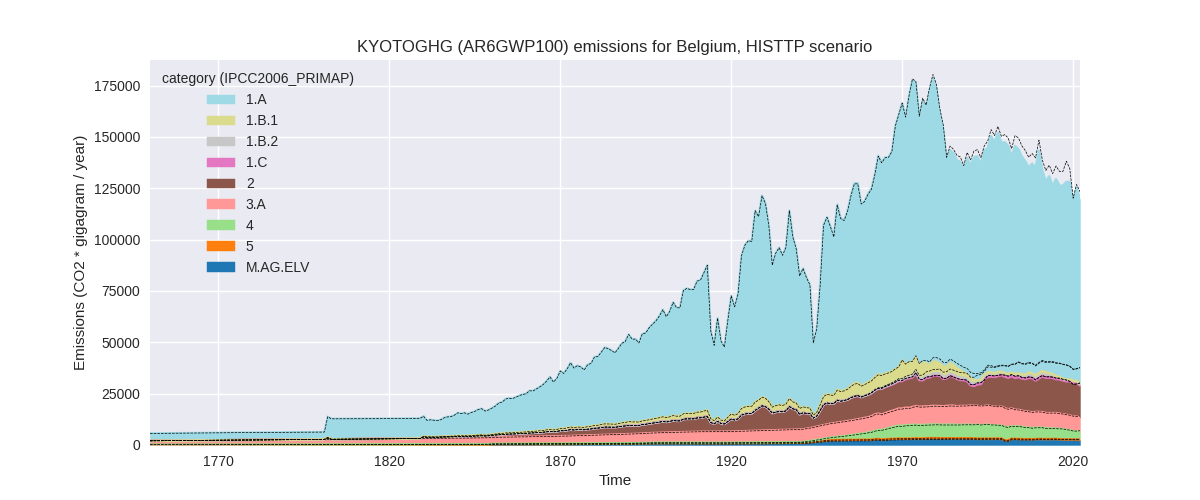
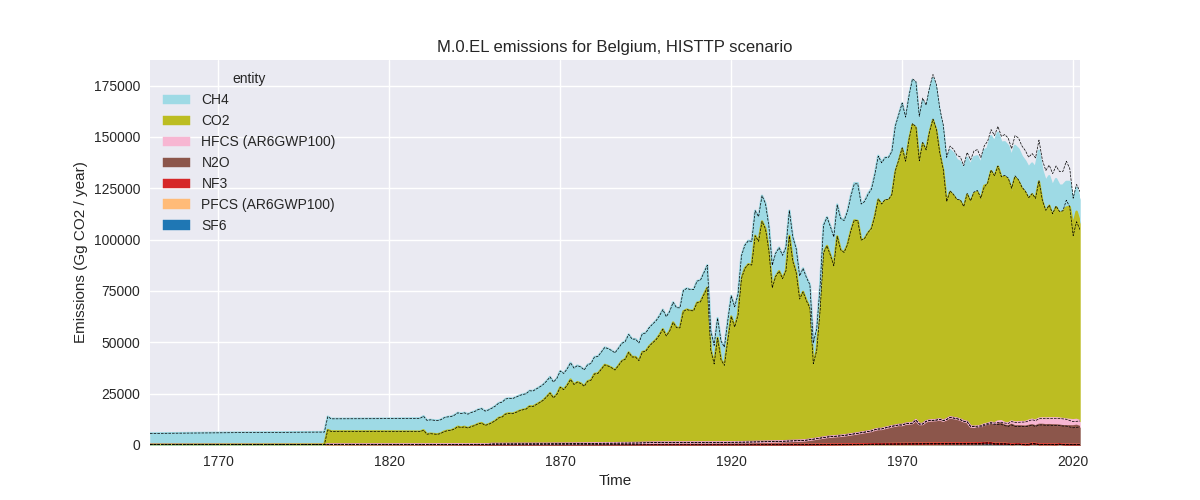
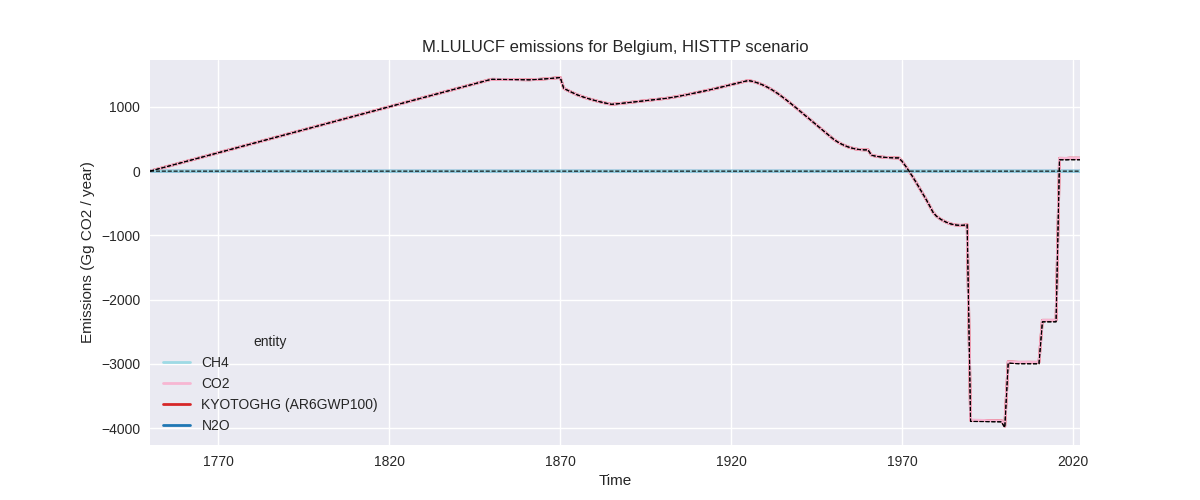
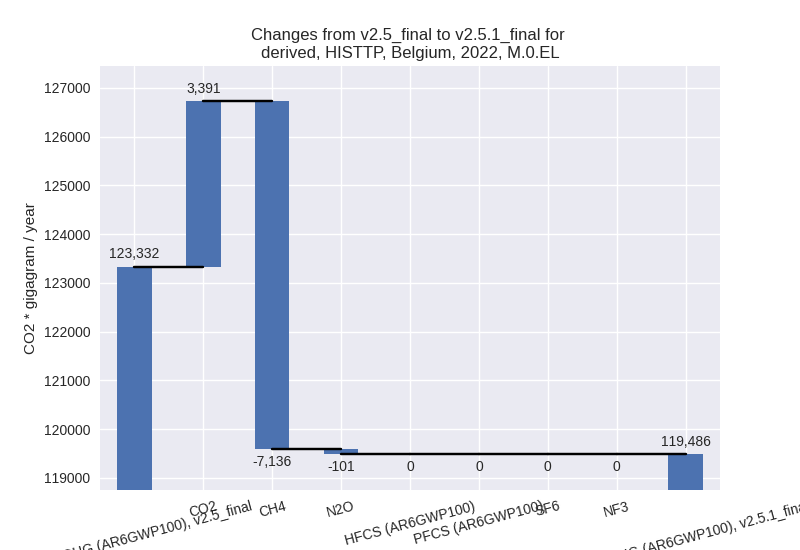
The following figures show the aggregate national total emissions excluding LULUCF AR6GWP100 for the third party priority scenario. The dotted linesshow the v2.5_final data.
Overview over changes
In the country reported priority scenario we have the following changes for aggregate Kyoto GHG and national total emissions excluding LULUCF (M.0.EL):
- Emissions in 2022 have changed by -0.0%% (-37.64 Gg CO2 / year)
- Emissions in 1990-2022 have changed by -0.0%% (-1.14 Gg CO2 / year)
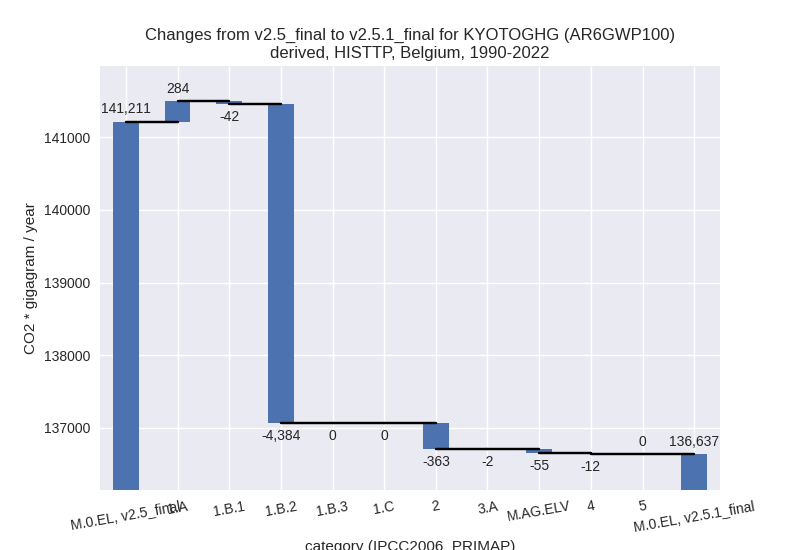
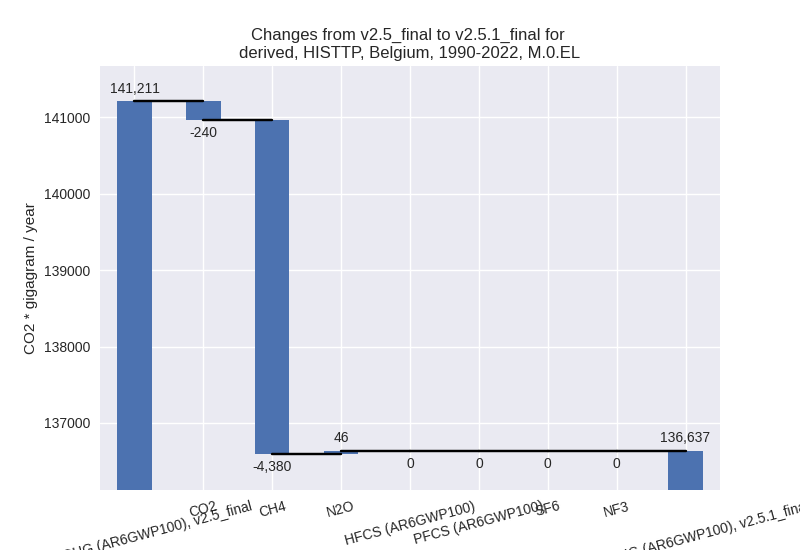
In the third party priority scenario we have the following changes for aggregate Kyoto GHG and national total emissions excluding LULUCF (M.0.EL):
- Emissions in 2022 have changed by -3.1%% (-3846.49 Gg CO2 / year)
- Emissions in 1990-2022 have changed by -3.2%% (-4573.84 Gg CO2 / year)
Most important changes per scenario and time frame
In the country reported priority scenario the following sector-gas combinations have the highest absolute impact on national total KyotoGHG (AR6GWP100) emissions in 2022 (top 5):
- 1: 2, CO2 with -272.28 Gg CO2 / year (-1.9%)
- 2: 2, N2O with 147.65 Gg CO2 / year (33.6%)
- 3: 4, CO2 with 142.25 Gg CO2 / year (120.6%)
- 4: 3.A, CH4 with -139.07 Gg CO2 / year (-2.4%)
- 5: 4, CH4 with 123.35 Gg CO2 / year (18.1%)
In the country reported priority scenario the following sector-gas combinations have the highest absolute impact on national total KyotoGHG (AR6GWP100) emissions in 1990-2022 (top 5):
- 1: 2, CO2 with -8.25 Gg CO2 / year (-0.0%)
- 2: 2, N2O with 4.47 Gg CO2 / year (0.2%)
- 3: 4, CO2 with 4.31 Gg CO2 / year (1.2%)
- 4: 3.A, CH4 with -4.21 Gg CO2 / year (-0.1%)
- 5: 4, CH4 with 3.74 Gg CO2 / year (0.1%)
In the third party priority scenario the following sector-gas combinations have the highest absolute impact on national total KyotoGHG (AR6GWP100) emissions in 2022 (top 5):
- 1: 1.B.2, CH4 with -6655.41 Gg CO2 / year (-89.9%)
- 2: 1.A, CO2 with 4164.32 Gg CO2 / year (4.9%)
- 3: 2, CO2 with -764.41 Gg CO2 / year (-9.0%)
- 4: 4, CH4 with -385.34 Gg CO2 / year (-10.0%)
- 5: M.AG.ELV, N2O with -142.45 Gg CO2 / year (-5.6%)
In the third party priority scenario the following sector-gas combinations have the highest absolute impact on national total KyotoGHG (AR6GWP100) emissions in 1990-2022 (top 5):
- 1: 1.B.2, CH4 with -4383.88 Gg CO2 / year (-74.9%)
- 2: 2, CO2 with -469.58 Gg CO2 / year (-5.5%)
- 3: 1.A, CO2 with 286.89 Gg CO2 / year (0.3%)
- 4: 2, N2O with 102.32 Gg CO2 / year (2.3%)
- 5: 1.B.1, CO2 with -56.67 Gg CO2 / year (-21.1%)
Notes on data changes
No country specific notes present for this changelog.
Changes by sector and gas
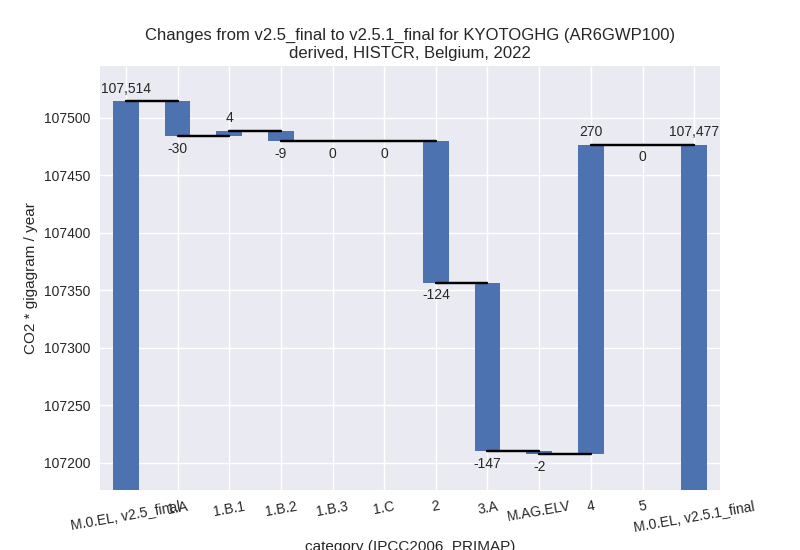
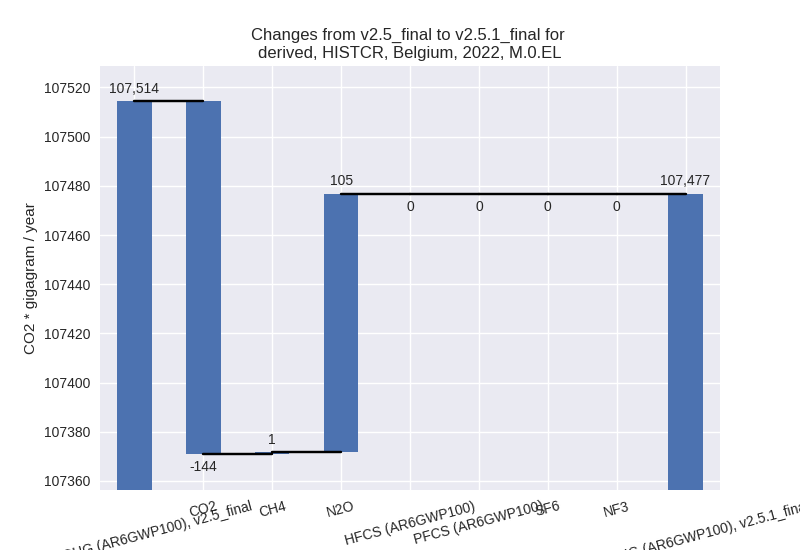
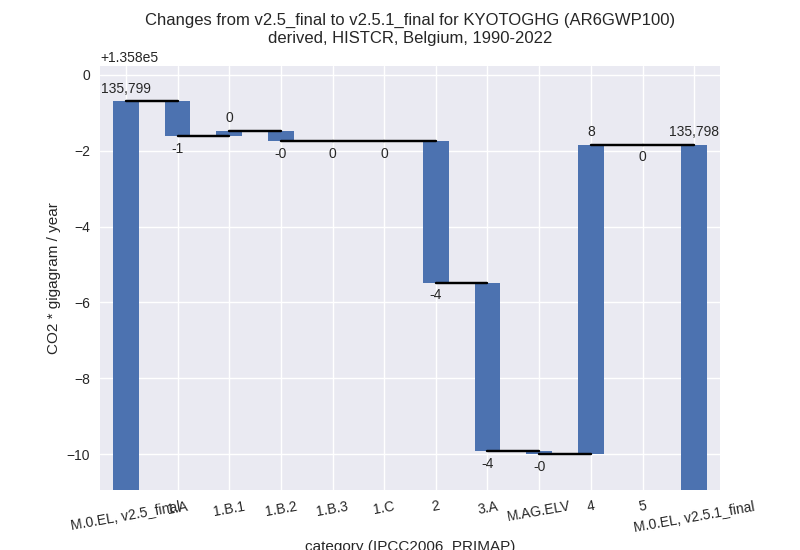
For each scenario and time frame the changes are displayed for all individual sectors and all individual gases. In the sector plot we use aggregate Kyoto GHGs in AR6GWP100. In the gas plot we usenational total emissions without LULUCF. ## country reported scenario
2022
1990-2022

third party scenario
2022

1990-2022
Detailed changes for the scenarios:
country reported scenario (HISTCR):
Most important changes per time frame
For 2022 the following sector-gas combinations have the highest absolute impact on national total KyotoGHG (AR6GWP100) emissions in 2022 (top 5):
- 1: 2, CO2 with -272.28 Gg CO2 / year (-1.9%)
- 2: 2, N2O with 147.65 Gg CO2 / year (33.6%)
- 3: 4, CO2 with 142.25 Gg CO2 / year (120.6%)
- 4: 3.A, CH4 with -139.07 Gg CO2 / year (-2.4%)
- 5: 4, CH4 with 123.35 Gg CO2 / year (18.1%)
For 1990-2022 the following sector-gas combinations have the highest absolute impact on national total KyotoGHG (AR6GWP100) emissions in 1990-2022 (top 5):
- 1: 2, CO2 with -8.25 Gg CO2 / year (-0.0%)
- 2: 2, N2O with 4.47 Gg CO2 / year (0.2%)
- 3: 4, CO2 with 4.31 Gg CO2 / year (1.2%)
- 4: 3.A, CH4 with -4.21 Gg CO2 / year (-0.1%)
- 5: 4, CH4 with 3.74 Gg CO2 / year (0.1%)
Changes in the main sectors for aggregate KyotoGHG (AR6GWP100) are
- 1: Total sectoral emissions in 2022 are 78330.93 Gg CO2 / year which is 72.9% of M.0.EL emissions. 2022 Emissions have changed by -0.0% (-34.19 Gg CO2 / year). 1990-2022 Emissions have changed by -0.0% (-1.04 Gg CO2 / year).
- 2: Total sectoral emissions in 2022 are 18529.37 Gg CO2 / year which is 17.2% of M.0.EL emissions. 2022 Emissions have changed by -0.7% (-123.54 Gg CO2 / year). 1990-2022 Emissions have changed by -0.0% (-3.74 Gg CO2 / year).
- M.AG: Total sectoral emissions in 2022 are 9421.01 Gg CO2 / year which is 8.8% of M.0.EL emissions. 2022 Emissions have changed by -1.6% (-149.42 Gg CO2 / year). 1990-2022 Emissions have changed by -0.0% (-4.53 Gg CO2 / year).
- 4: Total sectoral emissions in 2022 are 1195.43 Gg
CO2 / year which is 1.1% of M.0.EL emissions. 2022 Emissions have
changed by 29.1% (269.52 Gg CO2 /
year). 1990-2022 Emissions have changed by 0.3% (8.17 Gg CO2 / year). For 2022 the
changes per gas
are:
- 5: No data
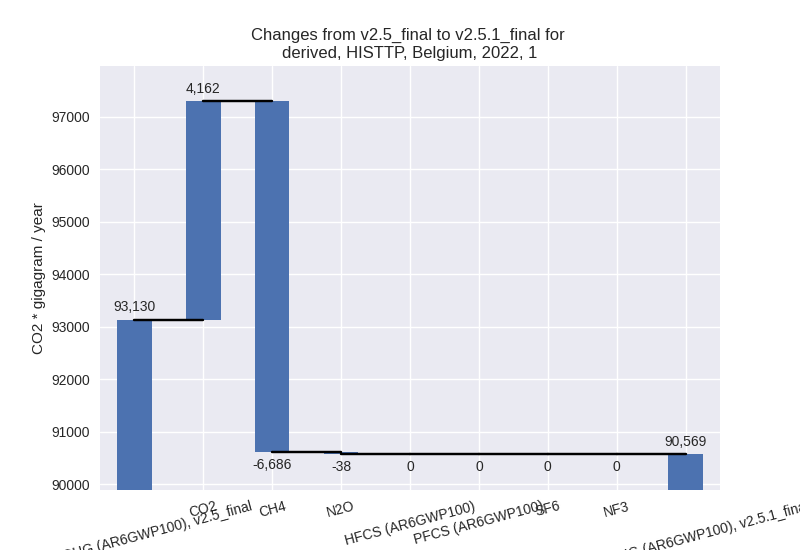
third party scenario (HISTTP):
Most important changes per time frame
For 2022 the following sector-gas combinations have the highest absolute impact on national total KyotoGHG (AR6GWP100) emissions in 2022 (top 5):
- 1: 1.B.2, CH4 with -6655.41 Gg CO2 / year (-89.9%)
- 2: 1.A, CO2 with 4164.32 Gg CO2 / year (4.9%)
- 3: 2, CO2 with -764.41 Gg CO2 / year (-9.0%)
- 4: 4, CH4 with -385.34 Gg CO2 / year (-10.0%)
- 5: M.AG.ELV, N2O with -142.45 Gg CO2 / year (-5.6%)
For 1990-2022 the following sector-gas combinations have the highest absolute impact on national total KyotoGHG (AR6GWP100) emissions in 1990-2022 (top 5):
- 1: 1.B.2, CH4 with -4383.88 Gg CO2 / year (-74.9%)
- 2: 2, CO2 with -469.58 Gg CO2 / year (-5.5%)
- 3: 1.A, CO2 with 286.89 Gg CO2 / year (0.3%)
- 4: 2, N2O with 102.32 Gg CO2 / year (2.3%)
- 5: 1.B.1, CO2 with -56.67 Gg CO2 / year (-21.1%)
Changes in the main sectors for aggregate KyotoGHG (AR6GWP100) are
- 1: Total sectoral emissions in 2022 are 90568.62 Gg
CO2 / year which is 75.8% of M.0.EL emissions. 2022 Emissions have
changed by -2.8% (-2561.69 Gg CO2 /
year). 1990-2022 Emissions have changed by -3.8% (-4142.22 Gg CO2 / year). For 2022
the changes per gas
are:
For 1990-2022 the changes per gas are:
The changes come from the following subsectors:- 1.A: Total sectoral emissions in 2022 are 89649.27
Gg CO2 / year which is 99.0% of category 1 emissions. 2022 Emissions
have changed by 4.8% (4090.47 Gg CO2
/ year). 1990-2022 Emissions have changed by 0.3% (284.10 Gg CO2 / year). For 2022 the
changes per gas
are:

There is no subsector information available in PRIMAP-hist. - 1.B.1: Total sectoral emissions in 2022 are 172.79
Gg CO2 / year which is 0.2% of category 1 emissions. 2022 Emissions have
changed by 1.9% (3.26 Gg CO2 /
year). 1990-2022 Emissions have changed by -8.9% (-42.44 Gg CO2 / year). For
1990-2022 the changes per gas
are:

There is no subsector information available in PRIMAP-hist. - 1.B.2: Total sectoral emissions in 2022 are 746.56
Gg CO2 / year which is 0.8% of category 1 emissions. 2022 Emissions have
changed by -89.9% (-6655.42 Gg CO2 /
year). 1990-2022 Emissions have changed by -74.9% (-4383.88 Gg CO2 / year). For 2022
the changes per gas
are:
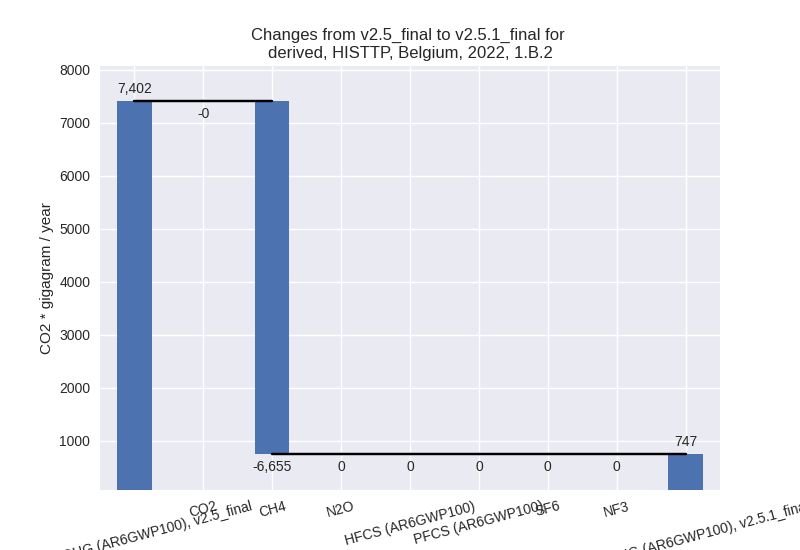
For 1990-2022 the changes per gas are:
There is no subsector information available in PRIMAP-hist.
- 1.A: Total sectoral emissions in 2022 are 89649.27
Gg CO2 / year which is 99.0% of category 1 emissions. 2022 Emissions
have changed by 4.8% (4090.47 Gg CO2
/ year). 1990-2022 Emissions have changed by 0.3% (284.10 Gg CO2 / year). For 2022 the
changes per gas
are:
- 2: Total sectoral emissions in 2022 are 15409.73 Gg
CO2 / year which is 12.9% of M.0.EL emissions. 2022 Emissions have
changed by -4.2% (-673.78 Gg CO2 /
year). 1990-2022 Emissions have changed by -2.3% (-362.60 Gg CO2 / year). For 2022
the changes per gas
are:

For 1990-2022 the changes per gas are:
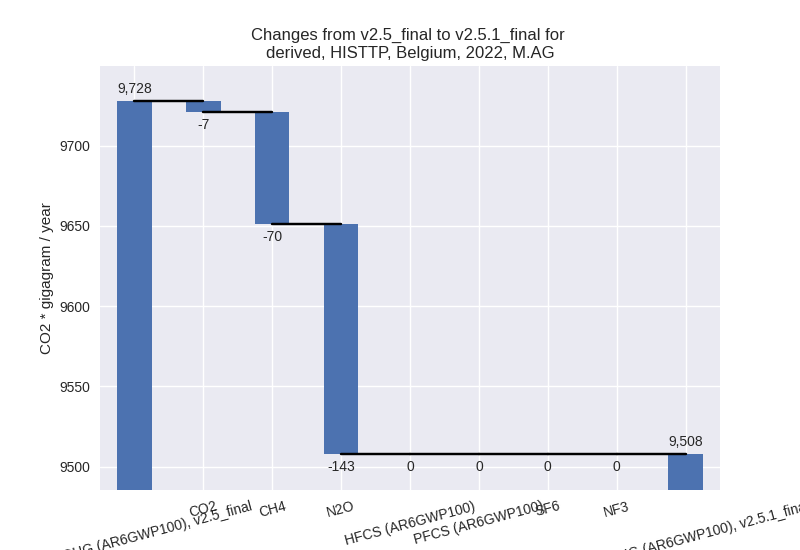
- M.AG: Total sectoral emissions in 2022 are 9507.72
Gg CO2 / year which is 8.0% of M.0.EL emissions. 2022 Emissions have
changed by -2.3% (-219.85 Gg CO2 /
year). 1990-2022 Emissions have changed by -0.5% (-57.16 Gg CO2 / year). For 2022 the
changes per gas
are:
The changes come from the following subsectors:- 3.A: Total sectoral emissions in 2022 are 7084.50 Gg CO2 / year which is 74.5% of category M.AG emissions. 2022 Emissions have changed by -1.0% (-71.75 Gg CO2 / year). 1990-2022 Emissions have changed by -0.0% (-2.49 Gg CO2 / year).
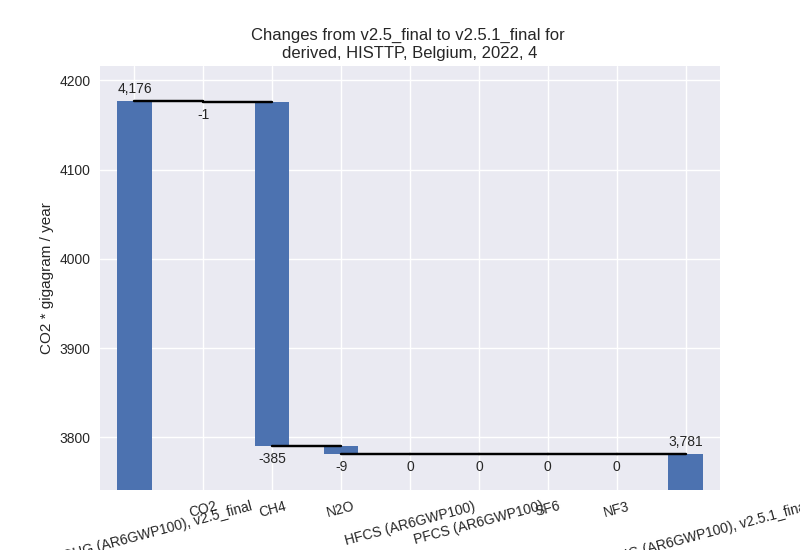
- M.AG.ELV: Total sectoral emissions in 2022 are
2423.23 Gg CO2 / year which is 25.5% of category M.AG emissions. 2022
Emissions have changed by -5.8%
(-148.10 Gg CO2 / year). 1990-2022 Emissions have changed by -2.1% (-54.67 Gg CO2 / year). For 2022 the
changes per gas
are:
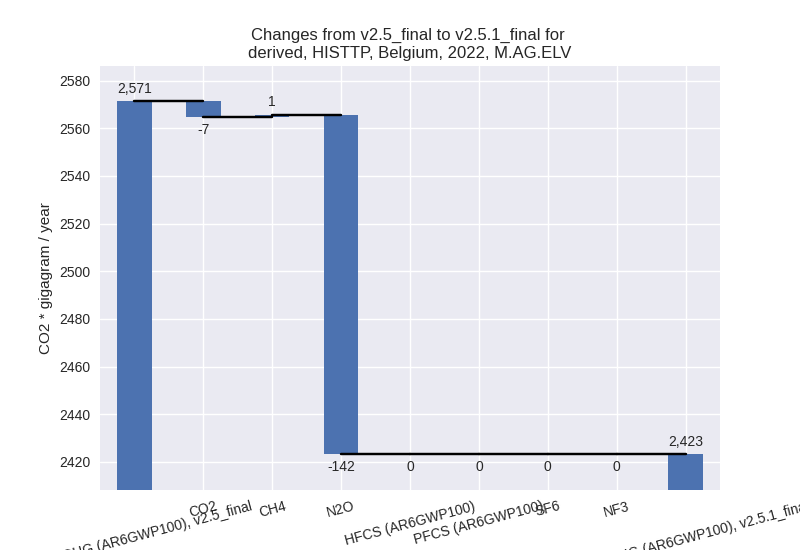
For 1990-2022 the changes per gas are: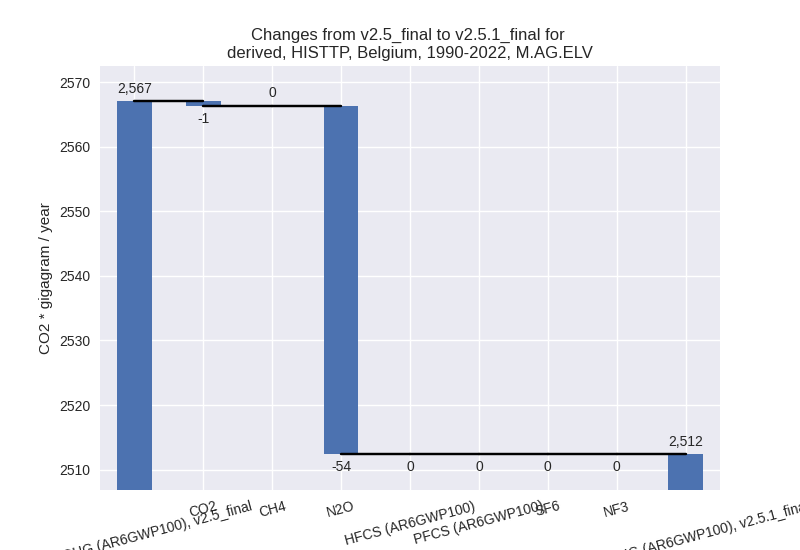
There is no subsector information available in PRIMAP-hist.
- 4: Total sectoral emissions in 2022 are 3781.03 Gg
CO2 / year which is 3.2% of M.0.EL emissions. 2022 Emissions have
changed by -9.5% (-395.40 Gg CO2 /
year). 1990-2022 Emissions have changed by -0.2% (-11.98 Gg CO2 / year). For 2022 the
changes per gas
are:
- 5: Total sectoral emissions in 2022 are 218.46 Gg CO2 / year which is 0.2% of M.0.EL emissions. 2022 Emissions have changed by 2.0% (4.22 Gg CO2 / year). 1990-2022 Emissions have changed by 0.0% (0.13 Gg CO2 / year).