Changes in PRIMAP-hist v2.5.1_final compared to v2.5_final for Burkina Faso
2024-02-29
Johannes Gütschow
Change analysis for Burkina Faso for PRIMAP-hist v2.5.1_final compared to v2.5_final
Overview over emissions by sector and gas
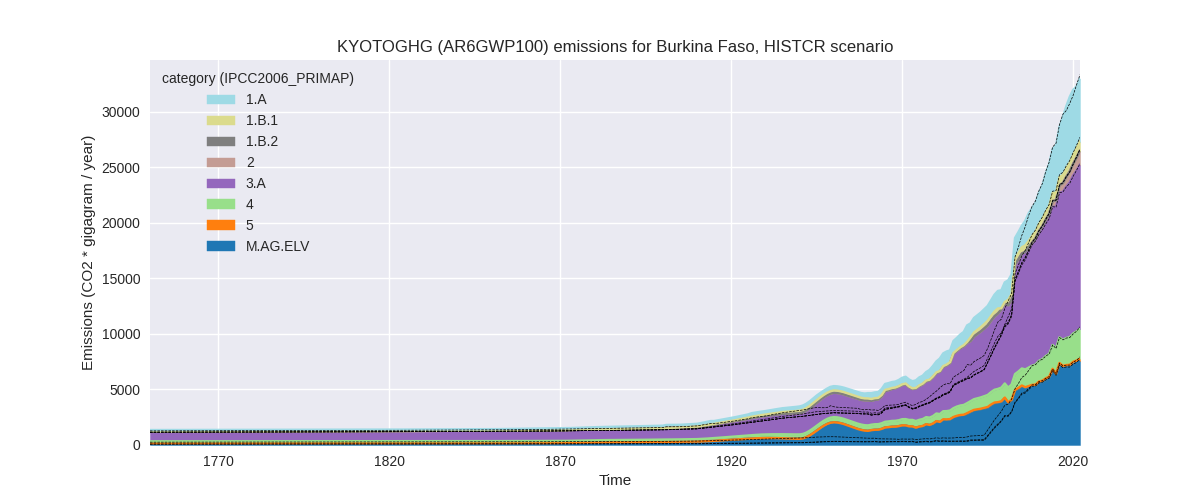
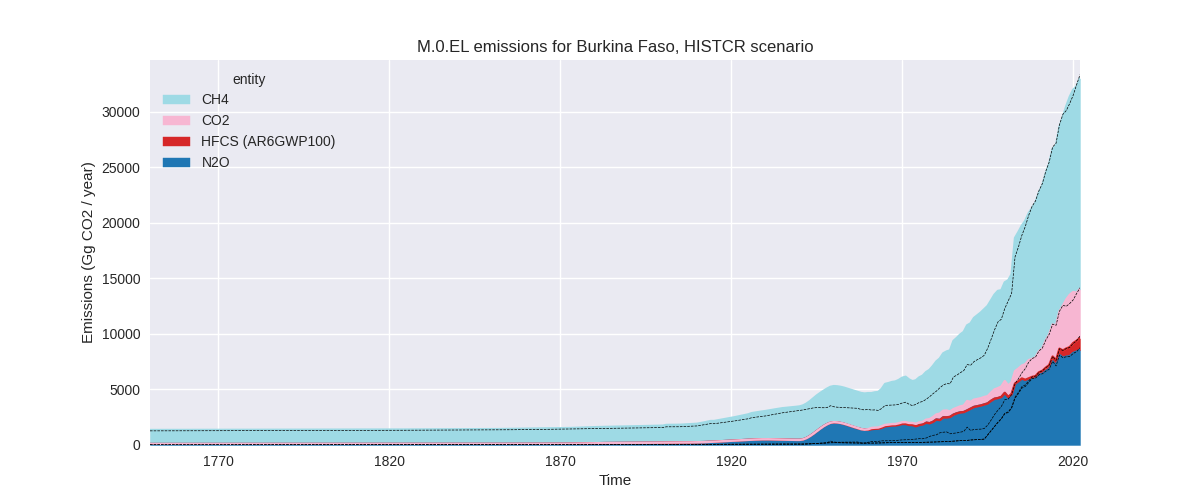
The following figures show the aggregate national total emissions excluding LULUCF AR6GWP100 for the country reported priority scenario. The dotted linesshow the v2.5_final data.
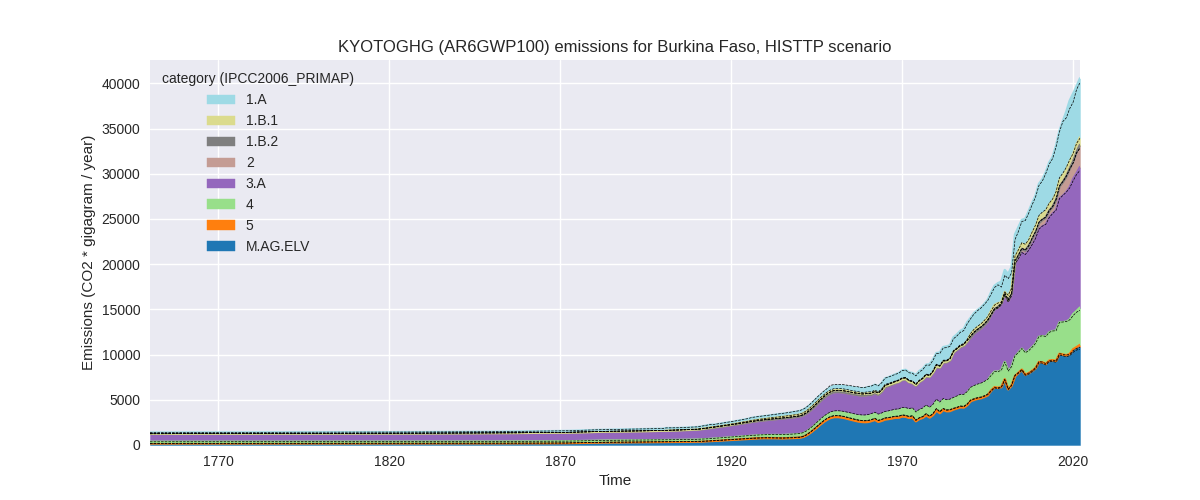
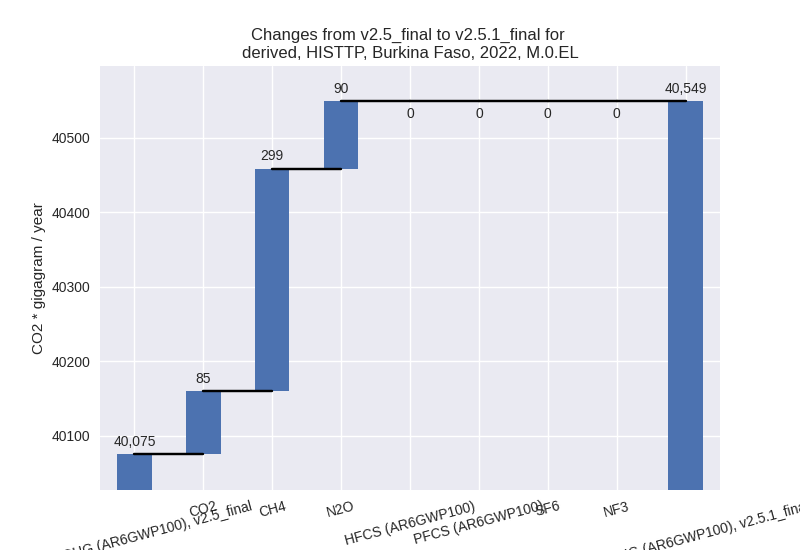
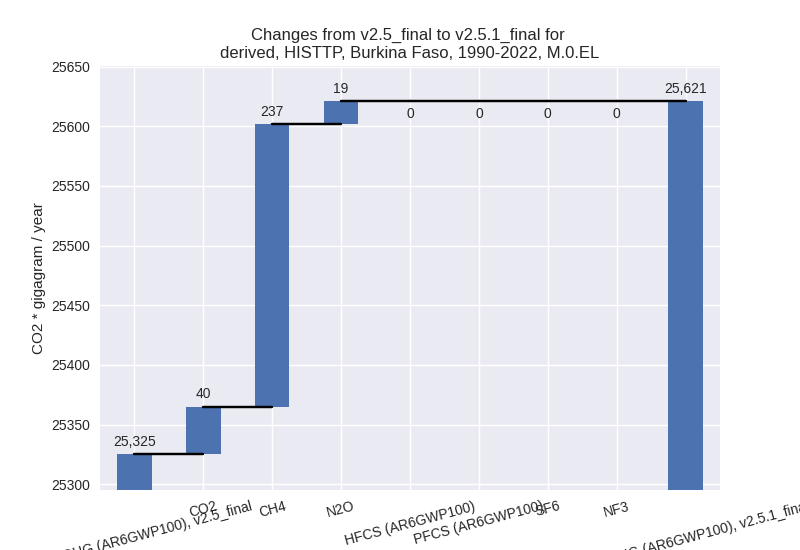
The following figures show the aggregate national total emissions excluding LULUCF AR6GWP100 for the third party priority scenario. The dotted linesshow the v2.5_final data.


Overview over changes
In the country reported priority scenario we have the following changes for aggregate Kyoto GHG and national total emissions excluding LULUCF (M.0.EL):
- Emissions in 2022 have changed by -1.0%% (-326.11 Gg CO2 / year)
- Emissions in 1990-2022 have changed by 7.2%% (1379.76 Gg CO2 / year)
In the third party priority scenario we have the following changes for aggregate Kyoto GHG and national total emissions excluding LULUCF (M.0.EL):
- Emissions in 2022 have changed by 1.2%% (473.97 Gg CO2 / year)
- Emissions in 1990-2022 have changed by 1.2%% (295.78 Gg CO2 / year)
Most important changes per scenario and time frame
In the country reported priority scenario the following sector-gas combinations have the highest absolute impact on national total KyotoGHG (AR6GWP100) emissions in 2022 (top 5):
- 1: 1.B.1, CH4 with -245.76 Gg CO2 / year (-23.0%)
- 2: M.AG.ELV, N2O with -169.28 Gg CO2 / year (-2.2%)
- 3: 1.A, CO2 with 109.71 Gg CO2 / year (2.7%)
- 4: 3.A, CH4 with 70.35 Gg CO2 / year (0.5%)
- 5: 1.A, CH4 with -54.16 Gg CO2 / year (-4.4%)
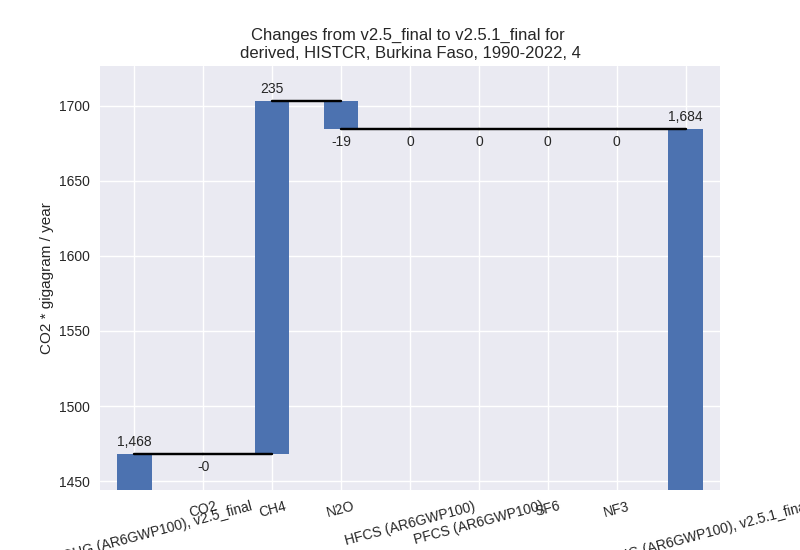
In the country reported priority scenario the following sector-gas combinations have the highest absolute impact on national total KyotoGHG (AR6GWP100) emissions in 1990-2022 (top 5):
- 1: M.AG.ELV, N2O with 1038.36 Gg CO2 / year (25.7%)
- 2: 4, CH4 with 234.92 Gg CO2 / year (17.7%)
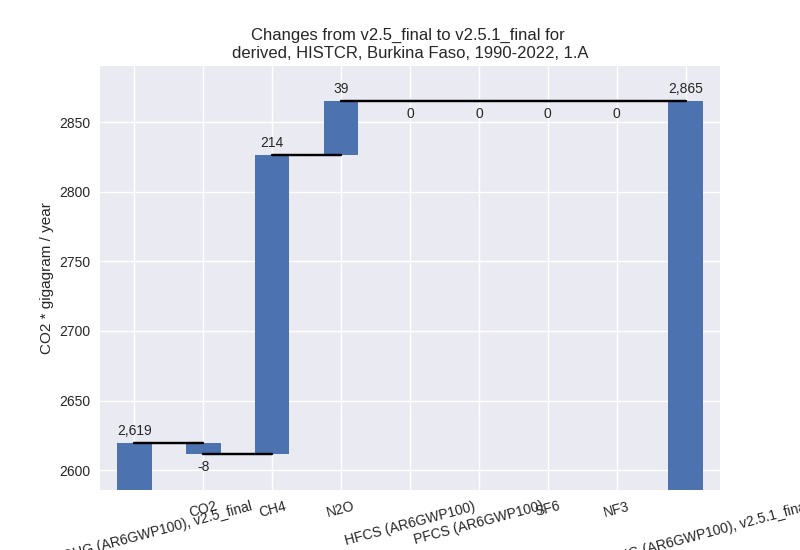
- 3: 1.A, CH4 with 214.49 Gg CO2 / year (36.3%)
- 4: M.AG.ELV, CH4 with -80.19 Gg CO2 / year (-74.2%)
- 5: 1.B.1, CH4 with -76.81 Gg CO2 / year (-12.3%)
In the third party priority scenario the following sector-gas combinations have the highest absolute impact on national total KyotoGHG (AR6GWP100) emissions in 2022 (top 5):
- 1: 1.A, CH4 with 256.14 Gg CO2 / year (14.1%)
- 2: 1.B.1, CH4 with -245.76 Gg CO2 / year (-23.0%)
- 3: M.AG.ELV, CH4 with 217.87 Gg CO2 / year (11.3%)
- 4: 1.A, CO2 with 107.69 Gg CO2 / year (2.7%)
- 5: M.AG.ELV, N2O with 73.62 Gg CO2 / year (0.8%)
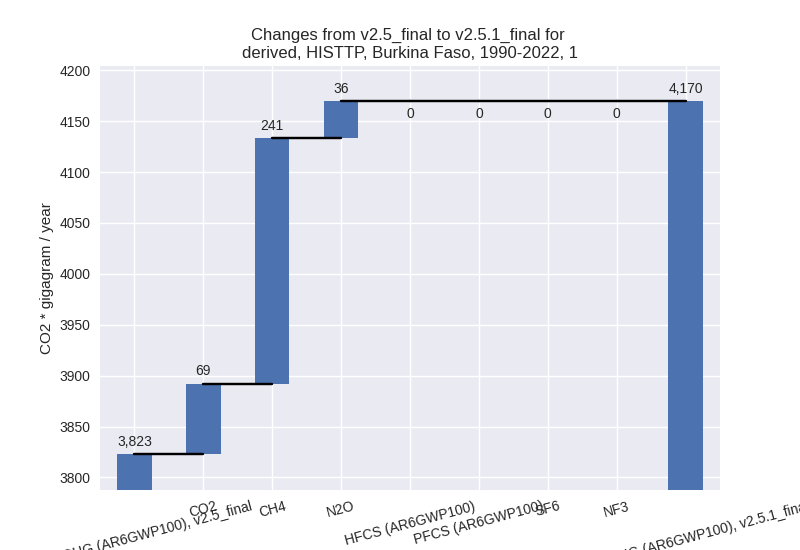
In the third party priority scenario the following sector-gas combinations have the highest absolute impact on national total KyotoGHG (AR6GWP100) emissions in 1990-2022 (top 5):
- 1: 1.A, CH4 with 318.23 Gg CO2 / year (26.5%)
- 2: 1.B.1, CH4 with -76.81 Gg CO2 / year (-12.3%)
- 3: 1.A, CO2 with 69.18 Gg CO2 / year (3.8%)
- 4: 1.A, N2O with 37.31 Gg CO2 / year (21.3%)
- 5: 2, CO2 with -27.92 Gg CO2 / year (-8.3%)
Notes on data changes
Here we list notes explaining important emissions changes for the country. ’' means that the following text only applies to the TP time series, while means that it only applies to the CR scenario. Otherwise the note applies to both scenarios.
- M.AG.ELV, N2O: We have removed a very low data point from the country reported data. This leads to higher emissions before 2008.
- 1.B.1, CH4: EDGAR 8.0 emissions are lower after 2001.
- 4, CH4: We have removed a very low data point from the country reported data. This leads to higher emissions before 2008.
- 1.A, CH4: We have removed a very low data point from the country reported data. This leads to higher emissions before 2008. EDGAR 8.0 emissions are higher for all years.
Changes by sector and gas
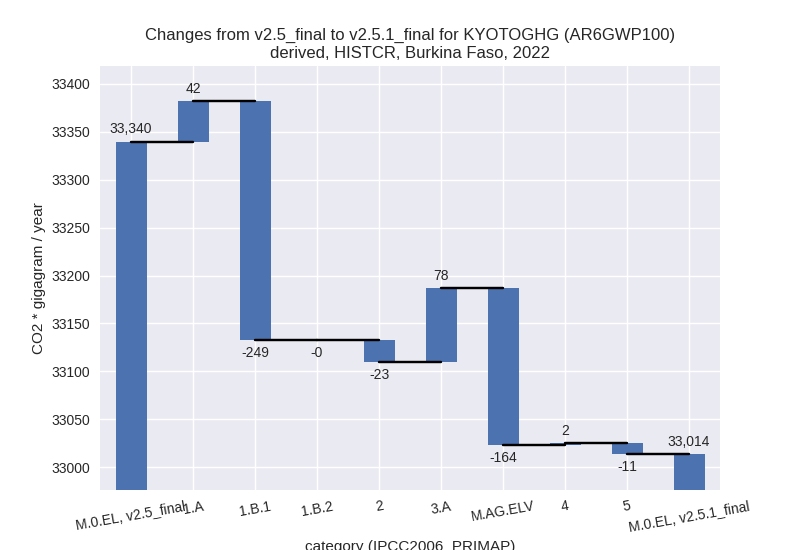
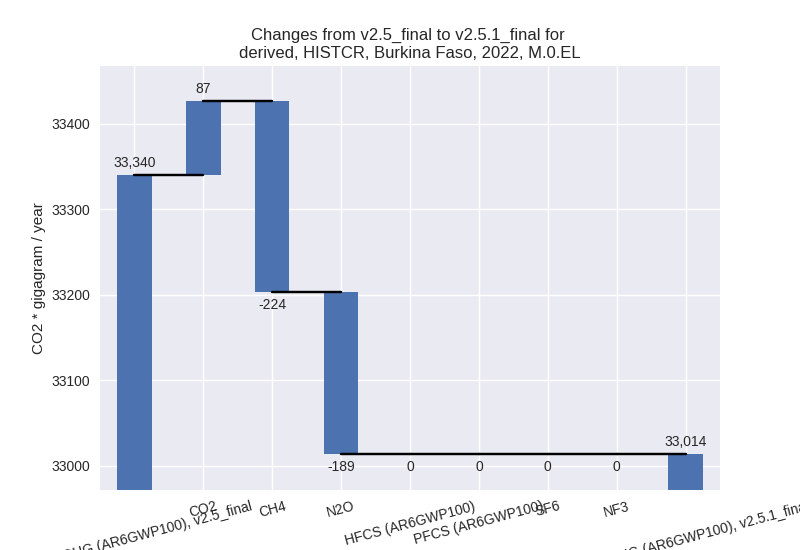
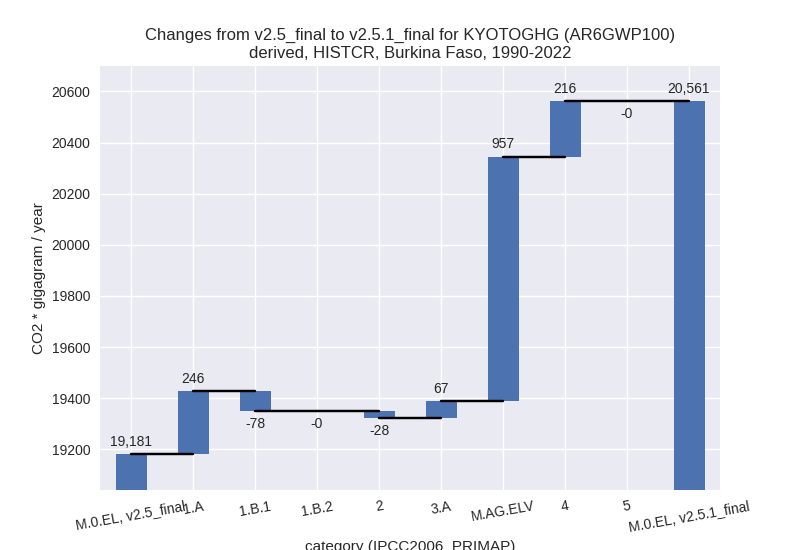
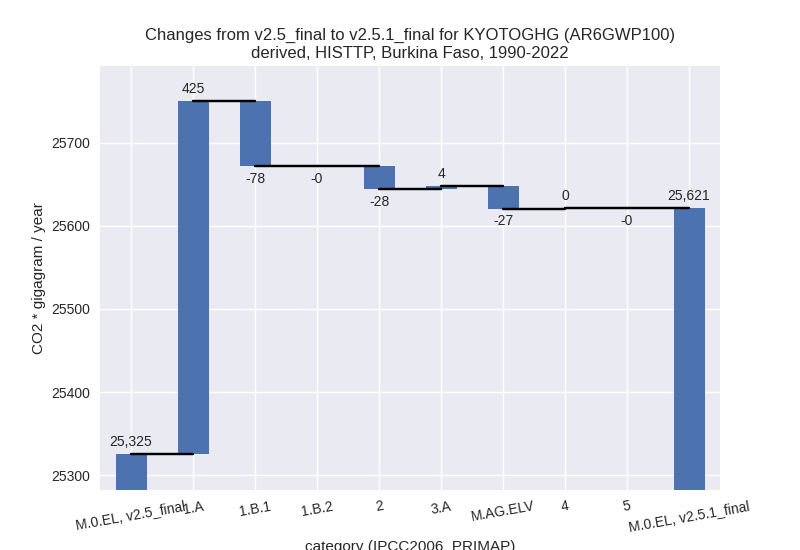
For each scenario and time frame the changes are displayed for all individual sectors and all individual gases. In the sector plot we use aggregate Kyoto GHGs in AR6GWP100. In the gas plot we usenational total emissions without LULUCF. ## country reported scenario
2022
1990-2022

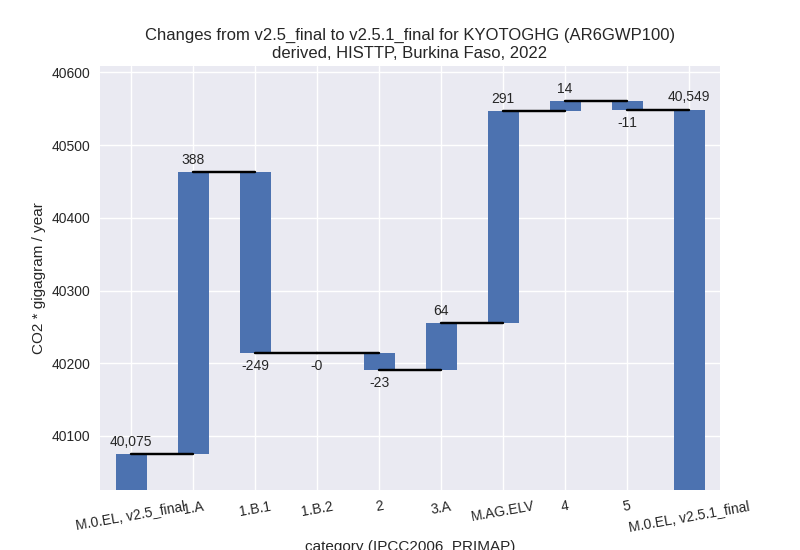
third party scenario
2022
1990-2022
Detailed changes for the scenarios:
country reported scenario (HISTCR):
Most important changes per time frame
For 2022 the following sector-gas combinations have the highest absolute impact on national total KyotoGHG (AR6GWP100) emissions in 2022 (top 5):
- 1: 1.B.1, CH4 with -245.76 Gg CO2 / year (-23.0%)
- 2: M.AG.ELV, N2O with -169.28 Gg CO2 / year (-2.2%)
- 3: 1.A, CO2 with 109.71 Gg CO2 / year (2.7%)
- 4: 3.A, CH4 with 70.35 Gg CO2 / year (0.5%)
- 5: 1.A, CH4 with -54.16 Gg CO2 / year (-4.4%)
For 1990-2022 the following sector-gas combinations have the highest absolute impact on national total KyotoGHG (AR6GWP100) emissions in 1990-2022 (top 5):
- 1: M.AG.ELV, N2O with 1038.36 Gg CO2 / year (25.7%)
- 2: 4, CH4 with 234.92 Gg CO2 / year (17.7%)
- 3: 1.A, CH4 with 214.49 Gg CO2 / year (36.3%)
- 4: M.AG.ELV, CH4 with -80.19 Gg CO2 / year (-74.2%)
- 5: 1.B.1, CH4 with -76.81 Gg CO2 / year (-12.3%)
Changes in the main sectors for aggregate KyotoGHG (AR6GWP100) are
- 1: Total sectoral emissions in 2022 are 6503.24 Gg
CO2 / year which is 19.7% of M.0.EL emissions. 2022 Emissions have
changed by -3.1% (-207.34 Gg CO2 /
year). 1990-2022 Emissions have changed by 5.2% (167.60 Gg CO2 / year). For 2022 the
changes per gas
are:

For 1990-2022 the changes per gas are: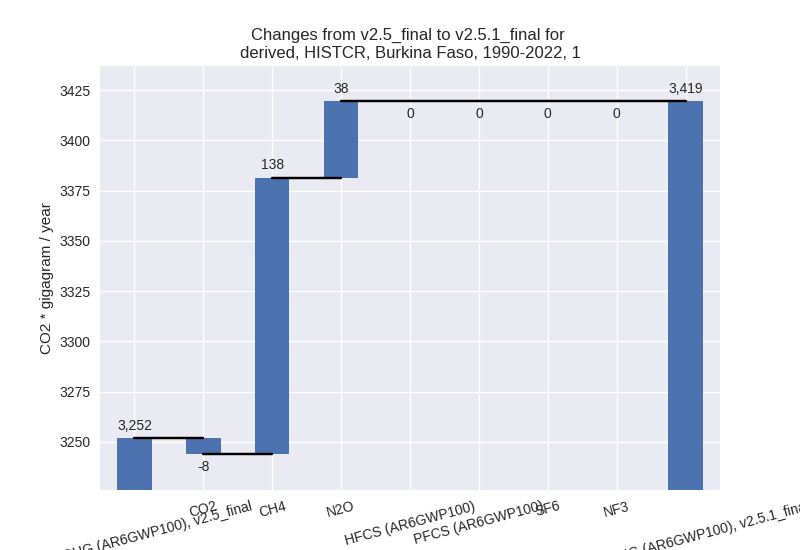
The changes come from the following subsectors:- 1.A: Total sectoral emissions in 2022 are 5668.29
Gg CO2 / year which is 87.2% of category 1 emissions. 2022 Emissions
have changed by 0.7% (42.10 Gg CO2 /
year). 1990-2022 Emissions have changed by 9.4% (245.52 Gg CO2 / year). For 1990-2022
the changes per gas
are:
There is no subsector information available in PRIMAP-hist. - 1.B.1: Total sectoral emissions in 2022 are 834.94
Gg CO2 / year which is 12.8% of category 1 emissions. 2022 Emissions
have changed by -23.0% (-249.02 Gg
CO2 / year). 1990-2022 Emissions have changed by -12.3% (-77.83 Gg CO2 / year). For 2022
the changes per gas
are:

For 1990-2022 the changes per gas are:
There is no subsector information available in PRIMAP-hist. - 1.B.2: Total sectoral emissions in 2022 are 0.00 Gg
CO2 / year which is 0.0% of category 1 emissions. 2022 Emissions have
changed by -99.6% (-0.42 Gg CO2 /
year). 1990-2022 Emissions have changed by -97.3% (-0.09 Gg CO2 / year). For 2022 the
changes per gas
are:

For 1990-2022 the changes per gas are: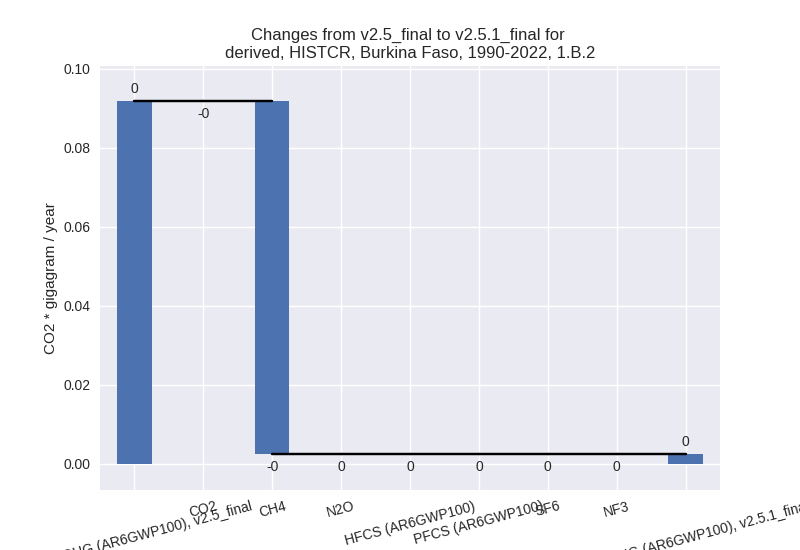
There is no subsector information available in PRIMAP-hist.
- 1.A: Total sectoral emissions in 2022 are 5668.29
Gg CO2 / year which is 87.2% of category 1 emissions. 2022 Emissions
have changed by 0.7% (42.10 Gg CO2 /
year). 1990-2022 Emissions have changed by 9.4% (245.52 Gg CO2 / year). For 1990-2022
the changes per gas
are:
- 2: Total sectoral emissions in 2022 are 1259.28 Gg
CO2 / year which is 3.8% of M.0.EL emissions. 2022 Emissions have
changed by -1.8% (-22.95 Gg CO2 /
year). 1990-2022 Emissions have changed by -7.4% (-27.92 Gg CO2 / year). For
1990-2022 the changes per gas
are:

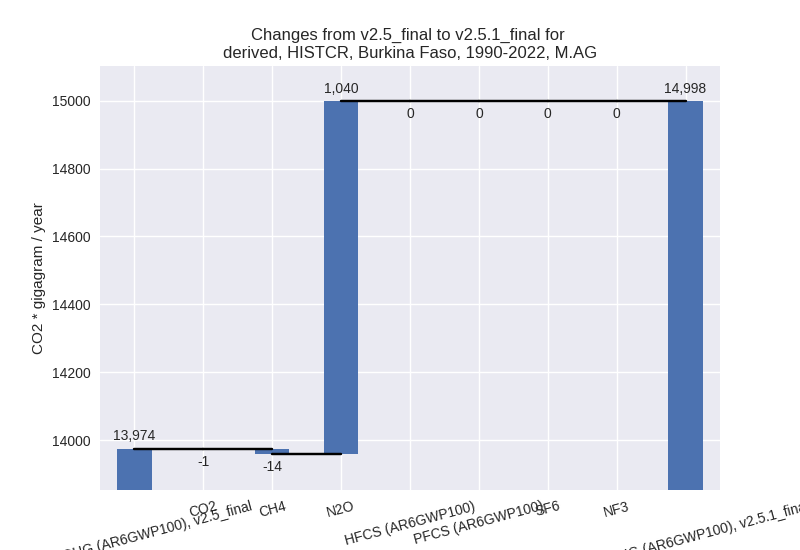
- M.AG: Total sectoral emissions in 2022 are 22367.71
Gg CO2 / year which is 67.8% of M.0.EL emissions. 2022 Emissions have
changed by -0.4% (-85.98 Gg CO2 /
year). 1990-2022 Emissions have changed by 7.3% (1024.15 Gg CO2 / year). For
1990-2022 the changes per gas
are:
The changes come from the following subsectors:- 3.A: Total sectoral emissions in 2022 are 14786.99 Gg CO2 / year which is 66.1% of category M.AG emissions. 2022 Emissions have changed by 0.5% (77.55 Gg CO2 / year). 1990-2022 Emissions have changed by 0.7% (67.39 Gg CO2 / year).
- M.AG.ELV: Total sectoral emissions in 2022 are
7580.72 Gg CO2 / year which is 33.9% of category M.AG emissions. 2022
Emissions have changed by -2.1%
(-163.53 Gg CO2 / year). 1990-2022 Emissions have changed by 23.0% (956.76 Gg CO2 / year). For 2022 the
changes per gas
are:

For 1990-2022 the changes per gas are: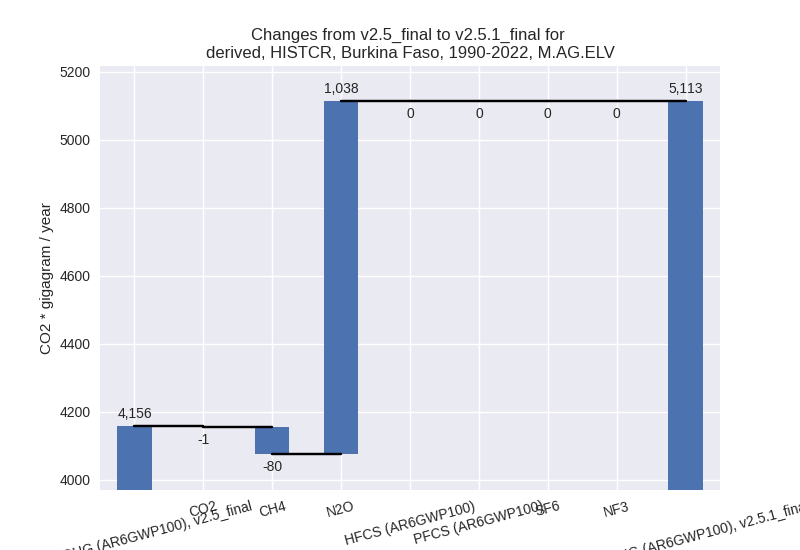
There is no subsector information available in PRIMAP-hist.
- 4: Total sectoral emissions in 2022 are 2704.45 Gg
CO2 / year which is 8.2% of M.0.EL emissions. 2022 Emissions have
changed by 0.1% (1.55 Gg CO2 /
year). 1990-2022 Emissions have changed by 14.7% (216.27 Gg CO2 / year). For
1990-2022 the changes per gas
are:
- 5: Total sectoral emissions in 2022 are 178.93 Gg
CO2 / year which is 0.5% of M.0.EL emissions. 2022 Emissions have
changed by -6.0% (-11.39 Gg CO2 /
year). 1990-2022 Emissions have changed by -0.3% (-0.35 Gg CO2 / year). For 2022 the
changes per gas
are:

third party scenario (HISTTP):
Most important changes per time frame
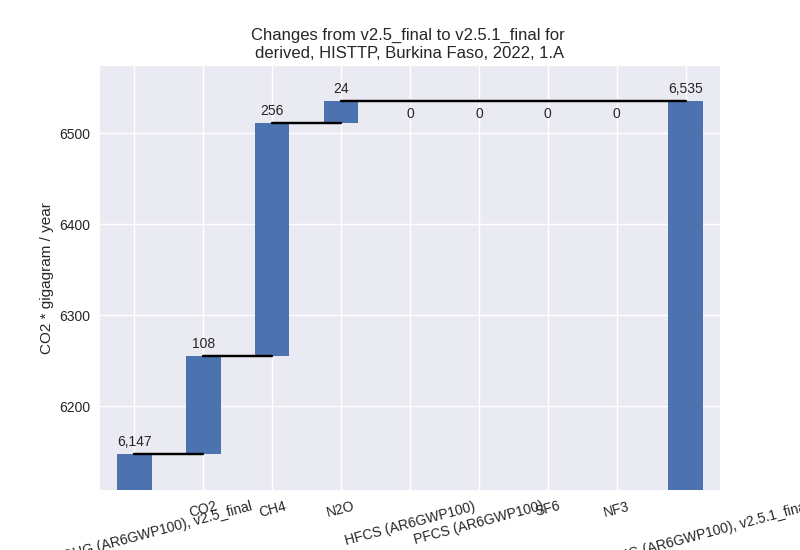
For 2022 the following sector-gas combinations have the highest absolute impact on national total KyotoGHG (AR6GWP100) emissions in 2022 (top 5):
- 1: 1.A, CH4 with 256.14 Gg CO2 / year (14.1%)
- 2: 1.B.1, CH4 with -245.76 Gg CO2 / year (-23.0%)
- 3: M.AG.ELV, CH4 with 217.87 Gg CO2 / year (11.3%)
- 4: 1.A, CO2 with 107.69 Gg CO2 / year (2.7%)
- 5: M.AG.ELV, N2O with 73.62 Gg CO2 / year (0.8%)
For 1990-2022 the following sector-gas combinations have the highest absolute impact on national total KyotoGHG (AR6GWP100) emissions in 1990-2022 (top 5):
- 1: 1.A, CH4 with 318.23 Gg CO2 / year (26.5%)
- 2: 1.B.1, CH4 with -76.81 Gg CO2 / year (-12.3%)
- 3: 1.A, CO2 with 69.18 Gg CO2 / year (3.8%)
- 4: 1.A, N2O with 37.31 Gg CO2 / year (21.3%)
- 5: 2, CO2 with -27.92 Gg CO2 / year (-8.3%)
Changes in the main sectors for aggregate KyotoGHG (AR6GWP100) are
- 1: Total sectoral emissions in 2022 are 7370.04 Gg
CO2 / year which is 18.2% of M.0.EL emissions. 2022 Emissions have
changed by 1.9% (138.59 Gg CO2 /
year). 1990-2022 Emissions have changed by 9.1% (346.80 Gg CO2 / year). For 1990-2022
the changes per gas
are:
The changes come from the following subsectors:- 1.A: Total sectoral emissions in 2022 are 6535.09
Gg CO2 / year which is 88.7% of category 1 emissions. 2022 Emissions
have changed by 6.3% (388.03 Gg CO2
/ year). 1990-2022 Emissions have changed by 13.3% (424.72 Gg CO2 / year). For 2022 the
changes per gas
are:
For 1990-2022 the changes per gas are:
There is no subsector information available in PRIMAP-hist. - 1.B.1: Total sectoral emissions in 2022 are 834.94
Gg CO2 / year which is 11.3% of category 1 emissions. 2022 Emissions
have changed by -23.0% (-249.02 Gg
CO2 / year). 1990-2022 Emissions have changed by -12.3% (-77.83 Gg CO2 / year). For 2022
the changes per gas
are:

For 1990-2022 the changes per gas are: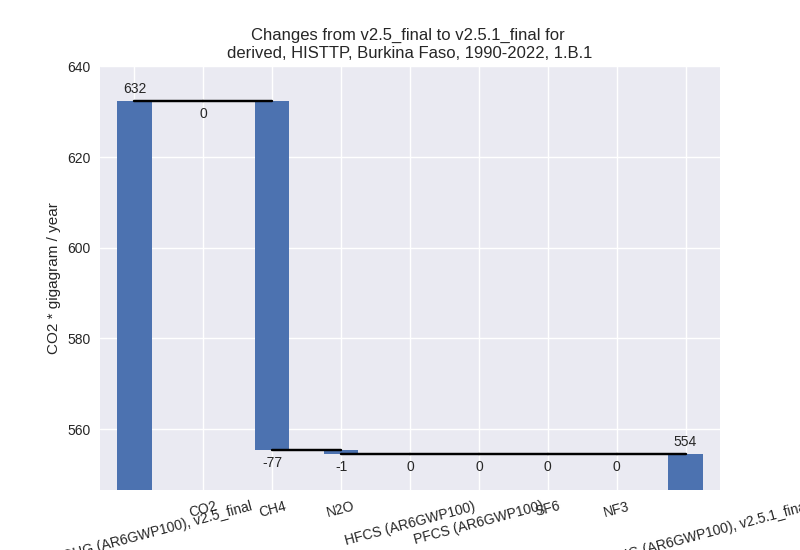
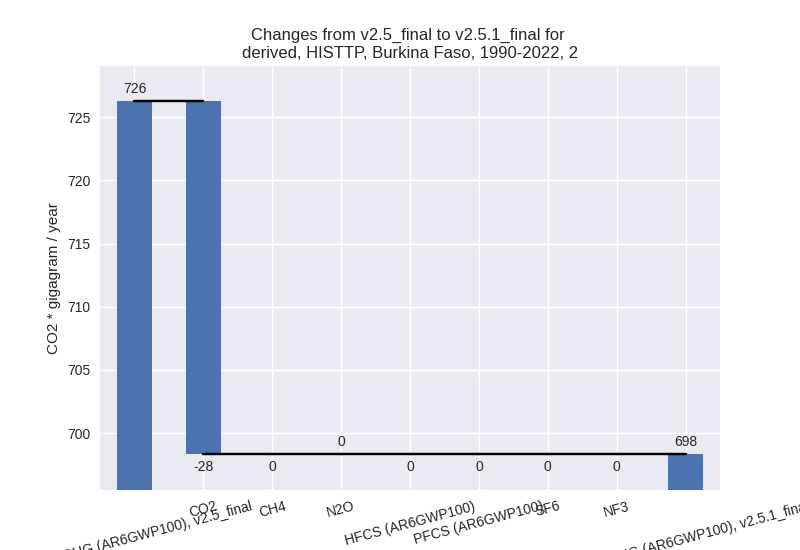
There is no subsector information available in PRIMAP-hist. - 1.B.2: Total sectoral emissions in 2022 are 0.00 Gg
CO2 / year which is 0.0% of category 1 emissions. 2022 Emissions have
changed by -99.6% (-0.42 Gg CO2 /
year). 1990-2022 Emissions have changed by -97.3% (-0.09 Gg CO2 / year). For 2022 the
changes per gas
are:
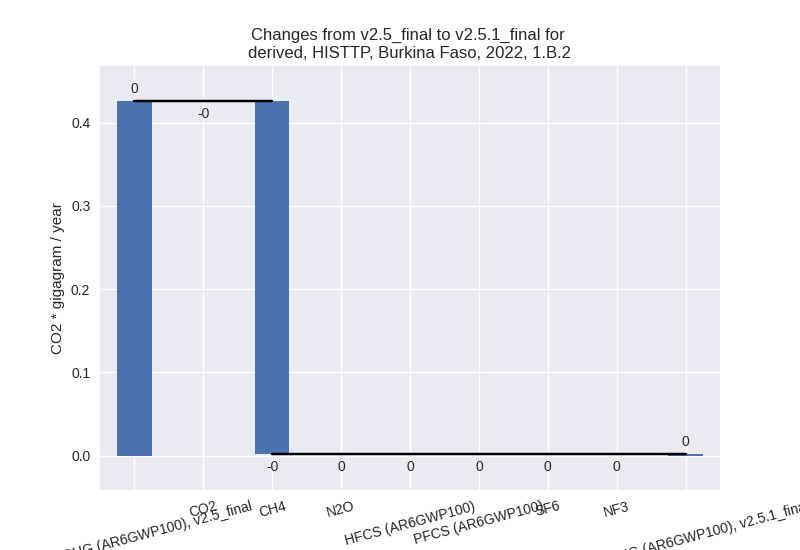
For 1990-2022 the changes per gas are:
There is no subsector information available in PRIMAP-hist.
- 1.A: Total sectoral emissions in 2022 are 6535.09
Gg CO2 / year which is 88.7% of category 1 emissions. 2022 Emissions
have changed by 6.3% (388.03 Gg CO2
/ year). 1990-2022 Emissions have changed by 13.3% (424.72 Gg CO2 / year). For 2022 the
changes per gas
are:
- 2: Total sectoral emissions in 2022 are 2444.70 Gg
CO2 / year which is 6.0% of M.0.EL emissions. 2022 Emissions have
changed by -0.9% (-22.95 Gg CO2 /
year). 1990-2022 Emissions have changed by -3.8% (-27.92 Gg CO2 / year). For
1990-2022 the changes per gas
are:
- M.AG: Total sectoral emissions in 2022 are 26427.74 Gg CO2 / year which is 65.2% of M.0.EL emissions. 2022 Emissions have changed by 1.4% (355.77 Gg CO2 / year). 1990-2022 Emissions have changed by -0.1% (-23.19 Gg CO2 / year).
- 4: Total sectoral emissions in 2022 are 4127.50 Gg CO2 / year which is 10.2% of M.0.EL emissions. 2022 Emissions have changed by 0.3% (13.94 Gg CO2 / year). 1990-2022 Emissions have changed by 0.0% (0.42 Gg CO2 / year).
- 5: Total sectoral emissions in 2022 are 178.93 Gg
CO2 / year which is 0.4% of M.0.EL emissions. 2022 Emissions have
changed by -6.0% (-11.39 Gg CO2 /
year). 1990-2022 Emissions have changed by -0.3% (-0.35 Gg CO2 / year). For 2022 the
changes per gas
are:
