Changes in PRIMAP-hist v2.5.1_final compared to v2.5_final for Bangladesh
2024-02-29
Johannes Gütschow
Change analysis for Bangladesh for PRIMAP-hist v2.5.1_final compared to v2.5_final
Overview over emissions by sector and gas
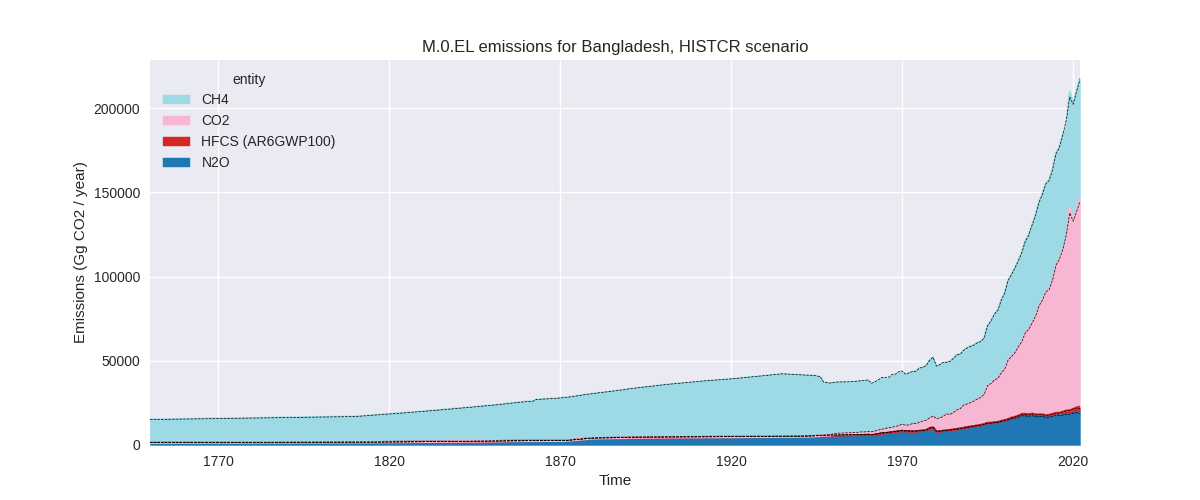
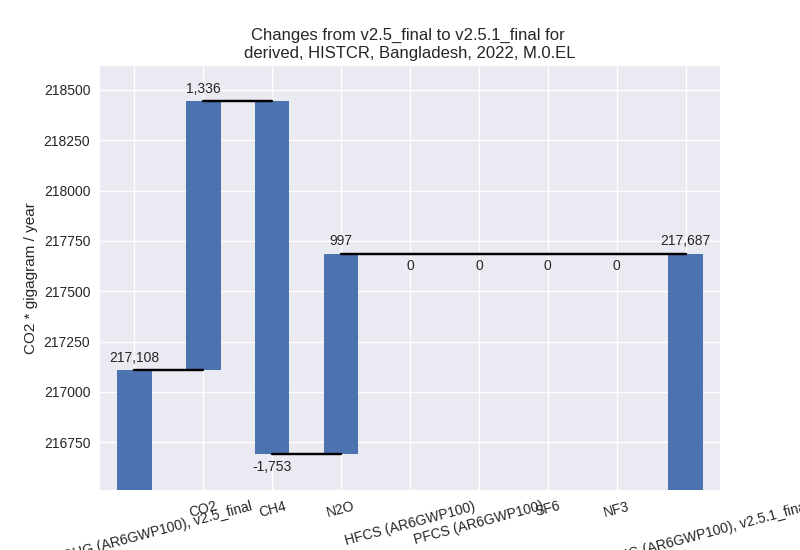
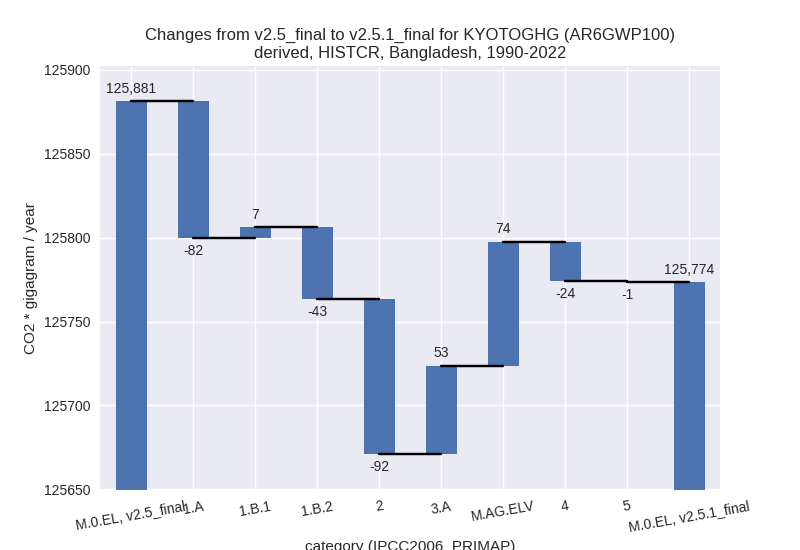
The following figures show the aggregate national total emissions excluding LULUCF AR6GWP100 for the country reported priority scenario. The dotted linesshow the v2.5_final data.

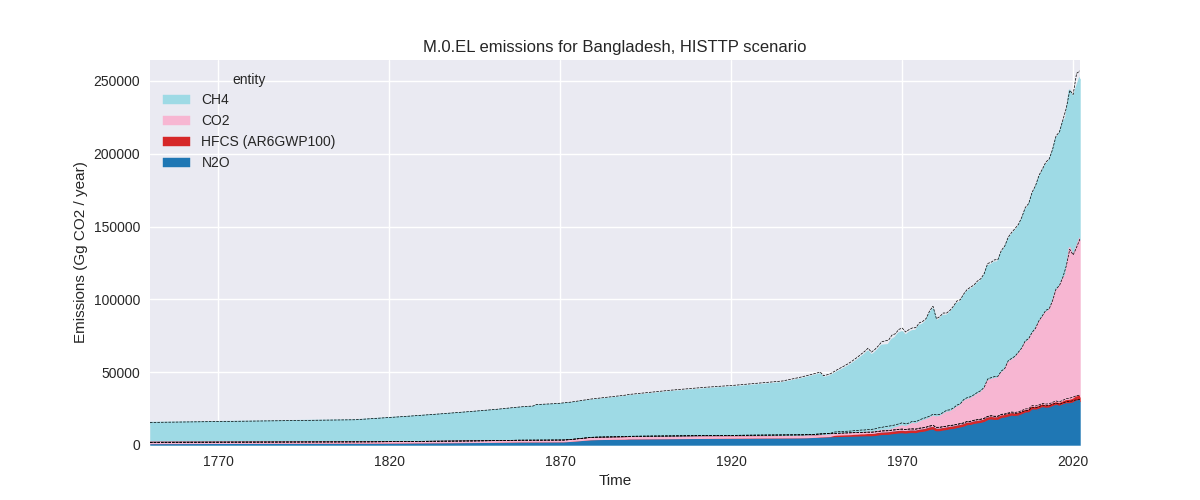
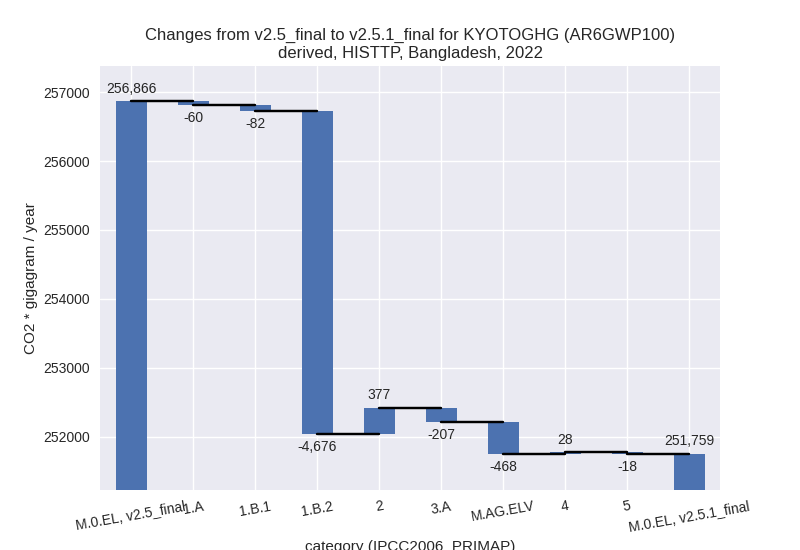
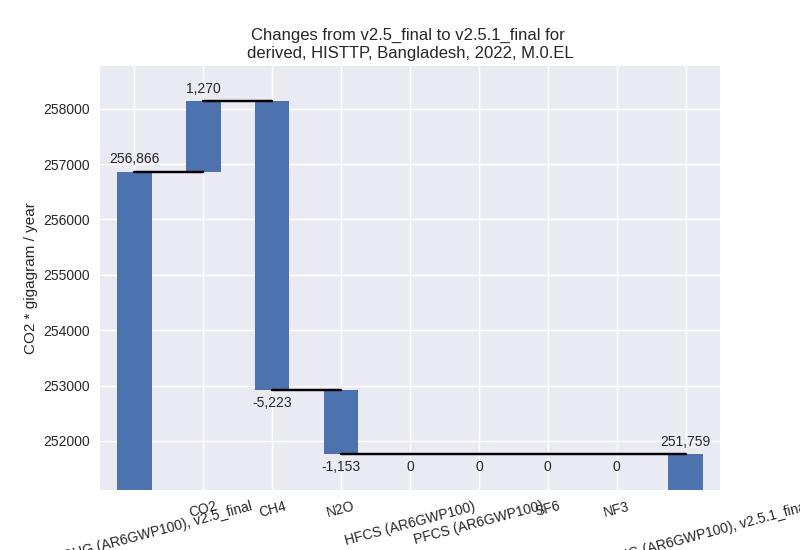
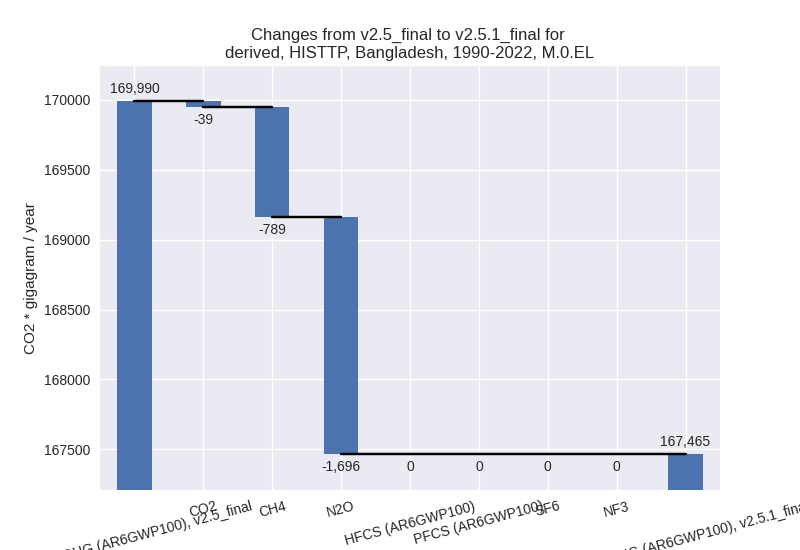
The following figures show the aggregate national total emissions excluding LULUCF AR6GWP100 for the third party priority scenario. The dotted linesshow the v2.5_final data.


Overview over changes
In the country reported priority scenario we have the following changes for aggregate Kyoto GHG and national total emissions excluding LULUCF (M.0.EL):
- Emissions in 2022 have changed by 0.3%% (579.43 Gg CO2 / year)
- Emissions in 1990-2022 have changed by -0.1%% (-107.61 Gg CO2 / year)
In the third party priority scenario we have the following changes for aggregate Kyoto GHG and national total emissions excluding LULUCF (M.0.EL):
- Emissions in 2022 have changed by -2.0%% (-5106.34 Gg CO2 / year)
- Emissions in 1990-2022 have changed by -1.5%% (-2525.12 Gg CO2 / year)
Most important changes per scenario and time frame
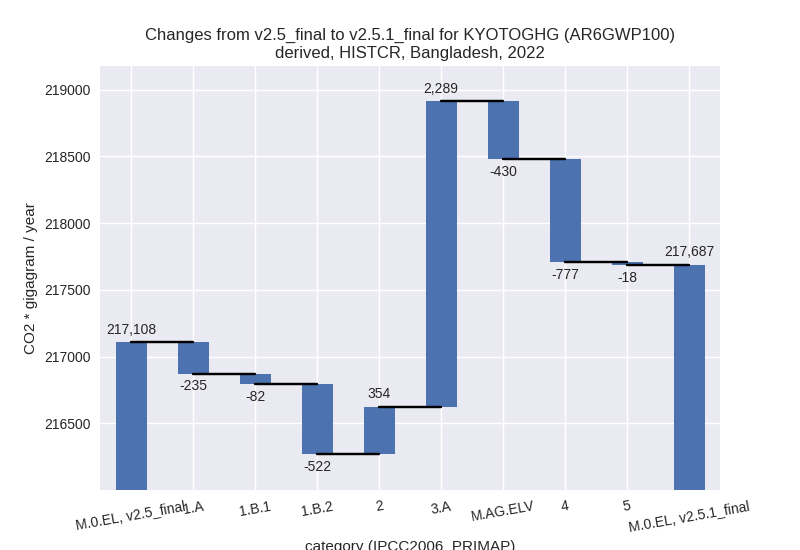
In the country reported priority scenario the following sector-gas combinations have the highest absolute impact on national total KyotoGHG (AR6GWP100) emissions in 2022 (top 5):
- 1: 3.A, CH4 with 1247.73 Gg CO2 / year (6.8%)
- 2: 3.A, N2O with 1041.30 Gg CO2 / year (23.0%)
- 3: M.AG.ELV, CH4 with -1019.10 Gg CO2 / year (-5.6%)
- 4: 4, CH4 with -745.75 Gg CO2 / year (-2.5%)
- 5: 1.A, CH4 with -635.06 Gg CO2 / year (-20.7%)
In the country reported priority scenario the following sector-gas combinations have the highest absolute impact on national total KyotoGHG (AR6GWP100) emissions in 1990-2022 (top 5):
- 1: 2, CO2 with -92.47 Gg CO2 / year (-3.9%)
- 2: M.AG.ELV, CO2 with 74.04 Gg CO2 / year (4.4%)
- 3: 1.B.2, CH4 with -42.71 Gg CO2 / year (-5.7%)
- 4: 1.A, CH4 with -36.06 Gg CO2 / year (-3.2%)
- 5: 3.A, N2O with 27.26 Gg CO2 / year (0.4%)
In the third party priority scenario the following sector-gas combinations have the highest absolute impact on national total KyotoGHG (AR6GWP100) emissions in 2022 (top 5):
- 1: 1.B.2, CH4 with -4675.07 Gg CO2 / year (-34.0%)
- 2: M.AG.ELV, N2O with -813.45 Gg CO2 / year (-3.2%)
- 3: 1.A, CO2 with 541.66 Gg CO2 / year (0.5%)
- 4: 2, CO2 with 377.21 Gg CO2 / year (11.8%)
- 5: M.AG.ELV, CO2 with 354.55 Gg CO2 / year (18.7%)
In the third party priority scenario the following sector-gas combinations have the highest absolute impact on national total KyotoGHG (AR6GWP100) emissions in 1990-2022 (top 5):
- 1: M.AG.ELV, N2O with -1639.88 Gg CO2 / year (-8.2%)
- 2: 1.B.2, CH4 with -728.41 Gg CO2 / year (-11.6%)
- 3: 2, CO2 with -90.18 Gg CO2 / year (-2.8%)
- 4: M.AG.ELV, CO2 with 74.04 Gg CO2 / year (4.4%)
- 5: 1.A, N2O with -55.11 Gg CO2 / year (-3.1%)
Notes on data changes
No country specific notes present for this changelog.
Changes by sector and gas
For each scenario and time frame the changes are displayed for all individual sectors and all individual gases. In the sector plot we use aggregate Kyoto GHGs in AR6GWP100. In the gas plot we usenational total emissions without LULUCF. ## country reported scenario
2022
1990-2022

third party scenario
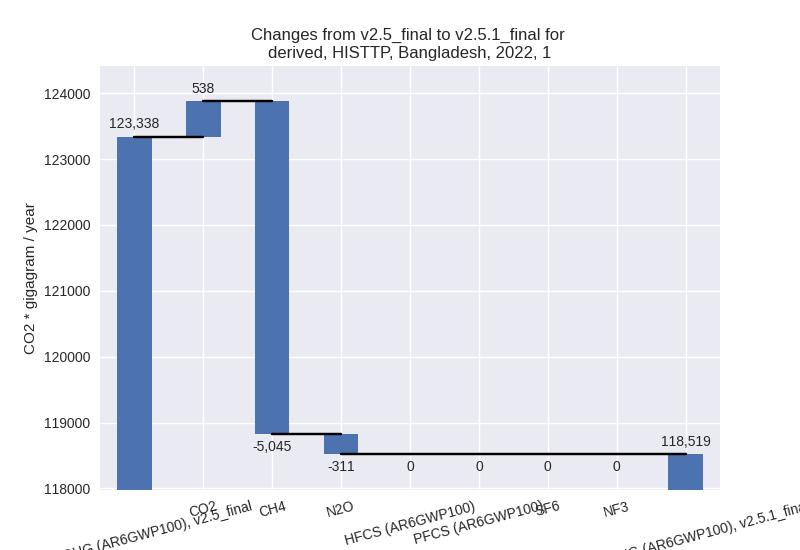
2022
1990-2022

Detailed changes for the scenarios:
country reported scenario (HISTCR):
Most important changes per time frame
For 2022 the following sector-gas combinations have the highest absolute impact on national total KyotoGHG (AR6GWP100) emissions in 2022 (top 5):
- 1: 3.A, CH4 with 1247.73 Gg CO2 / year (6.8%)
- 2: 3.A, N2O with 1041.30 Gg CO2 / year (23.0%)
- 3: M.AG.ELV, CH4 with -1019.10 Gg CO2 / year (-5.6%)
- 4: 4, CH4 with -745.75 Gg CO2 / year (-2.5%)
- 5: 1.A, CH4 with -635.06 Gg CO2 / year (-20.7%)
For 1990-2022 the following sector-gas combinations have the highest absolute impact on national total KyotoGHG (AR6GWP100) emissions in 1990-2022 (top 5):
- 1: 2, CO2 with -92.47 Gg CO2 / year (-3.9%)
- 2: M.AG.ELV, CO2 with 74.04 Gg CO2 / year (4.4%)
- 3: 1.B.2, CH4 with -42.71 Gg CO2 / year (-5.7%)
- 4: 1.A, CH4 with -36.06 Gg CO2 / year (-3.2%)
- 5: 3.A, N2O with 27.26 Gg CO2 / year (0.4%)
Changes in the main sectors for aggregate KyotoGHG (AR6GWP100) are
- 1: Total sectoral emissions in 2022 are 124814.82 Gg CO2 / year which is 57.3% of M.0.EL emissions. 2022 Emissions have changed by -0.7% (-839.01 Gg CO2 / year). 1990-2022 Emissions have changed by -0.2% (-117.69 Gg CO2 / year).
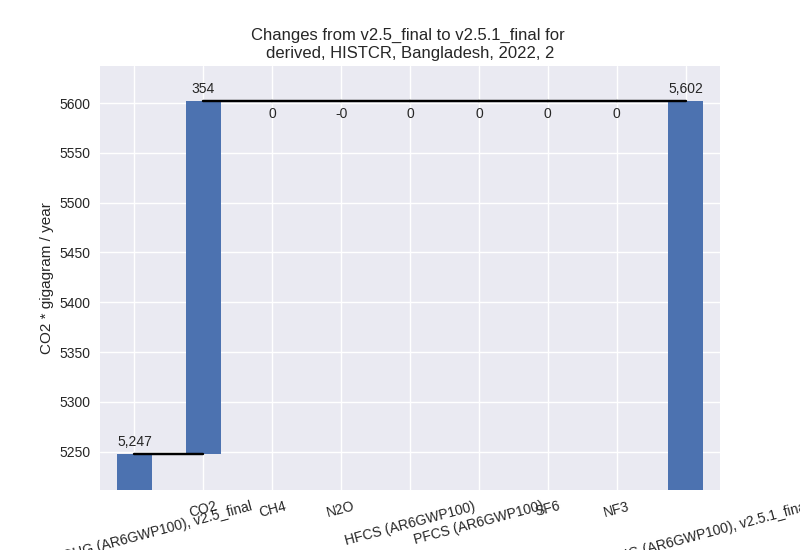
- 2: Total sectoral emissions in 2022 are 5601.82 Gg
CO2 / year which is 2.6% of M.0.EL emissions. 2022 Emissions have
changed by 6.8% (354.48 Gg CO2 /
year). 1990-2022 Emissions have changed by -2.8% (-92.47 Gg CO2 / year). For 2022 the
changes per gas
are:
For 1990-2022 the changes per gas are:
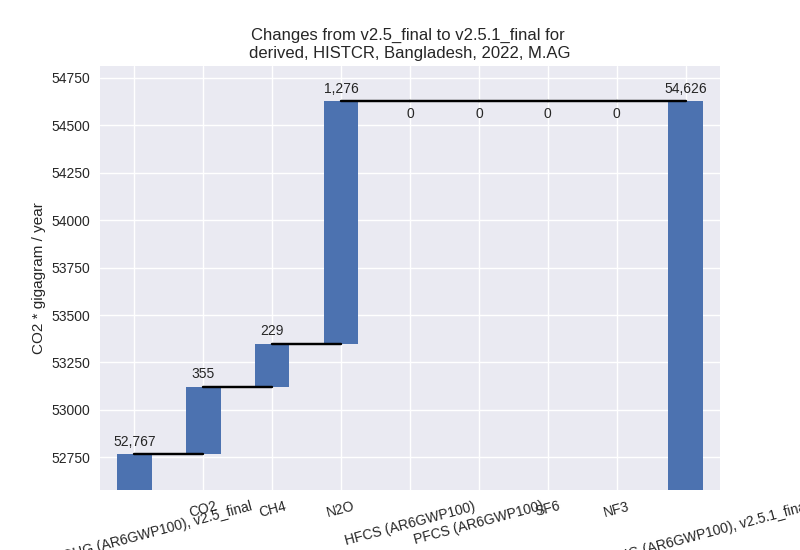
- M.AG: Total sectoral emissions in 2022 are 54626.01
Gg CO2 / year which is 25.1% of M.0.EL emissions. 2022 Emissions have
changed by 3.5% (1859.24 Gg CO2 /
year). 1990-2022 Emissions have changed by 0.3% (126.64 Gg CO2 / year). For 2022 the
changes per gas
are:
The changes come from the following subsectors:- 3.A: Total sectoral emissions in 2022 are 25255.16
Gg CO2 / year which is 46.2% of category M.AG emissions. 2022 Emissions
have changed by 10.0% (2289.03 Gg
CO2 / year). 1990-2022 Emissions have changed by 0.2% (52.55 Gg CO2 / year). For 2022 the
changes per gas
are:

There is no subsector information available in PRIMAP-hist. - M.AG.ELV: Total sectoral emissions in 2022 are 29370.85 Gg CO2 / year which is 53.8% of category M.AG emissions. 2022 Emissions have changed by -1.4% (-429.79 Gg CO2 / year). 1990-2022 Emissions have changed by 0.3% (74.09 Gg CO2 / year).
- 3.A: Total sectoral emissions in 2022 are 25255.16
Gg CO2 / year which is 46.2% of category M.AG emissions. 2022 Emissions
have changed by 10.0% (2289.03 Gg
CO2 / year). 1990-2022 Emissions have changed by 0.2% (52.55 Gg CO2 / year). For 2022 the
changes per gas
are:
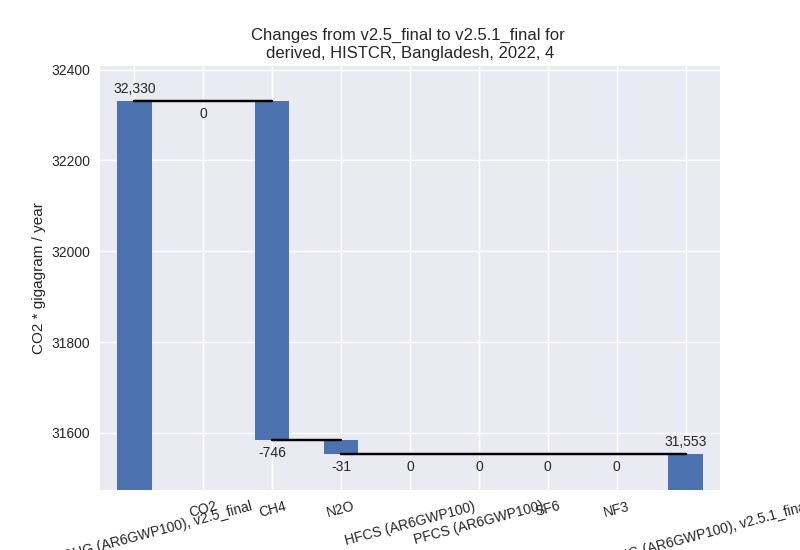
- 4: Total sectoral emissions in 2022 are 31552.94 Gg
CO2 / year which is 14.5% of M.0.EL emissions. 2022 Emissions have
changed by -2.4% (-777.15 Gg CO2 /
year). 1990-2022 Emissions have changed by -0.1% (-23.55 Gg CO2 / year). For 2022 the
changes per gas
are:
- 5: Total sectoral emissions in 2022 are 1091.52 Gg CO2 / year which is 0.5% of M.0.EL emissions. 2022 Emissions have changed by -1.6% (-18.14 Gg CO2 / year). 1990-2022 Emissions have changed by -0.1% (-0.55 Gg CO2 / year).
third party scenario (HISTTP):
Most important changes per time frame
For 2022 the following sector-gas combinations have the highest absolute impact on national total KyotoGHG (AR6GWP100) emissions in 2022 (top 5):
- 1: 1.B.2, CH4 with -4675.07 Gg CO2 / year (-34.0%)
- 2: M.AG.ELV, N2O with -813.45 Gg CO2 / year (-3.2%)
- 3: 1.A, CO2 with 541.66 Gg CO2 / year (0.5%)
- 4: 2, CO2 with 377.21 Gg CO2 / year (11.8%)
- 5: M.AG.ELV, CO2 with 354.55 Gg CO2 / year (18.7%)
For 1990-2022 the following sector-gas combinations have the highest absolute impact on national total KyotoGHG (AR6GWP100) emissions in 1990-2022 (top 5):
- 1: M.AG.ELV, N2O with -1639.88 Gg CO2 / year (-8.2%)
- 2: 1.B.2, CH4 with -728.41 Gg CO2 / year (-11.6%)
- 3: 2, CO2 with -90.18 Gg CO2 / year (-2.8%)
- 4: M.AG.ELV, CO2 with 74.04 Gg CO2 / year (4.4%)
- 5: 1.A, N2O with -55.11 Gg CO2 / year (-3.1%)
Changes in the main sectors for aggregate KyotoGHG (AR6GWP100) are
- 1: Total sectoral emissions in 2022 are 118519.47
Gg CO2 / year which is 47.1% of M.0.EL emissions. 2022 Emissions have
changed by -3.9% (-4818.23 Gg CO2 /
year). 1990-2022 Emissions have changed by -1.4% (-852.99 Gg CO2 / year). For 2022
the changes per gas
are:
The changes come from the following subsectors:- 1.A: Total sectoral emissions in 2022 are 108785.50 Gg CO2 / year which is 91.8% of category 1 emissions. 2022 Emissions have changed by -0.1% (-60.47 Gg CO2 / year). 1990-2022 Emissions have changed by -0.2% (-131.31 Gg CO2 / year).
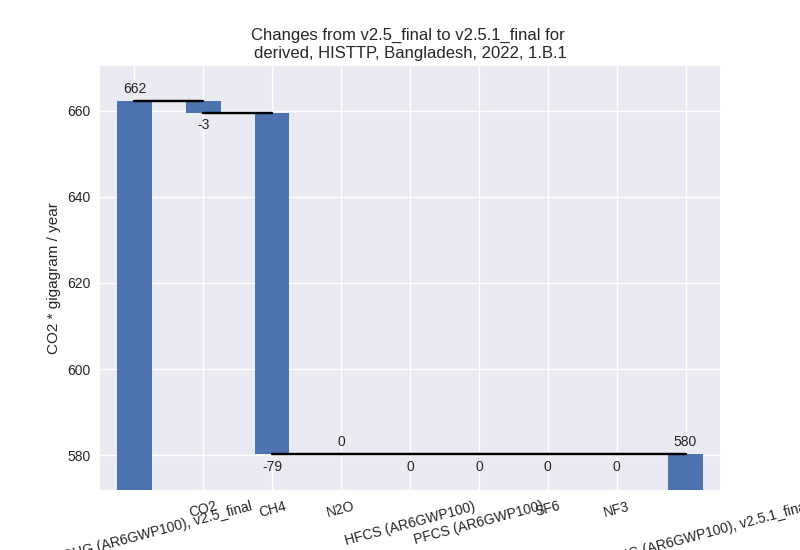
- 1.B.1: Total sectoral emissions in 2022 are 580.30
Gg CO2 / year which is 0.5% of category 1 emissions. 2022 Emissions have
changed by -12.4% (-81.86 Gg CO2 /
year). 1990-2022 Emissions have changed by 1.6% (6.58 Gg CO2 / year). For 2022 the
changes per gas
are:
There is no subsector information available in PRIMAP-hist. - 1.B.2: Total sectoral emissions in 2022 are 9153.66
Gg CO2 / year which is 7.7% of category 1 emissions. 2022 Emissions have
changed by -33.8% (-4675.90 Gg CO2 /
year). 1990-2022 Emissions have changed by -11.5% (-728.27 Gg CO2 / year). For 2022
the changes per gas
are:

For 1990-2022 the changes per gas are:
There is no subsector information available in PRIMAP-hist.
- 2: Total sectoral emissions in 2022 are 6556.43 Gg
CO2 / year which is 2.6% of M.0.EL emissions. 2022 Emissions have
changed by 6.1% (377.20 Gg CO2 /
year). 1990-2022 Emissions have changed by -2.2% (-90.18 Gg CO2 / year). For 2022 the
changes per gas
are:

For 1990-2022 the changes per gas are:
- M.AG: Total sectoral emissions in 2022 are 95507.39 Gg CO2 / year which is 37.9% of M.0.EL emissions. 2022 Emissions have changed by -0.7% (-674.69 Gg CO2 / year). 1990-2022 Emissions have changed by -1.9% (-1582.23 Gg CO2 / year).
- 4: Total sectoral emissions in 2022 are 30084.39 Gg CO2 / year which is 11.9% of M.0.EL emissions. 2022 Emissions have changed by 0.1% (27.53 Gg CO2 / year). 1990-2022 Emissions have changed by 0.0% (0.83 Gg CO2 / year).
- 5: Total sectoral emissions in 2022 are 1091.52 Gg CO2 / year which is 0.4% of M.0.EL emissions. 2022 Emissions have changed by -1.6% (-18.14 Gg CO2 / year). 1990-2022 Emissions have changed by -0.1% (-0.55 Gg CO2 / year).