Changes in PRIMAP-hist v2.5.1_final compared to v2.5_final for Bahrain
2024-02-29
Johannes Gütschow
Change analysis for Bahrain for PRIMAP-hist v2.5.1_final compared to v2.5_final
Overview over emissions by sector and gas
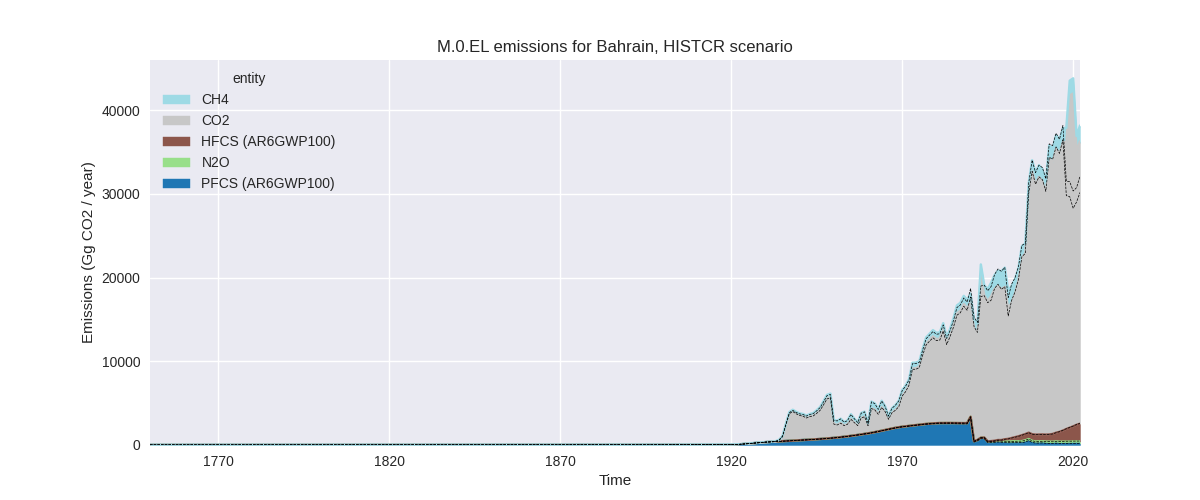
The following figures show the aggregate national total emissions excluding LULUCF AR6GWP100 for the country reported priority scenario. The dotted linesshow the v2.5_final data.


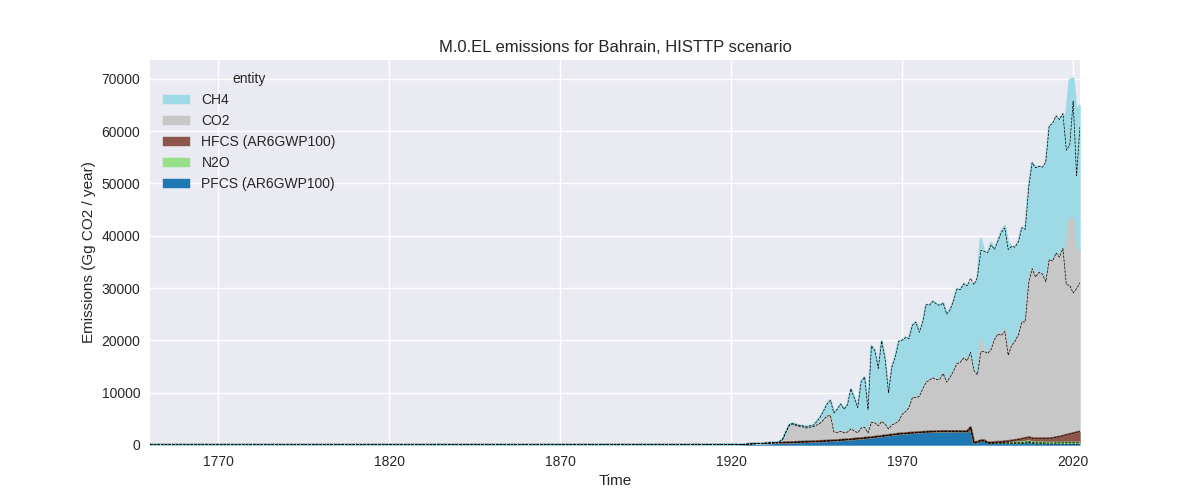
The following figures show the aggregate national total emissions excluding LULUCF AR6GWP100 for the third party priority scenario. The dotted linesshow the v2.5_final data.


Overview over changes
In the country reported priority scenario we have the following changes for aggregate Kyoto GHG and national total emissions excluding LULUCF (M.0.EL):
- Emissions in 2022 have changed by 18.8%% (6053.00 Gg CO2 / year)
- Emissions in 1990-2022 have changed by 5.1%% (1352.38 Gg CO2 / year)
In the third party priority scenario we have the following changes for aggregate Kyoto GHG and national total emissions excluding LULUCF (M.0.EL):
- Emissions in 2022 have changed by 6.7%% (4073.44 Gg CO2 / year)
- Emissions in 1990-2022 have changed by 2.6%% (1221.73 Gg CO2 / year)
Most important changes per scenario and time frame
In the country reported priority scenario the following sector-gas combinations have the highest absolute impact on national total KyotoGHG (AR6GWP100) emissions in 2022 (top 5):
- 1: 1.A, CO2 with 5366.97 Gg CO2 / year (22.0%)
- 2: 2, CO2 with 773.56 Gg CO2 / year (26.1%)
- 3: 1.B.2, CH4 with -57.19 Gg CO2 / year (-7.7%)
- 4: M.AG.ELV, N2O with -42.84 Gg CO2 / year (-69.3%)
- 5: 4, CH4 with 15.82 Gg CO2 / year (1.4%)
In the country reported priority scenario the following sector-gas combinations have the highest absolute impact on national total KyotoGHG (AR6GWP100) emissions in 1990-2022 (top 5):
- 1: 1.A, CO2 with 1283.68 Gg CO2 / year (6.2%)
- 2: 2, CO2 with 81.74 Gg CO2 / year (3.5%)
- 3: M.AG.ELV, N2O with -7.72 Gg CO2 / year (-28.8%)
- 4: 1.B.2, CH4 with -4.82 Gg CO2 / year (-0.6%)
- 5: 3.A, CH4 with -1.05 Gg CO2 / year (-4.6%)
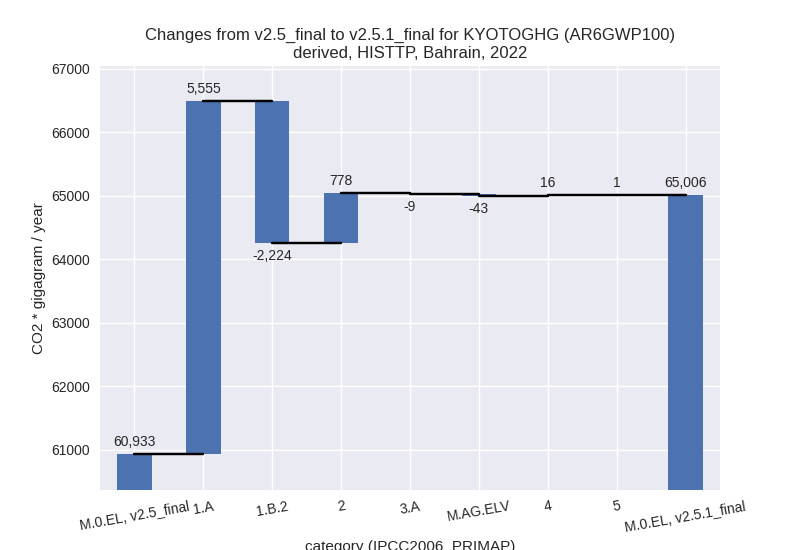
In the third party priority scenario the following sector-gas combinations have the highest absolute impact on national total KyotoGHG (AR6GWP100) emissions in 2022 (top 5):
- 1: 1.A, CO2 with 5553.83 Gg CO2 / year (22.0%)
- 2: 1.B.2, CH4 with -2223.54 Gg CO2 / year (-7.8%)
- 3: 2, CO2 with 773.56 Gg CO2 / year (26.1%)
- 4: M.AG.ELV, N2O with -42.84 Gg CO2 / year (-69.3%)
- 5: 4, CH4 with 15.82 Gg CO2 / year (1.4%)
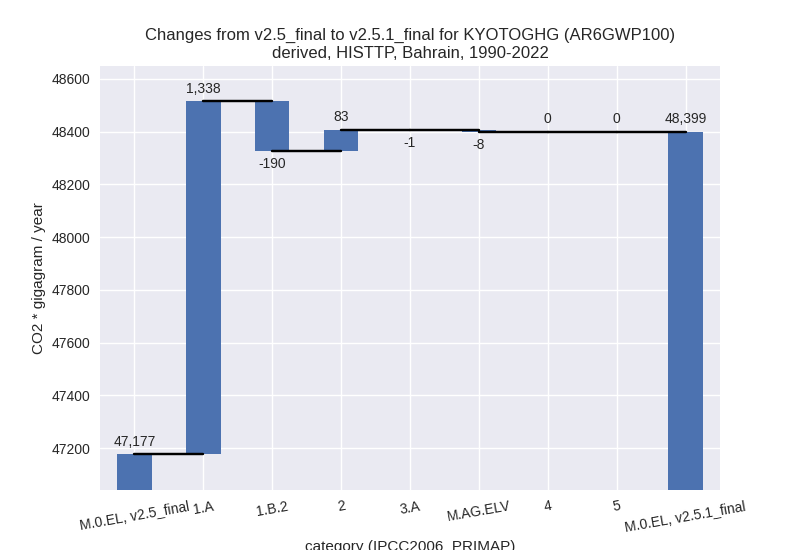
In the third party priority scenario the following sector-gas combinations have the highest absolute impact on national total KyotoGHG (AR6GWP100) emissions in 1990-2022 (top 5):
- 1: 1.A, CO2 with 1337.77 Gg CO2 / year (6.1%)
- 2: 1.B.2, CH4 with -189.55 Gg CO2 / year (-0.9%)
- 3: 2, CO2 with 81.74 Gg CO2 / year (3.5%)
- 4: M.AG.ELV, N2O with -7.72 Gg CO2 / year (-28.8%)
- 5: 3.A, CH4 with -1.05 Gg CO2 / year (-4.6%)
Notes on data changes
Here we list notes explaining important emissions changes for the country. ’' means that the following text only applies to the TP time series, while means that it only applies to the CR scenario. Otherwise the note applies to both scenarios.
- 1.A, CO2: The changes in 2022 and cumulative emissions come from the inclusion of new CDIAC data which replaced EI data past 2017. EI data showed a steep emissions decline in 2018 which is not present in CDIAC data leading to higher emissions post 2017.
- 2, CO2: EDGAR 8.0 shows a steep emissions increase from 2018 to 2020 in 2.C (metal industry) which is not present in EDGAR 7.0. This leads to much higher emissions in 2019 and following years.
- 1.B.2, CH4: EDGAR 7.0 showed high fluctuations for recent years which are not present in EDGAR 8.0 leading to changes in 2022 emissions.
Changes by sector and gas
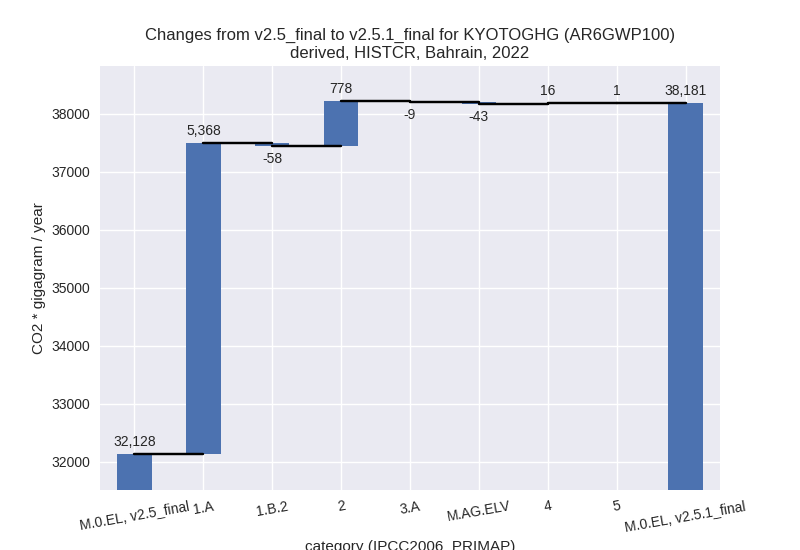
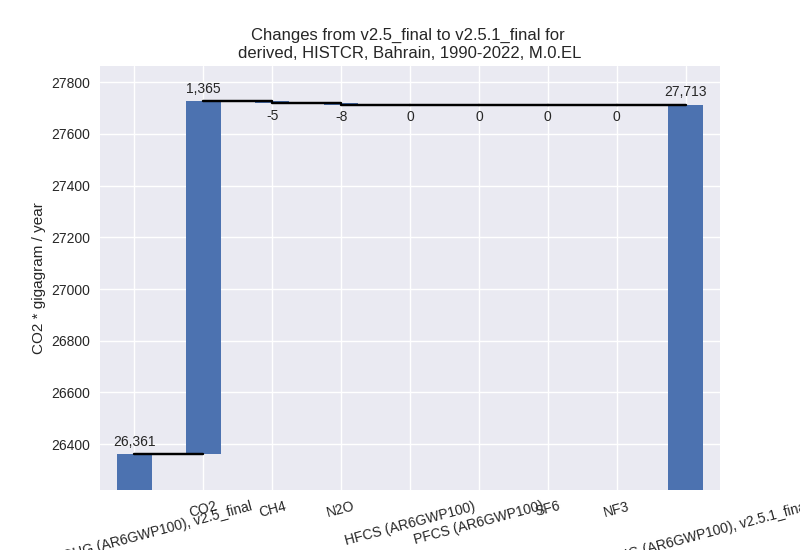
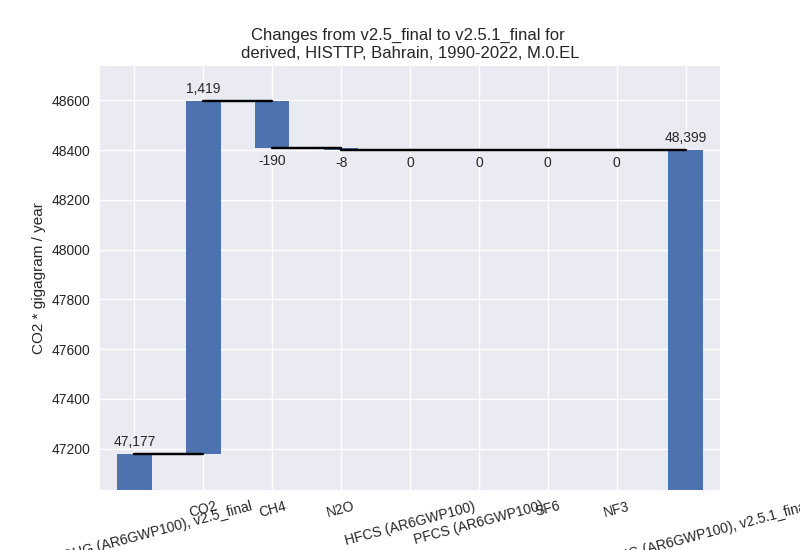
For each scenario and time frame the changes are displayed for all individual sectors and all individual gases. In the sector plot we use aggregate Kyoto GHGs in AR6GWP100. In the gas plot we usenational total emissions without LULUCF. ## country reported scenario
2022

1990-2022

third party scenario
2022

1990-2022
Detailed changes for the scenarios:
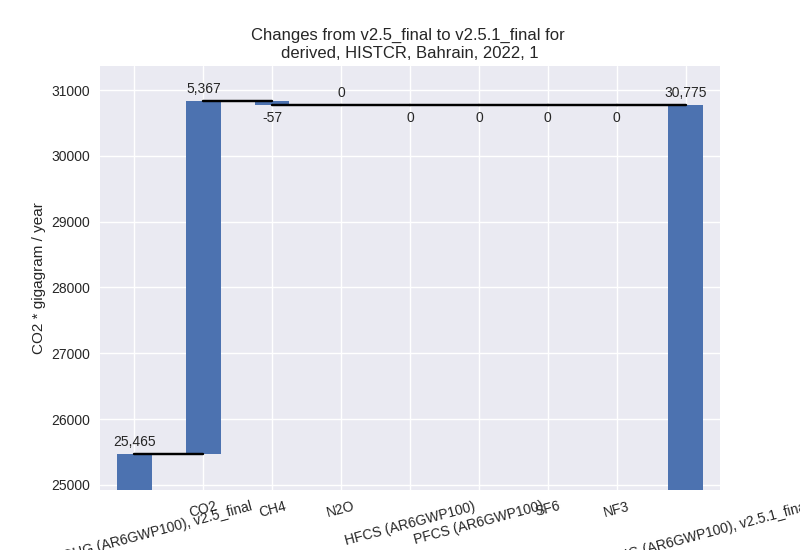
country reported scenario (HISTCR):
Most important changes per time frame
For 2022 the following sector-gas combinations have the highest absolute impact on national total KyotoGHG (AR6GWP100) emissions in 2022 (top 5):
- 1: 1.A, CO2 with 5366.97 Gg CO2 / year (22.0%)
- 2: 2, CO2 with 773.56 Gg CO2 / year (26.1%)
- 3: 1.B.2, CH4 with -57.19 Gg CO2 / year (-7.7%)
- 4: M.AG.ELV, N2O with -42.84 Gg CO2 / year (-69.3%)
- 5: 4, CH4 with 15.82 Gg CO2 / year (1.4%)
For 1990-2022 the following sector-gas combinations have the highest absolute impact on national total KyotoGHG (AR6GWP100) emissions in 1990-2022 (top 5):
- 1: 1.A, CO2 with 1283.68 Gg CO2 / year (6.2%)
- 2: 2, CO2 with 81.74 Gg CO2 / year (3.5%)
- 3: M.AG.ELV, N2O with -7.72 Gg CO2 / year (-28.8%)
- 4: 1.B.2, CH4 with -4.82 Gg CO2 / year (-0.6%)
- 5: 3.A, CH4 with -1.05 Gg CO2 / year (-4.6%)
Changes in the main sectors for aggregate KyotoGHG (AR6GWP100) are
- 1: Total sectoral emissions in 2022 are 30774.61 Gg
CO2 / year which is 80.6% of M.0.EL emissions. 2022 Emissions have
changed by 20.9% (5309.83 Gg CO2 /
year). 1990-2022 Emissions have changed by 5.8% (1278.91 Gg CO2 / year). For 2022 the
changes per gas
are:
For 1990-2022 the changes per gas are: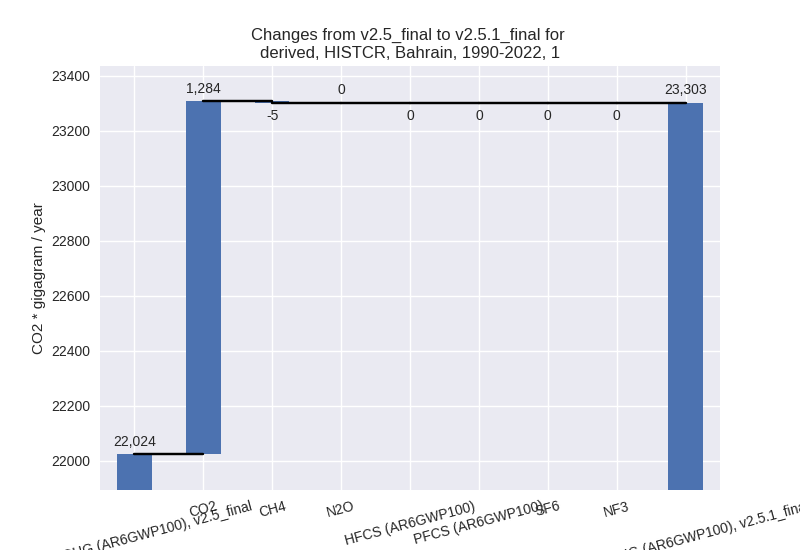
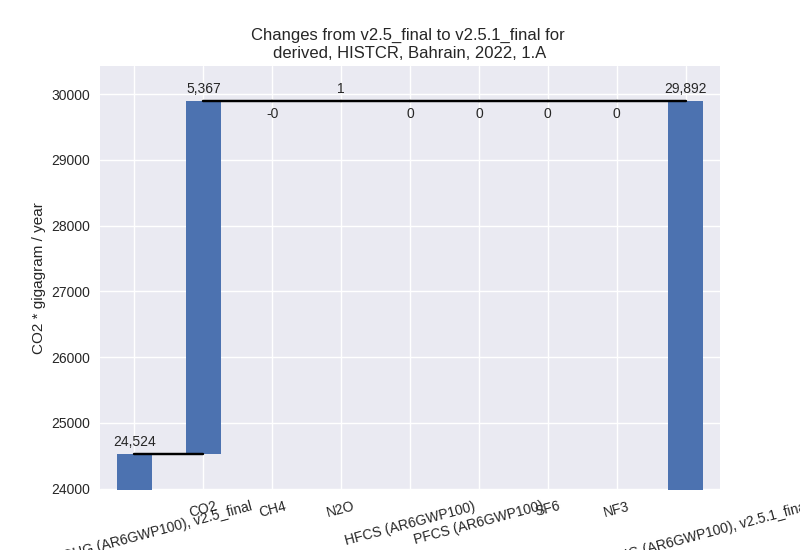
The changes come from the following subsectors:- 1.A: Total sectoral emissions in 2022 are 29892.15
Gg CO2 / year which is 97.1% of category 1 emissions. 2022 Emissions
have changed by 21.9% (5367.72 Gg
CO2 / year). 1990-2022 Emissions have changed by 6.2% (1283.76 Gg CO2 / year). For 2022 the
changes per gas
are:
For 1990-2022 the changes per gas are:
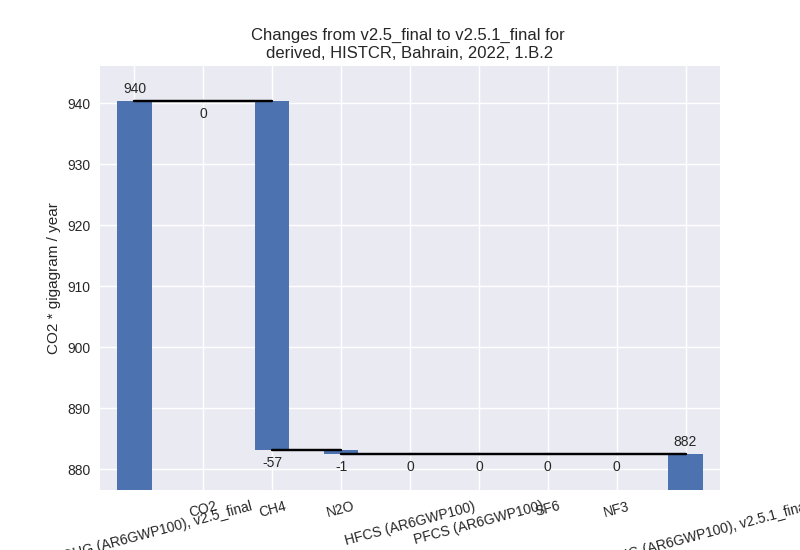
There is no subsector information available in PRIMAP-hist. - 1.B.2: Total sectoral emissions in 2022 are 882.45
Gg CO2 / year which is 2.9% of category 1 emissions. 2022 Emissions have
changed by -6.2% (-57.89 Gg CO2 /
year). 1990-2022 Emissions have changed by -0.4% (-4.84 Gg CO2 / year). For 2022 the
changes per gas
are:
There is no subsector information available in PRIMAP-hist.
- 1.A: Total sectoral emissions in 2022 are 29892.15
Gg CO2 / year which is 97.1% of category 1 emissions. 2022 Emissions
have changed by 21.9% (5367.72 Gg
CO2 / year). 1990-2022 Emissions have changed by 6.2% (1283.76 Gg CO2 / year). For 2022 the
changes per gas
are:
- 2: Total sectoral emissions in 2022 are 6142.00 Gg
CO2 / year which is 16.1% of M.0.EL emissions. 2022 Emissions have
changed by 14.5% (778.03 Gg CO2 /
year). 1990-2022 Emissions have changed by 2.4% (82.54 Gg CO2 / year). For 2022 the
changes per gas
are:

For 1990-2022 the changes per gas are:
- M.AG: Total sectoral emissions in 2022 are 43.30 Gg
CO2 / year which is 0.1% of M.0.EL emissions. 2022 Emissions have
changed by -54.6% (-52.15 Gg CO2 /
year). 1990-2022 Emissions have changed by -18.8% (-9.61 Gg CO2 / year). For 2022 the
changes per gas
are:

For 1990-2022 the changes per gas are: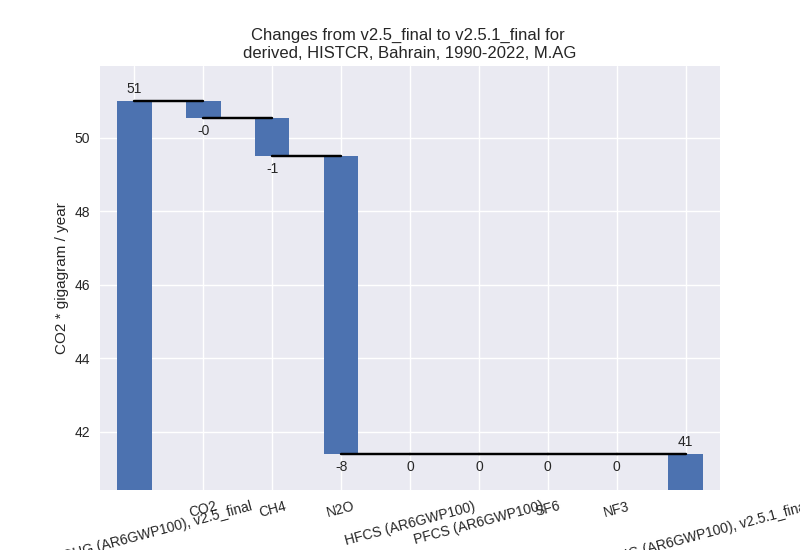
The changes come from the following subsectors:- 3.A: Total sectoral emissions in 2022 are 24.34 Gg
CO2 / year which is 56.2% of category M.AG emissions. 2022 Emissions
have changed by -26.3% (-8.70 Gg CO2
/ year). 1990-2022 Emissions have changed by -6.1% (-1.44 Gg CO2 / year). For 2022 the
changes per gas
are:
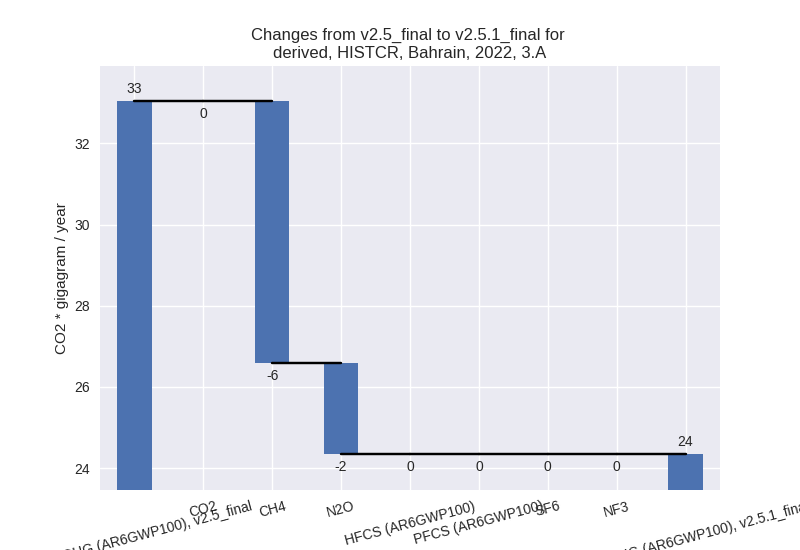
For 1990-2022 the changes per gas are: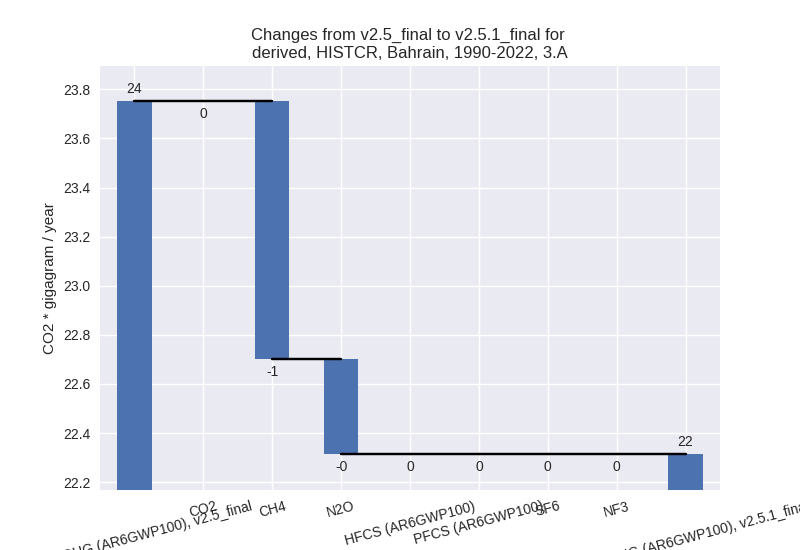
There is no subsector information available in PRIMAP-hist. - M.AG.ELV: Total sectoral emissions in 2022 are
18.95 Gg CO2 / year which is 43.8% of category M.AG emissions. 2022
Emissions have changed by -69.6%
(-43.46 Gg CO2 / year). 1990-2022 Emissions have changed by -30.0% (-8.17 Gg CO2 / year). For 2022 the
changes per gas
are:

For 1990-2022 the changes per gas are:
There is no subsector information available in PRIMAP-hist.
- 3.A: Total sectoral emissions in 2022 are 24.34 Gg
CO2 / year which is 56.2% of category M.AG emissions. 2022 Emissions
have changed by -26.3% (-8.70 Gg CO2
/ year). 1990-2022 Emissions have changed by -6.1% (-1.44 Gg CO2 / year). For 2022 the
changes per gas
are:
- 4: Total sectoral emissions in 2022 are 1132.75 Gg CO2 / year which is 3.0% of M.0.EL emissions. 2022 Emissions have changed by 1.5% (16.29 Gg CO2 / year). 1990-2022 Emissions have changed by 0.1% (0.49 Gg CO2 / year).
- 5: Total sectoral emissions in 2022 are 88.74 Gg CO2 / year which is 0.2% of M.0.EL emissions. 2022 Emissions have changed by 1.1% (1.00 Gg CO2 / year). 1990-2022 Emissions have changed by 0.0% (0.03 Gg CO2 / year).
third party scenario (HISTTP):
Most important changes per time frame
For 2022 the following sector-gas combinations have the highest absolute impact on national total KyotoGHG (AR6GWP100) emissions in 2022 (top 5):
- 1: 1.A, CO2 with 5553.83 Gg CO2 / year (22.0%)
- 2: 1.B.2, CH4 with -2223.54 Gg CO2 / year (-7.8%)
- 3: 2, CO2 with 773.56 Gg CO2 / year (26.1%)
- 4: M.AG.ELV, N2O with -42.84 Gg CO2 / year (-69.3%)
- 5: 4, CH4 with 15.82 Gg CO2 / year (1.4%)
For 1990-2022 the following sector-gas combinations have the highest absolute impact on national total KyotoGHG (AR6GWP100) emissions in 1990-2022 (top 5):
- 1: 1.A, CO2 with 1337.77 Gg CO2 / year (6.1%)
- 2: 1.B.2, CH4 with -189.55 Gg CO2 / year (-0.9%)
- 3: 2, CO2 with 81.74 Gg CO2 / year (3.5%)
- 4: M.AG.ELV, N2O with -7.72 Gg CO2 / year (-28.8%)
- 5: 3.A, CH4 with -1.05 Gg CO2 / year (-4.6%)
Changes in the main sectors for aggregate KyotoGHG (AR6GWP100) are
- 1: Total sectoral emissions in 2022 are 57599.45 Gg
CO2 / year which is 88.6% of M.0.EL emissions. 2022 Emissions have
changed by 6.1% (3330.28 Gg CO2 /
year). 1990-2022 Emissions have changed by 2.7% (1148.27 Gg CO2 / year). For 2022 the
changes per gas
are:

For 1990-2022 the changes per gas are:
The changes come from the following subsectors:- 1.A: Total sectoral emissions in 2022 are 30952.91
Gg CO2 / year which is 53.7% of category 1 emissions. 2022 Emissions
have changed by 21.9% (5554.51 Gg
CO2 / year). 1990-2022 Emissions have changed by 6.1% (1337.84 Gg CO2 / year). For 2022 the
changes per gas
are:

For 1990-2022 the changes per gas are:
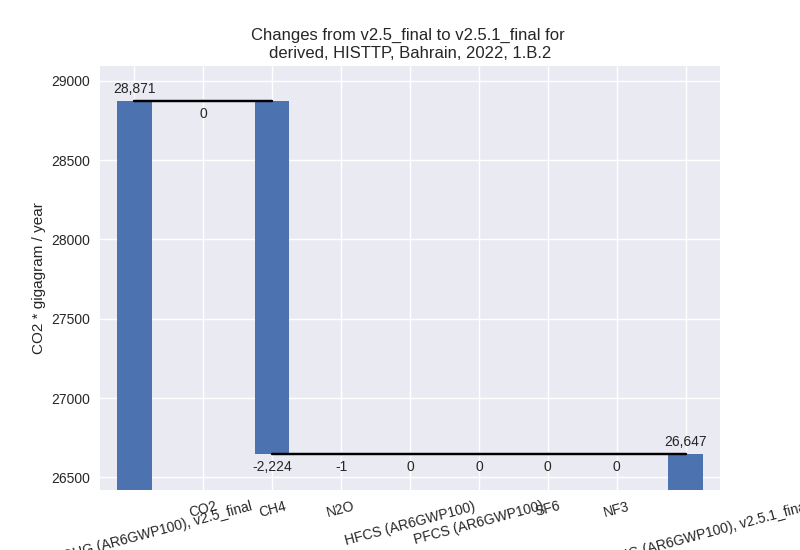
There is no subsector information available in PRIMAP-hist. - 1.B.2: Total sectoral emissions in 2022 are
26646.53 Gg CO2 / year which is 46.3% of category 1 emissions. 2022
Emissions have changed by -7.7%
(-2224.24 Gg CO2 / year). 1990-2022 Emissions have changed by -0.9% (-189.57 Gg CO2 / year). For 2022
the changes per gas
are:
There is no subsector information available in PRIMAP-hist.
- 1.A: Total sectoral emissions in 2022 are 30952.91
Gg CO2 / year which is 53.7% of category 1 emissions. 2022 Emissions
have changed by 21.9% (5554.51 Gg
CO2 / year). 1990-2022 Emissions have changed by 6.1% (1337.84 Gg CO2 / year). For 2022 the
changes per gas
are:
- 2: Total sectoral emissions in 2022 are 6142.00 Gg
CO2 / year which is 9.4% of M.0.EL emissions. 2022 Emissions have
changed by 14.5% (778.03 Gg CO2 /
year). 1990-2022 Emissions have changed by 2.4% (82.54 Gg CO2 / year). For 2022 the
changes per gas
are:

For 1990-2022 the changes per gas are:
- M.AG: Total sectoral emissions in 2022 are 43.30 Gg
CO2 / year which is 0.1% of M.0.EL emissions. 2022 Emissions have
changed by -54.6% (-52.15 Gg CO2 /
year). 1990-2022 Emissions have changed by -18.8% (-9.61 Gg CO2 / year). For 2022 the
changes per gas
are:
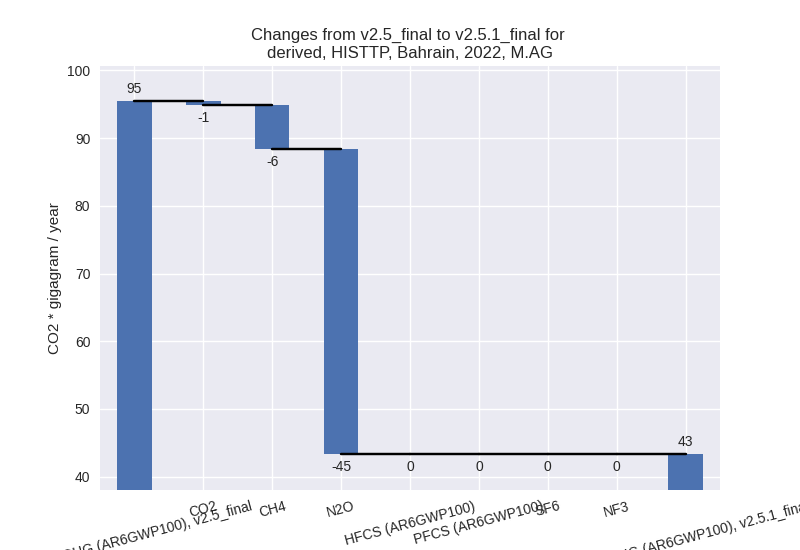
For 1990-2022 the changes per gas are:
The changes come from the following subsectors:- 3.A: Total sectoral emissions in 2022 are 24.34 Gg
CO2 / year which is 56.2% of category M.AG emissions. 2022 Emissions
have changed by -26.3% (-8.70 Gg CO2
/ year). 1990-2022 Emissions have changed by -6.1% (-1.44 Gg CO2 / year). For 2022 the
changes per gas
are:

For 1990-2022 the changes per gas are:
There is no subsector information available in PRIMAP-hist. - M.AG.ELV: Total sectoral emissions in 2022 are
18.95 Gg CO2 / year which is 43.8% of category M.AG emissions. 2022
Emissions have changed by -69.6%
(-43.46 Gg CO2 / year). 1990-2022 Emissions have changed by -30.0% (-8.17 Gg CO2 / year). For 2022 the
changes per gas
are:
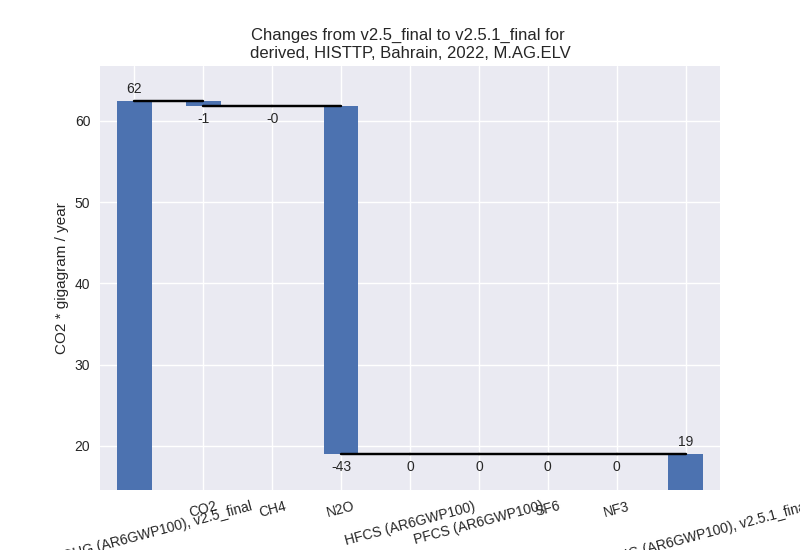
For 1990-2022 the changes per gas are: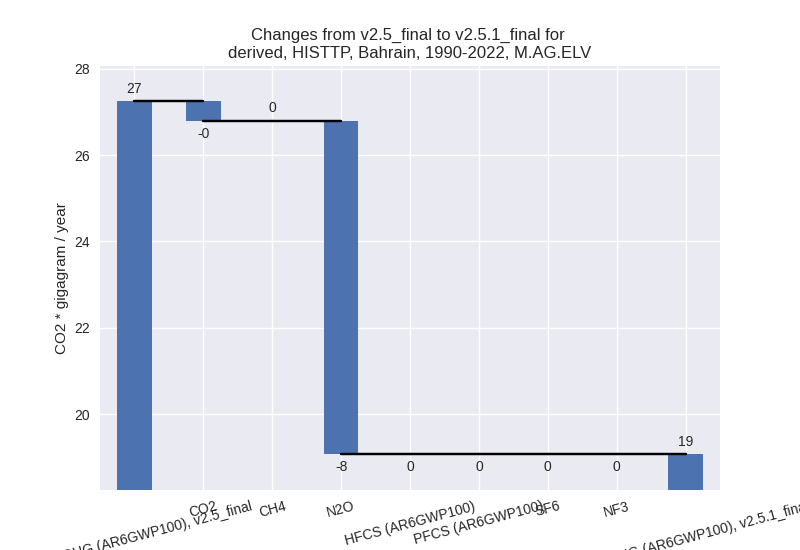
There is no subsector information available in PRIMAP-hist.
- 3.A: Total sectoral emissions in 2022 are 24.34 Gg
CO2 / year which is 56.2% of category M.AG emissions. 2022 Emissions
have changed by -26.3% (-8.70 Gg CO2
/ year). 1990-2022 Emissions have changed by -6.1% (-1.44 Gg CO2 / year). For 2022 the
changes per gas
are:
- 4: Total sectoral emissions in 2022 are 1132.75 Gg CO2 / year which is 1.7% of M.0.EL emissions. 2022 Emissions have changed by 1.5% (16.29 Gg CO2 / year). 1990-2022 Emissions have changed by 0.1% (0.49 Gg CO2 / year).
- 5: Total sectoral emissions in 2022 are 88.74 Gg CO2 / year which is 0.1% of M.0.EL emissions. 2022 Emissions have changed by 1.1% (1.00 Gg CO2 / year). 1990-2022 Emissions have changed by 0.0% (0.03 Gg CO2 / year).