Changes in PRIMAP-hist v2.5.1_final compared to v2.5_final for Bahamas
2024-02-29
Johannes Gütschow
Change analysis for Bahamas for PRIMAP-hist v2.5.1_final compared to v2.5_final
Overview over emissions by sector and gas
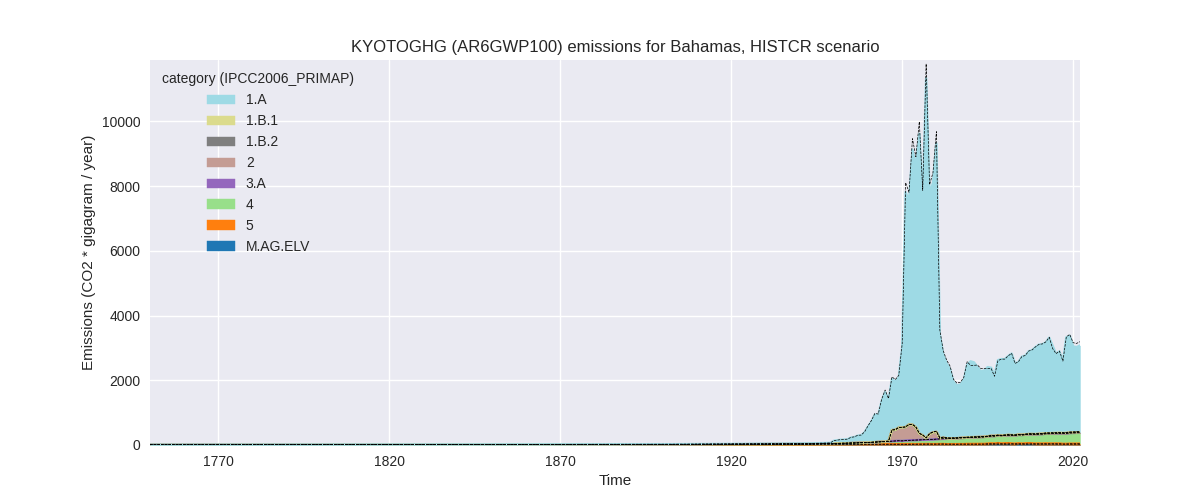
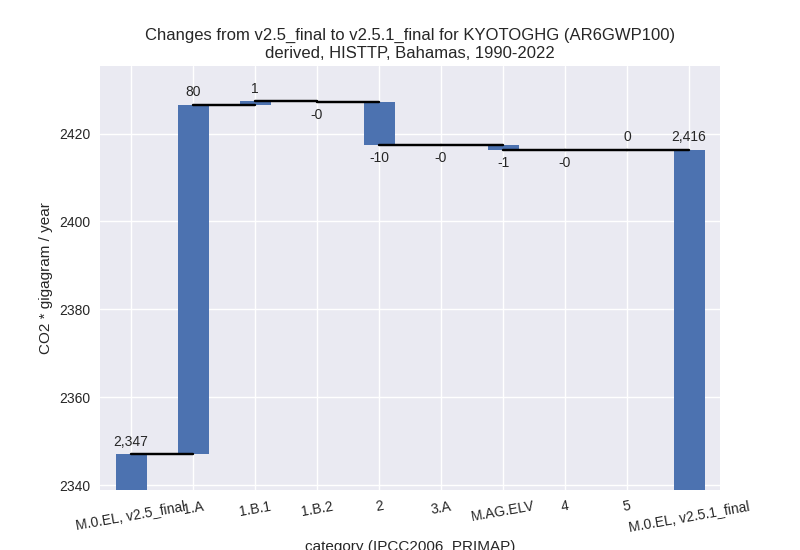
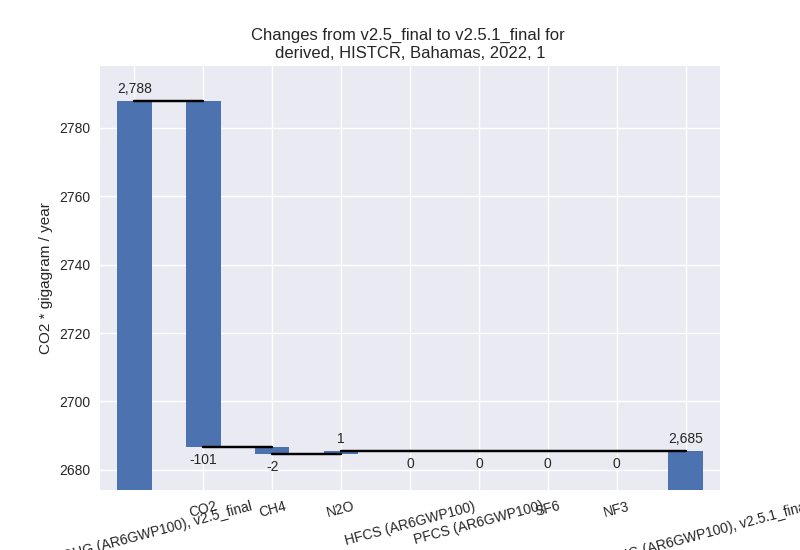
The following figures show the aggregate national total emissions excluding LULUCF AR6GWP100 for the country reported priority scenario. The dotted linesshow the v2.5_final data.


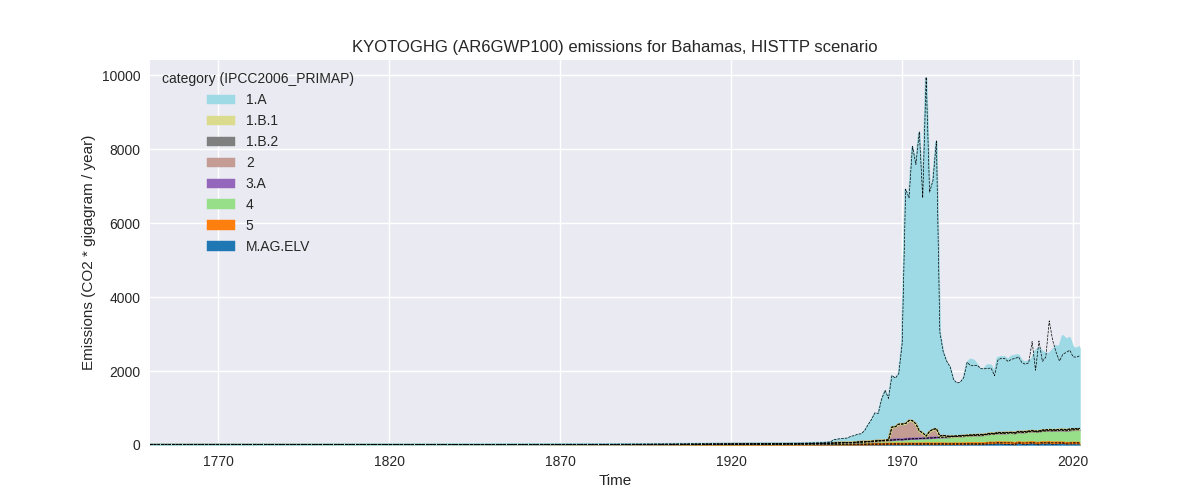
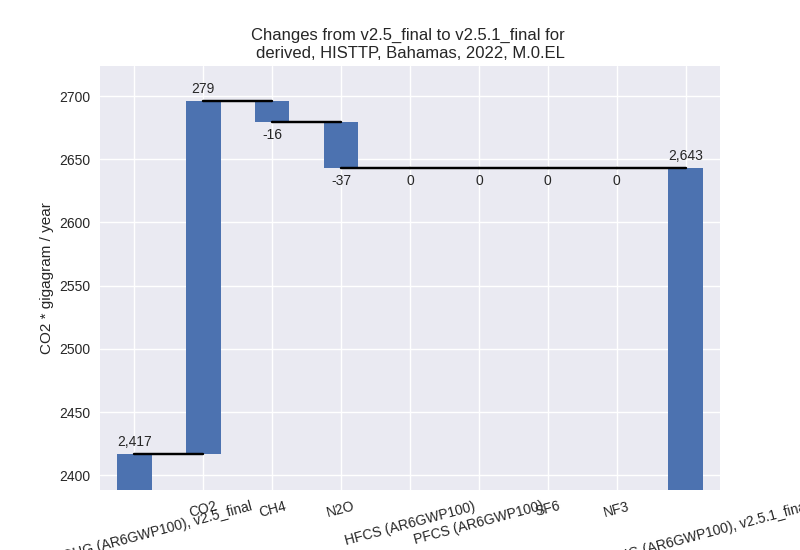
The following figures show the aggregate national total emissions excluding LULUCF AR6GWP100 for the third party priority scenario. The dotted linesshow the v2.5_final data.

Overview over changes
In the country reported priority scenario we have the following changes for aggregate Kyoto GHG and national total emissions excluding LULUCF (M.0.EL):
- Emissions in 2022 have changed by -3.7%% (-117.34 Gg CO2 / year)
- Emissions in 1990-2022 have changed by -0.4%% (-11.13 Gg CO2 / year)
In the third party priority scenario we have the following changes for aggregate Kyoto GHG and national total emissions excluding LULUCF (M.0.EL):
- Emissions in 2022 have changed by 9.4%% (226.08 Gg CO2 / year)
- Emissions in 1990-2022 have changed by 3.0%% (69.29 Gg CO2 / year)
Most important changes per scenario and time frame
In the country reported priority scenario the following sector-gas combinations have the highest absolute impact on national total KyotoGHG (AR6GWP100) emissions in 2022 (top 5):
- 1: 1.A, CO2 with -100.97 Gg CO2 / year (-3.7%)
- 2: 2, CO2 with -15.01 Gg CO2 / year (-66.4%)
- 3: 5, N2O with 4.97 Gg CO2 / year (16.7%)
- 4: 4, CH4 with -2.82 Gg CO2 / year (-0.9%)
- 5: 1.B.1, CH4 with -2.42 Gg CO2 / year (-22.4%)
In the country reported priority scenario the following sector-gas combinations have the highest absolute impact on national total KyotoGHG (AR6GWP100) emissions in 1990-2022 (top 5):
- 1: 2, CO2 with -9.75 Gg CO2 / year (-64.7%)
- 2: 1.A, CO2 with -4.93 Gg CO2 / year (-0.2%)
- 3: 1.A, N2O with 2.43 Gg CO2 / year (25.7%)
- 4: 1.A, CH4 with 0.86 Gg CO2 / year (9.9%)
- 5: 1.B.1, CH4 with 0.75 Gg CO2 / year (15.2%)
In the third party priority scenario the following sector-gas combinations have the highest absolute impact on national total KyotoGHG (AR6GWP100) emissions in 2022 (top 5):
- 1: 1.A, CO2 with 294.24 Gg CO2 / year (15.5%)
- 2: 1.A, N2O with -32.41 Gg CO2 / year (-79.3%)
- 3: 2, CO2 with -15.01 Gg CO2 / year (-66.4%)
- 4: 1.A, CH4 with -10.07 Gg CO2 / year (-58.2%)
- 5: M.AG.ELV, N2O with -9.73 Gg CO2 / year (-37.2%)
In the third party priority scenario the following sector-gas combinations have the highest absolute impact on national total KyotoGHG (AR6GWP100) emissions in 1990-2022 (top 5):
- 1: 1.A, CO2 with 108.38 Gg CO2 / year (5.6%)
- 2: 1.A, N2O with -21.15 Gg CO2 / year (-73.2%)
- 3: 2, CO2 with -9.75 Gg CO2 / year (-64.7%)
- 4: 1.A, CH4 with -7.69 Gg CO2 / year (-53.3%)
- 5: M.AG.ELV, N2O with -1.02 Gg CO2 / year (-5.5%)
Notes on data changes
Here we list notes explaining important emissions changes for the country. ’' means that the following text only applies to the TP time series, while means that it only applies to the CR scenario. Otherwise the note applies to both scenarios.
- 1.A, CO2: CDIAC 2023 differs from CDIAC 2020 after 1990 leading to higher 2022 and cumulative emissions in PIMAP-hist v2.5.1
- 1.A, CO2: The changes in 2022 and cumulative emissions come from the inclusion of updated CDIAC data which shows a different emissions profile than older CDIAC version. Overall emissions are similar, but the fluctuations are smaller.
Changes by sector and gas
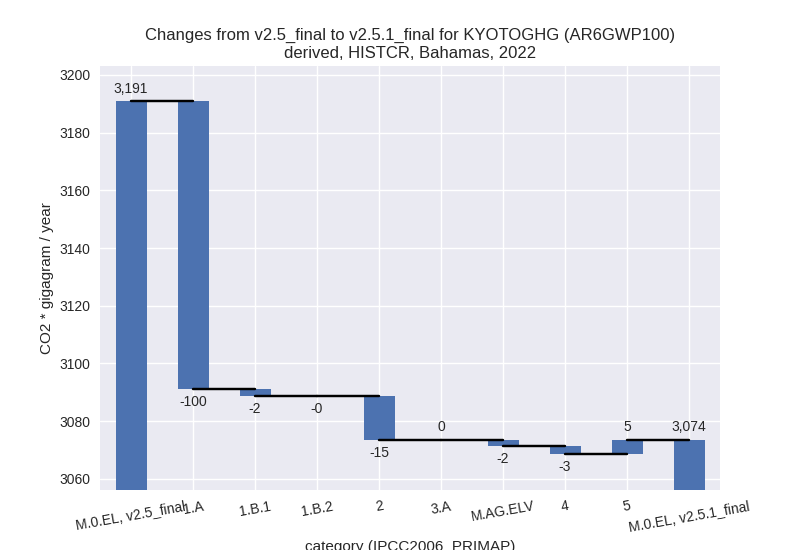
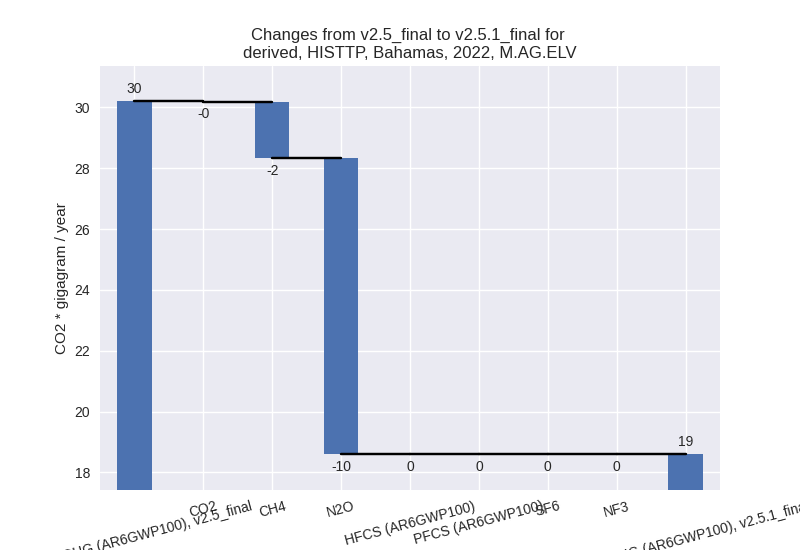
For each scenario and time frame the changes are displayed for all individual sectors and all individual gases. In the sector plot we use aggregate Kyoto GHGs in AR6GWP100. In the gas plot we usenational total emissions without LULUCF. ## country reported scenario
2022

1990-2022


third party scenario
2022

1990-2022

Detailed changes for the scenarios:
country reported scenario (HISTCR):
Most important changes per time frame
For 2022 the following sector-gas combinations have the highest absolute impact on national total KyotoGHG (AR6GWP100) emissions in 2022 (top 5):
- 1: 1.A, CO2 with -100.97 Gg CO2 / year (-3.7%)
- 2: 2, CO2 with -15.01 Gg CO2 / year (-66.4%)
- 3: 5, N2O with 4.97 Gg CO2 / year (16.7%)
- 4: 4, CH4 with -2.82 Gg CO2 / year (-0.9%)
- 5: 1.B.1, CH4 with -2.42 Gg CO2 / year (-22.4%)
For 1990-2022 the following sector-gas combinations have the highest absolute impact on national total KyotoGHG (AR6GWP100) emissions in 1990-2022 (top 5):
- 1: 2, CO2 with -9.75 Gg CO2 / year (-64.7%)
- 2: 1.A, CO2 with -4.93 Gg CO2 / year (-0.2%)
- 3: 1.A, N2O with 2.43 Gg CO2 / year (25.7%)
- 4: 1.A, CH4 with 0.86 Gg CO2 / year (9.9%)
- 5: 1.B.1, CH4 with 0.75 Gg CO2 / year (15.2%)
Changes in the main sectors for aggregate KyotoGHG (AR6GWP100) are
- 1: Total sectoral emissions in 2022 are 2685.44 Gg
CO2 / year which is 87.4% of M.0.EL emissions. 2022 Emissions have
changed by -3.7% (-102.25 Gg CO2 /
year). 1990-2022 Emissions have changed by -0.0% (-1.09 Gg CO2 / year). For 2022 the
changes per gas
are:
The changes come from the following subsectors:- 1.A: Total sectoral emissions in 2022 are 2676.87
Gg CO2 / year which is 99.7% of category 1 emissions. 2022 Emissions
have changed by -3.6% (-99.69 Gg CO2
/ year). 1990-2022 Emissions have changed by -0.1% (-1.65 Gg CO2 / year). For 2022 the
changes per gas
are:

There is no subsector information available in PRIMAP-hist. - 1.B.1: Total sectoral emissions in 2022 are 8.49 Gg
CO2 / year which is 0.3% of category 1 emissions. 2022 Emissions have
changed by -22.4% (-2.45 Gg CO2 /
year). 1990-2022 Emissions have changed by 15.2% (0.76 Gg CO2 / year). For 2022 the
changes per gas
are:

For 1990-2022 the changes per gas are:
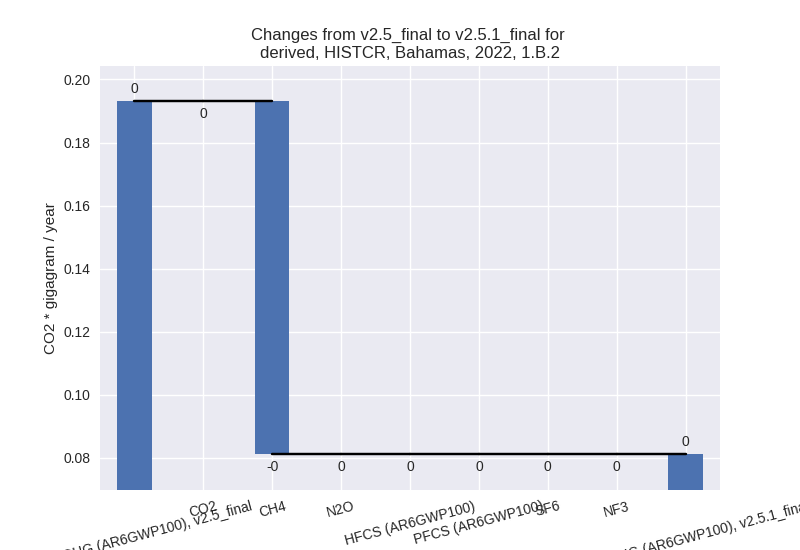
There is no subsector information available in PRIMAP-hist. - 1.B.2: Total sectoral emissions in 2022 are 0.08 Gg
CO2 / year which is 0.0% of category 1 emissions. 2022 Emissions have
changed by -58.0% (-0.11 Gg CO2 /
year). 1990-2022 Emissions have changed by -58.8% (-0.20 Gg CO2 / year). For 2022 the
changes per gas
are:
For 1990-2022 the changes per gas are:
There is no subsector information available in PRIMAP-hist.
- 1.A: Total sectoral emissions in 2022 are 2676.87
Gg CO2 / year which is 99.7% of category 1 emissions. 2022 Emissions
have changed by -3.6% (-99.69 Gg CO2
/ year). 1990-2022 Emissions have changed by -0.1% (-1.65 Gg CO2 / year). For 2022 the
changes per gas
are:
- 2: Total sectoral emissions in 2022 are 7.60 Gg CO2
/ year which is 0.2% of M.0.EL emissions. 2022 Emissions have changed by
-66.4% (-15.01 Gg CO2 / year).
1990-2022 Emissions have changed by -64.7% (-9.75 Gg CO2 / year). For 2022 the
changes per gas
are:

For 1990-2022 the changes per gas are:
- M.AG: Total sectoral emissions in 2022 are 11.67 Gg
CO2 / year which is 0.4% of M.0.EL emissions. 2022 Emissions have
changed by -15.6% (-2.16 Gg CO2 /
year). 1990-2022 Emissions have changed by -2.5% (-0.36 Gg CO2 / year). For 2022 the
changes per gas
are:

For 1990-2022 the changes per gas are: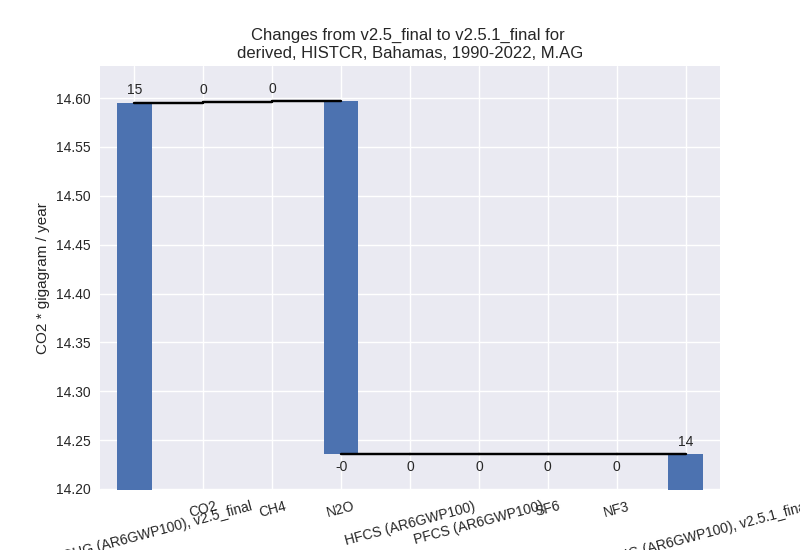
The changes come from the following subsectors:- 3.A: Total sectoral emissions in 2022 are 4.13 Gg CO2 / year which is 35.4% of category M.AG emissions. 2022 Emissions have changed by 0.4% (0.01 Gg CO2 / year). 1990-2022 Emissions have changed by 0.0% (0.00 Gg CO2 / year).
- M.AG.ELV: Total sectoral emissions in 2022 are 7.53
Gg CO2 / year which is 64.6% of category M.AG emissions. 2022 Emissions
have changed by -22.4% (-2.18 Gg CO2
/ year). 1990-2022 Emissions have changed by -3.4% (-0.36 Gg CO2 / year). For 2022 the
changes per gas
are:

For 1990-2022 the changes per gas are:
There is no subsector information available in PRIMAP-hist.
- 4: Total sectoral emissions in 2022 are 334.20 Gg CO2 / year which is 10.9% of M.0.EL emissions. 2022 Emissions have changed by -0.9% (-2.89 Gg CO2 / year). 1990-2022 Emissions have changed by -0.0% (-0.09 Gg CO2 / year).
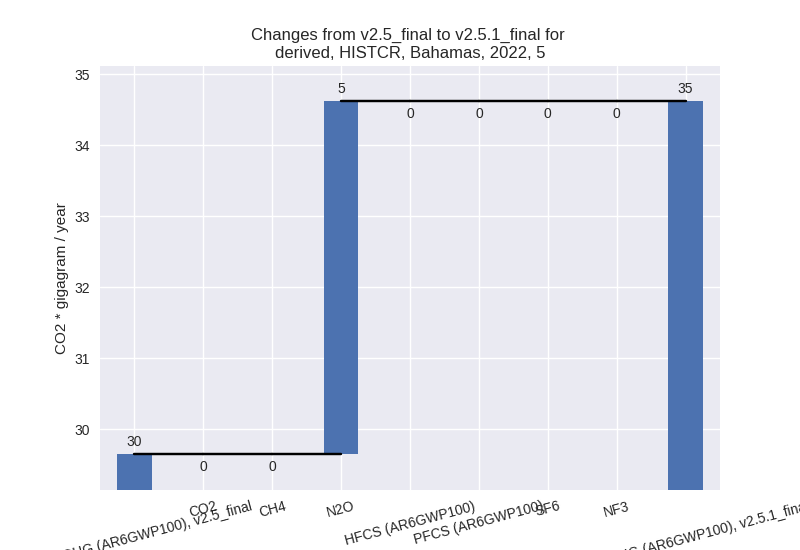
- 5: Total sectoral emissions in 2022 are 34.62 Gg
CO2 / year which is 1.1% of M.0.EL emissions. 2022 Emissions have
changed by 16.7% (4.97 Gg CO2 /
year). 1990-2022 Emissions have changed by 0.4% (0.15 Gg CO2 / year). For 2022 the
changes per gas
are:
third party scenario (HISTTP):
Most important changes per time frame
For 2022 the following sector-gas combinations have the highest absolute impact on national total KyotoGHG (AR6GWP100) emissions in 2022 (top 5):
- 1: 1.A, CO2 with 294.24 Gg CO2 / year (15.5%)
- 2: 1.A, N2O with -32.41 Gg CO2 / year (-79.3%)
- 3: 2, CO2 with -15.01 Gg CO2 / year (-66.4%)
- 4: 1.A, CH4 with -10.07 Gg CO2 / year (-58.2%)
- 5: M.AG.ELV, N2O with -9.73 Gg CO2 / year (-37.2%)
For 1990-2022 the following sector-gas combinations have the highest absolute impact on national total KyotoGHG (AR6GWP100) emissions in 1990-2022 (top 5):
- 1: 1.A, CO2 with 108.38 Gg CO2 / year (5.6%)
- 2: 1.A, N2O with -21.15 Gg CO2 / year (-73.2%)
- 3: 2, CO2 with -9.75 Gg CO2 / year (-64.7%)
- 4: 1.A, CH4 with -7.69 Gg CO2 / year (-53.3%)
- 5: M.AG.ELV, N2O with -1.02 Gg CO2 / year (-5.5%)
Changes in the main sectors for aggregate KyotoGHG (AR6GWP100) are
- 1: Total sectoral emissions in 2022 are 2222.99 Gg
CO2 / year which is 84.1% of M.0.EL emissions. 2022 Emissions have
changed by 12.6% (249.19 Gg CO2 /
year). 1990-2022 Emissions have changed by 4.0% (80.10 Gg CO2 / year). For 2022 the
changes per gas
are:
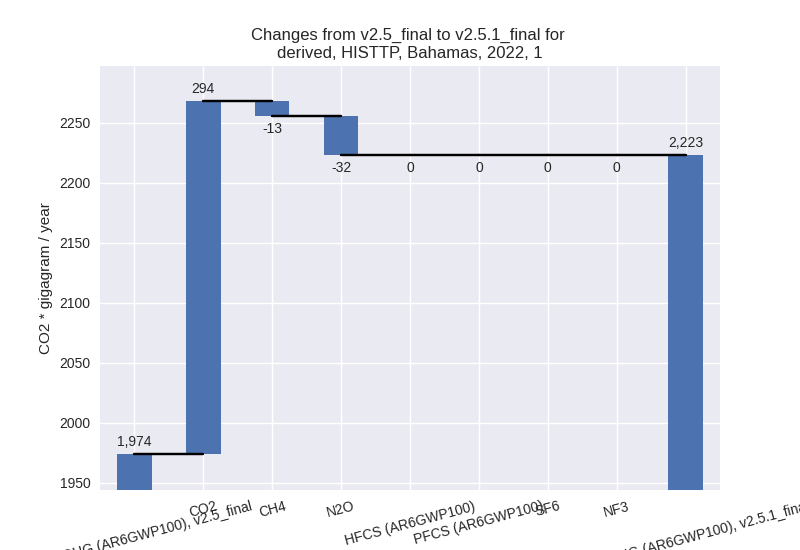
For 1990-2022 the changes per gas are:
The changes come from the following subsectors:- 1.A: Total sectoral emissions in 2022 are 2214.44
Gg CO2 / year which is 99.6% of category 1 emissions. 2022 Emissions
have changed by 12.8% (251.76 Gg CO2
/ year). 1990-2022 Emissions have changed by 4.0% (79.54 Gg CO2 / year). For 2022 the
changes per gas
are:
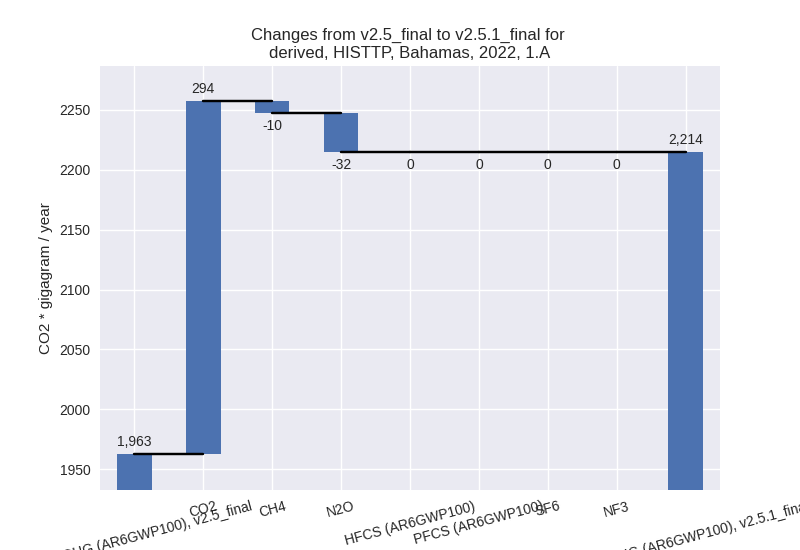
For 1990-2022 the changes per gas are: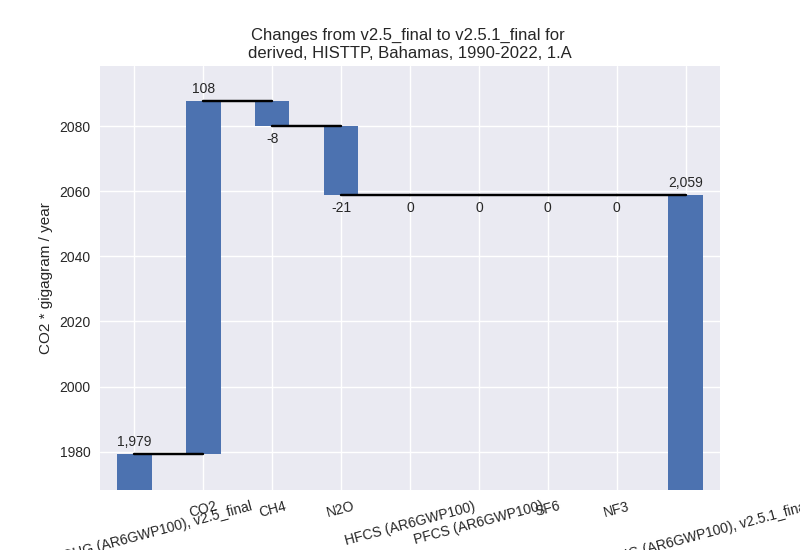
There is no subsector information available in PRIMAP-hist. - 1.B.1: Total sectoral emissions in 2022 are 8.49 Gg
CO2 / year which is 0.4% of category 1 emissions. 2022 Emissions have
changed by -22.4% (-2.45 Gg CO2 /
year). 1990-2022 Emissions have changed by 15.2% (0.76 Gg CO2 / year). For 2022 the
changes per gas
are:
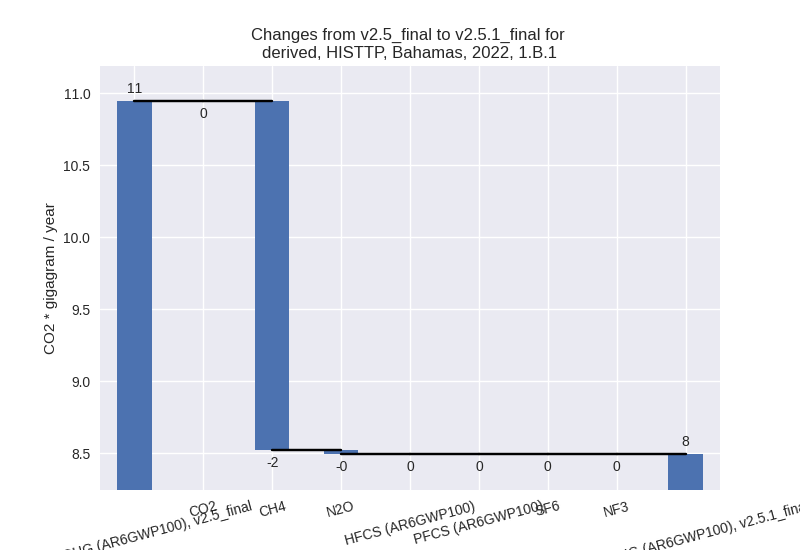
For 1990-2022 the changes per gas are: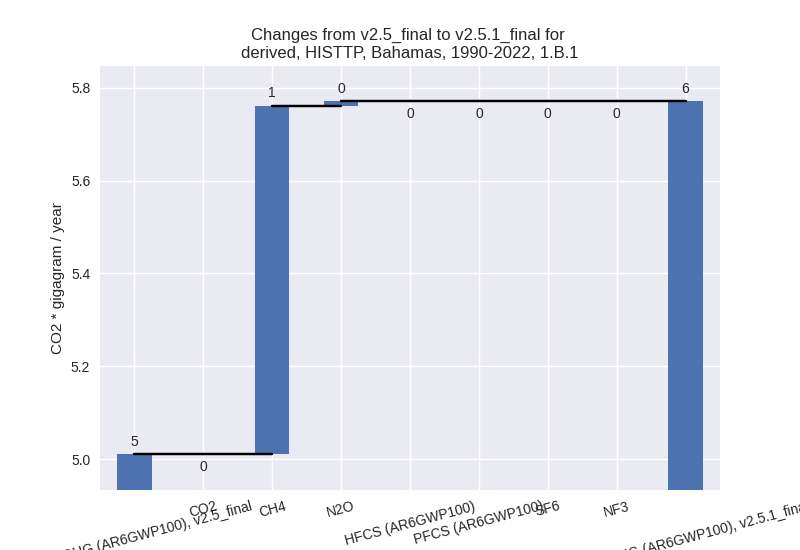
There is no subsector information available in PRIMAP-hist. - 1.B.2: Total sectoral emissions in 2022 are 0.06 Gg
CO2 / year which is 0.0% of category 1 emissions. 2022 Emissions have
changed by -64.3% (-0.11 Gg CO2 /
year). 1990-2022 Emissions have changed by -61.8% (-0.20 Gg CO2 / year). For 2022 the
changes per gas
are:

For 1990-2022 the changes per gas are:
There is no subsector information available in PRIMAP-hist.
- 1.A: Total sectoral emissions in 2022 are 2214.44
Gg CO2 / year which is 99.6% of category 1 emissions. 2022 Emissions
have changed by 12.8% (251.76 Gg CO2
/ year). 1990-2022 Emissions have changed by 4.0% (79.54 Gg CO2 / year). For 2022 the
changes per gas
are:
- 2: Total sectoral emissions in 2022 are 7.60 Gg CO2
/ year which is 0.3% of M.0.EL emissions. 2022 Emissions have changed by
-66.4% (-15.01 Gg CO2 / year).
1990-2022 Emissions have changed by -64.7% (-9.75 Gg CO2 / year). For 2022 the
changes per gas
are:
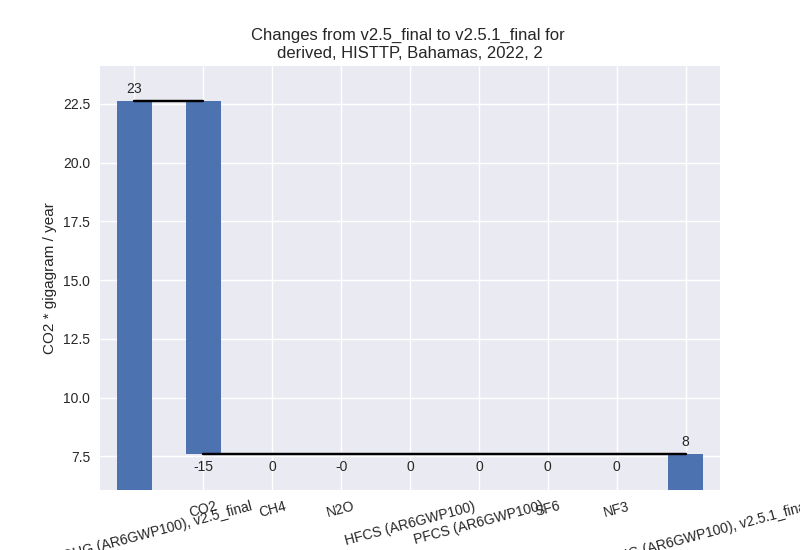
For 1990-2022 the changes per gas are:
- M.AG: Total sectoral emissions in 2022 are 27.21 Gg
CO2 / year which is 1.0% of M.0.EL emissions. 2022 Emissions have
changed by -29.9% (-11.63 Gg CO2 /
year). 1990-2022 Emissions have changed by -3.6% (-1.17 Gg CO2 / year). For 2022 the
changes per gas
are:

For 1990-2022 the changes per gas are: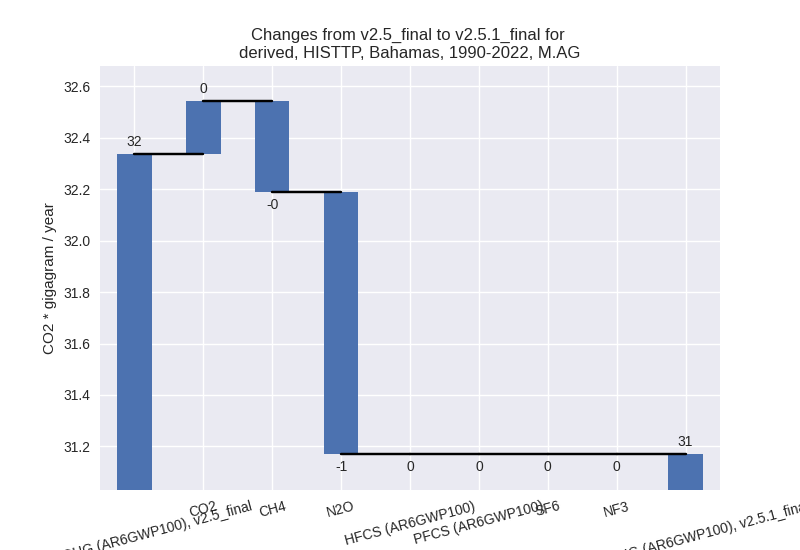
The changes come from the following subsectors:- 3.A: Total sectoral emissions in 2022 are 8.61 Gg CO2 / year which is 31.7% of category M.AG emissions. 2022 Emissions have changed by -0.3% (-0.03 Gg CO2 / year). 1990-2022 Emissions have changed by -0.1% (-0.01 Gg CO2 / year).
- M.AG.ELV: Total sectoral emissions in 2022 are
18.60 Gg CO2 / year which is 68.3% of category M.AG emissions. 2022
Emissions have changed by -38.4%
(-11.60 Gg CO2 / year). 1990-2022 Emissions have changed by -4.8% (-1.16 Gg CO2 / year). For 2022 the
changes per gas
are:
For 1990-2022 the changes per gas are:
There is no subsector information available in PRIMAP-hist.
- 4: Total sectoral emissions in 2022 are 350.31 Gg CO2 / year which is 13.3% of M.0.EL emissions. 2022 Emissions have changed by -0.4% (-1.44 Gg CO2 / year). 1990-2022 Emissions have changed by -0.0% (-0.04 Gg CO2 / year).
- 5: Total sectoral emissions in 2022 are 34.62 Gg
CO2 / year which is 1.3% of M.0.EL emissions. 2022 Emissions have
changed by 16.7% (4.97 Gg CO2 /
year). 1990-2022 Emissions have changed by 0.4% (0.15 Gg CO2 / year). For 2022 the
changes per gas
are:
