Changes in PRIMAP-hist v2.5.1_final compared to v2.5_final for Belarus
2024-02-29
Johannes Gütschow
Change analysis for Belarus for PRIMAP-hist v2.5.1_final compared to v2.5_final
Overview over emissions by sector and gas
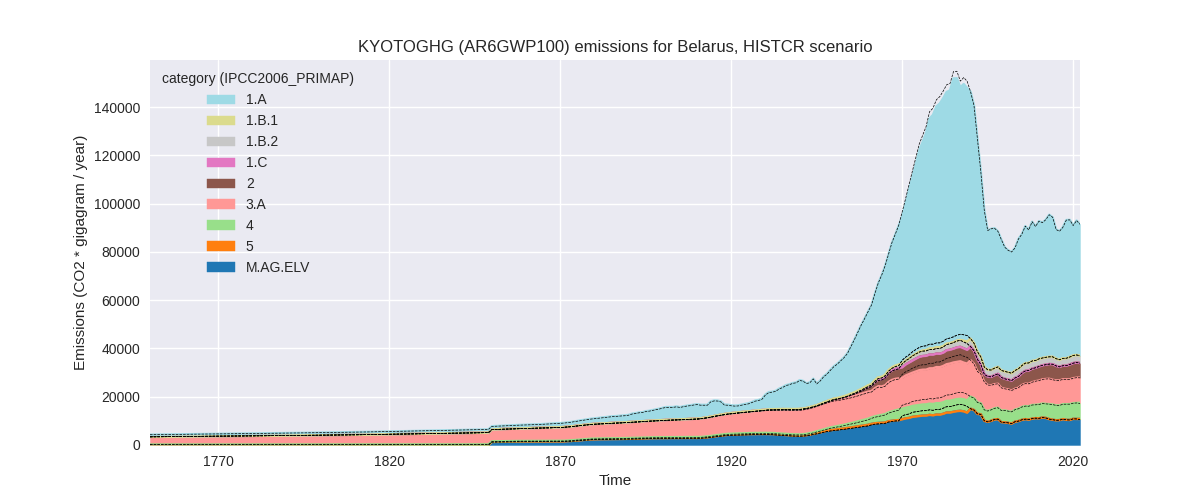
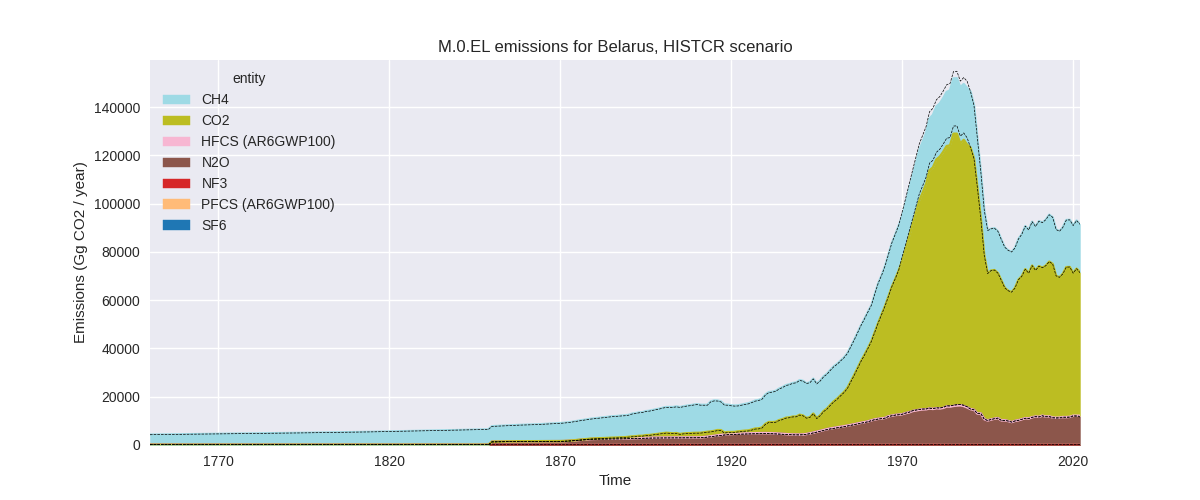
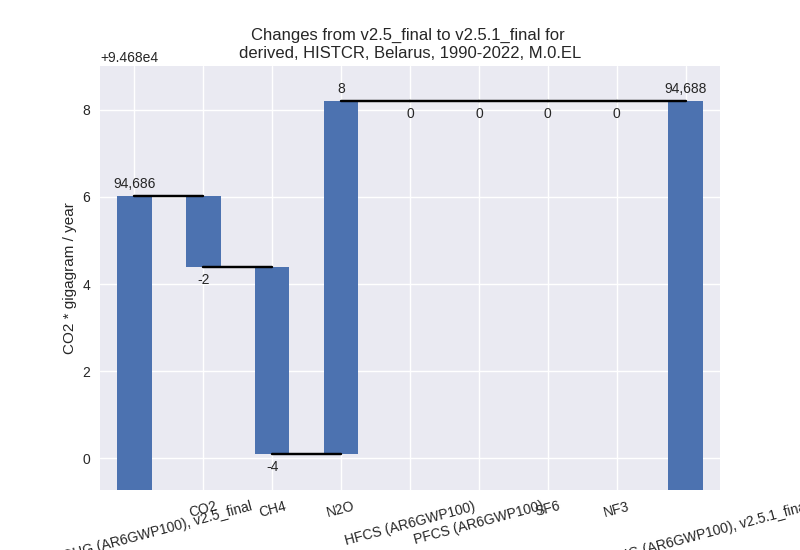
The following figures show the aggregate national total emissions excluding LULUCF AR6GWP100 for the country reported priority scenario. The dotted linesshow the v2.5_final data.

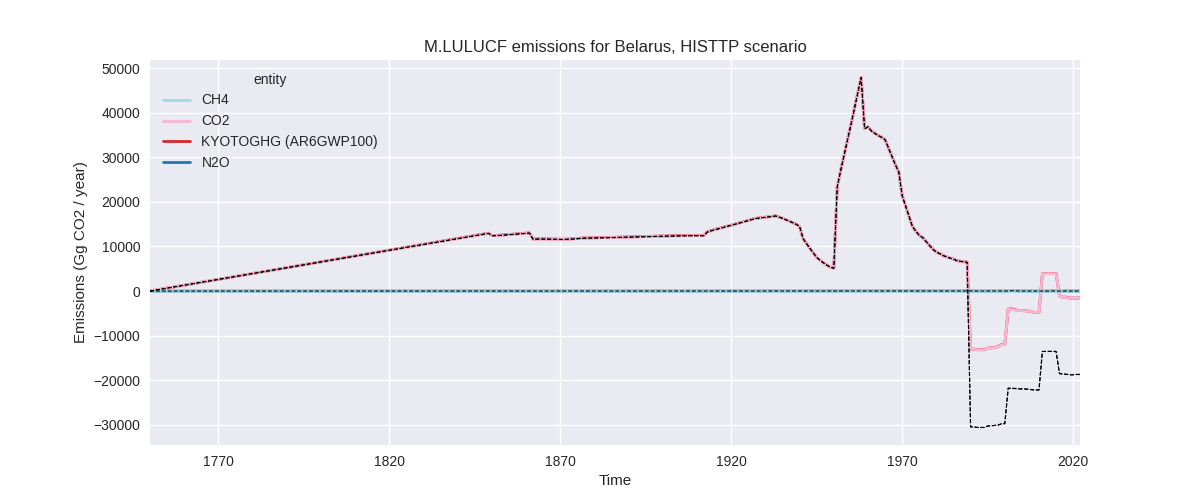
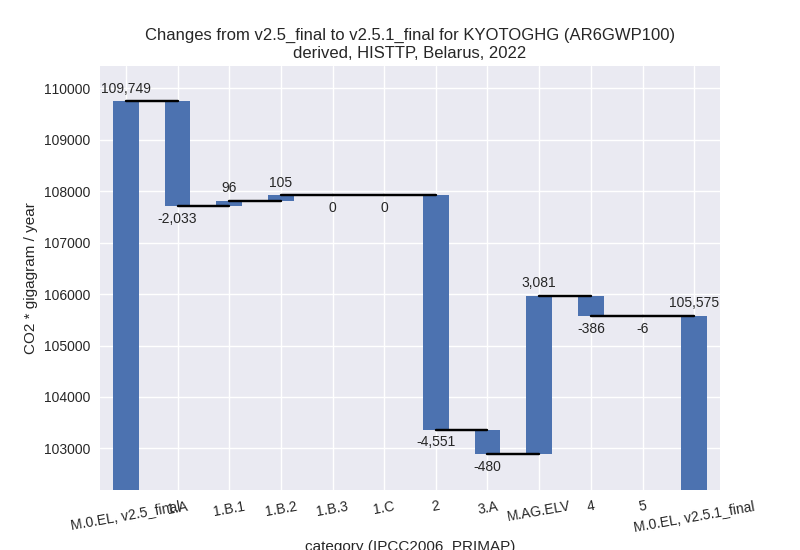
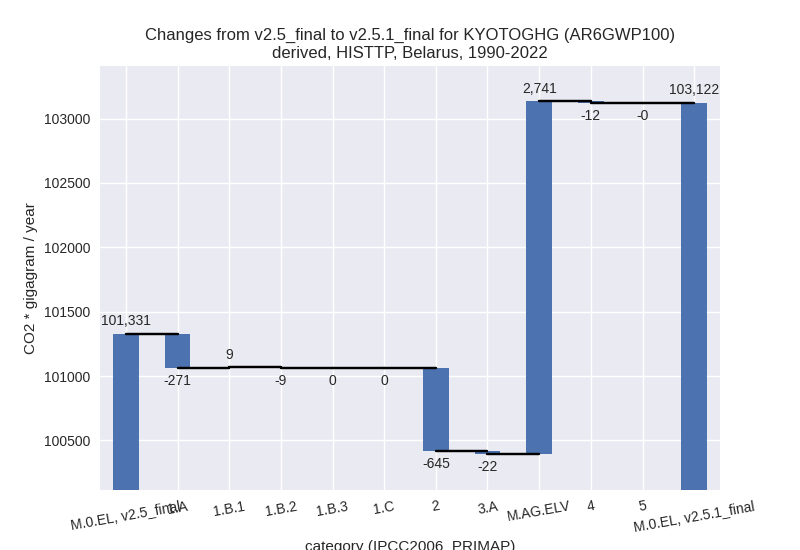
The following figures show the aggregate national total emissions excluding LULUCF AR6GWP100 for the third party priority scenario. The dotted linesshow the v2.5_final data.


Overview over changes
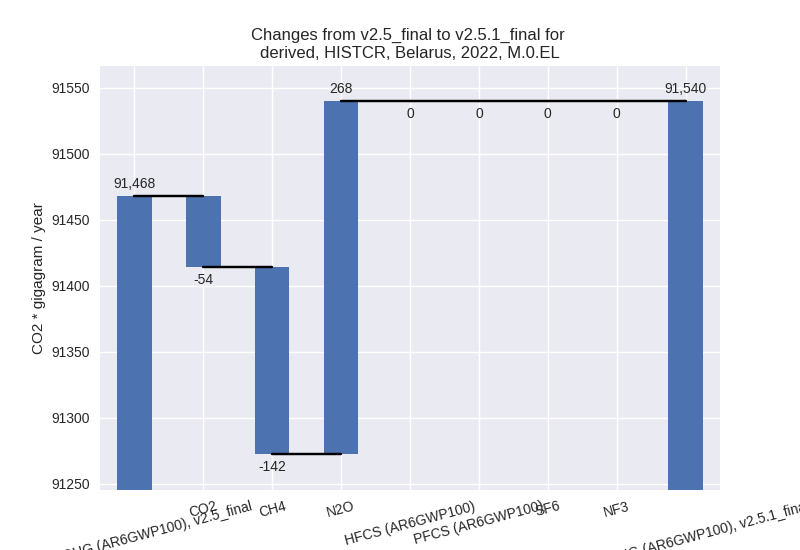
In the country reported priority scenario we have the following changes for aggregate Kyoto GHG and national total emissions excluding LULUCF (M.0.EL):
- Emissions in 2022 have changed by 0.1%% (71.93 Gg CO2 / year)
- Emissions in 1990-2022 have changed by 0.0%% (2.18 Gg CO2 / year)
In the third party priority scenario we have the following changes for aggregate Kyoto GHG and national total emissions excluding LULUCF (M.0.EL):
- Emissions in 2022 have changed by -3.8%% (-4174.20 Gg CO2 / year)
- Emissions in 1990-2022 have changed by 1.8%% (1791.72 Gg CO2 / year)
Most important changes per scenario and time frame
In the country reported priority scenario the following sector-gas combinations have the highest absolute impact on national total KyotoGHG (AR6GWP100) emissions in 2022 (top 5):
- 1: M.AG.ELV, N2O with 270.18 Gg CO2 / year (2.8%)
- 2: 3.A, CH4 with -170.20 Gg CO2 / year (-1.7%)
- 3: 2, CO2 with -74.07 Gg CO2 / year (-1.5%)
- 4: 1.A, CH4 with 61.60 Gg CO2 / year (21.8%)
- 5: M.AG.ELV, CO2 with 45.59 Gg CO2 / year (5.3%)
In the country reported priority scenario the following sector-gas combinations have the highest absolute impact on national total KyotoGHG (AR6GWP100) emissions in 1990-2022 (top 5):
- 1: M.AG.ELV, N2O with 8.19 Gg CO2 / year (0.1%)
- 2: 3.A, CH4 with -5.16 Gg CO2 / year (-0.1%)
- 3: 2, CO2 with -2.24 Gg CO2 / year (-0.1%)
- 4: 1.A, CH4 with 1.87 Gg CO2 / year (0.5%)
- 5: M.AG.ELV, CO2 with 1.38 Gg CO2 / year (0.1%)
In the third party priority scenario the following sector-gas combinations have the highest absolute impact on national total KyotoGHG (AR6GWP100) emissions in 2022 (top 5):
- 1: 2, N2O with -3191.23 Gg CO2 / year (-18.0%)
- 2: M.AG.ELV, N2O with 3071.81 Gg CO2 / year (32.2%)
- 3: 1.A, CO2 with -2067.24 Gg CO2 / year (-3.6%)
- 4: 2, CO2 with -1359.89 Gg CO2 / year (-24.9%)
- 5: 3.A, CH4 with -431.43 Gg CO2 / year (-4.1%)
In the third party priority scenario the following sector-gas combinations have the highest absolute impact on national total KyotoGHG (AR6GWP100) emissions in 1990-2022 (top 5):
- 1: M.AG.ELV, N2O with 3024.34 Gg CO2 / year (30.7%)
- 2: 2, CO2 with -728.87 Gg CO2 / year (-15.8%)
- 3: M.AG.ELV, CO2 with -282.85 Gg CO2 / year (-26.0%)
- 4: 1.A, CO2 with -274.20 Gg CO2 / year (-0.4%)
- 5: 2, N2O with 84.20 Gg CO2 / year (1.5%)
Notes on data changes
No country specific notes present for this changelog.
Changes by sector and gas
For each scenario and time frame the changes are displayed for all individual sectors and all individual gases. In the sector plot we use aggregate Kyoto GHGs in AR6GWP100. In the gas plot we usenational total emissions without LULUCF. ## country reported scenario
2022

1990-2022

third party scenario
2022

1990-2022

Detailed changes for the scenarios:
country reported scenario (HISTCR):
Most important changes per time frame
For 2022 the following sector-gas combinations have the highest absolute impact on national total KyotoGHG (AR6GWP100) emissions in 2022 (top 5):
- 1: M.AG.ELV, N2O with 270.18 Gg CO2 / year (2.8%)
- 2: 3.A, CH4 with -170.20 Gg CO2 / year (-1.7%)
- 3: 2, CO2 with -74.07 Gg CO2 / year (-1.5%)
- 4: 1.A, CH4 with 61.60 Gg CO2 / year (21.8%)
- 5: M.AG.ELV, CO2 with 45.59 Gg CO2 / year (5.3%)
For 1990-2022 the following sector-gas combinations have the highest absolute impact on national total KyotoGHG (AR6GWP100) emissions in 1990-2022 (top 5):
- 1: M.AG.ELV, N2O with 8.19 Gg CO2 / year (0.1%)
- 2: 3.A, CH4 with -5.16 Gg CO2 / year (-0.1%)
- 3: 2, CO2 with -2.24 Gg CO2 / year (-0.1%)
- 4: 1.A, CH4 with 1.87 Gg CO2 / year (0.5%)
- 5: M.AG.ELV, CO2 with 1.38 Gg CO2 / year (0.1%)
Changes in the main sectors for aggregate KyotoGHG (AR6GWP100) are
- 1: Total sectoral emissions in 2022 are 57586.94 Gg CO2 / year which is 62.9% of M.0.EL emissions. 2022 Emissions have changed by 0.1% (48.30 Gg CO2 / year). 1990-2022 Emissions have changed by 0.0% (1.46 Gg CO2 / year).
- 2: Total sectoral emissions in 2022 are 6012.11 Gg CO2 / year which is 6.6% of M.0.EL emissions. 2022 Emissions have changed by -1.0% (-61.67 Gg CO2 / year). 1990-2022 Emissions have changed by -0.0% (-1.87 Gg CO2 / year).
- M.AG: Total sectoral emissions in 2022 are 21265.80 Gg CO2 / year which is 23.2% of M.0.EL emissions. 2022 Emissions have changed by 0.6% (116.53 Gg CO2 / year). 1990-2022 Emissions have changed by 0.0% (3.53 Gg CO2 / year).
- 4: Total sectoral emissions in 2022 are 6675.07 Gg CO2 / year which is 7.3% of M.0.EL emissions. 2022 Emissions have changed by -0.5% (-31.23 Gg CO2 / year). 1990-2022 Emissions have changed by -0.0% (-0.95 Gg CO2 / year).
- 5: No data
third party scenario (HISTTP):
Most important changes per time frame
For 2022 the following sector-gas combinations have the highest absolute impact on national total KyotoGHG (AR6GWP100) emissions in 2022 (top 5):
- 1: 2, N2O with -3191.23 Gg CO2 / year (-18.0%)
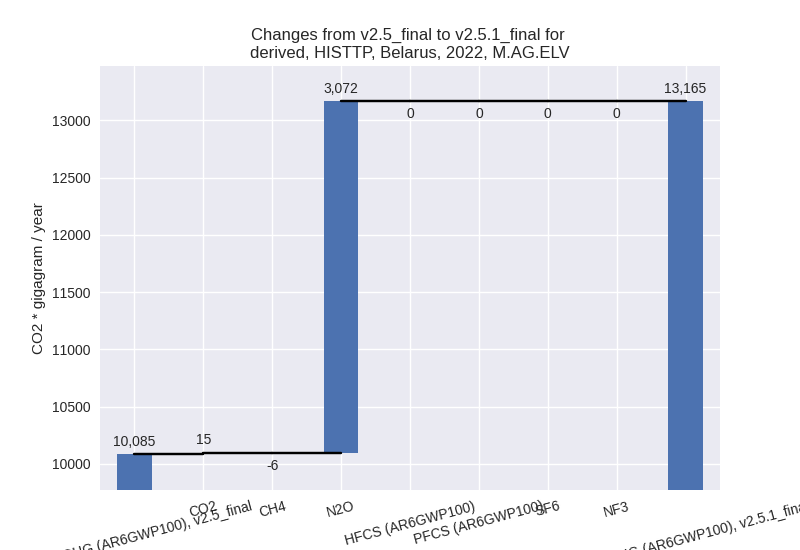
- 2: M.AG.ELV, N2O with 3071.81 Gg CO2 / year (32.2%)
- 3: 1.A, CO2 with -2067.24 Gg CO2 / year (-3.6%)
- 4: 2, CO2 with -1359.89 Gg CO2 / year (-24.9%)
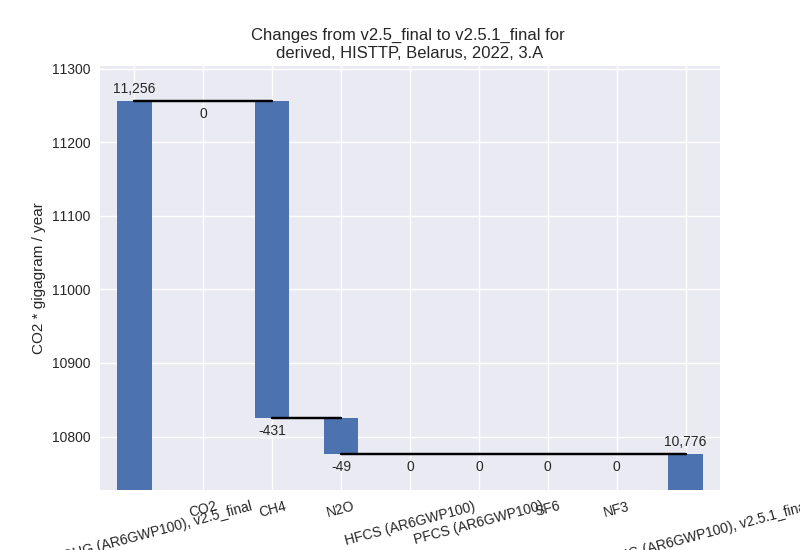
- 5: 3.A, CH4 with -431.43 Gg CO2 / year (-4.1%)
For 1990-2022 the following sector-gas combinations have the highest absolute impact on national total KyotoGHG (AR6GWP100) emissions in 1990-2022 (top 5):
- 1: M.AG.ELV, N2O with 3024.34 Gg CO2 / year (30.7%)
- 2: 2, CO2 with -728.87 Gg CO2 / year (-15.8%)
- 3: M.AG.ELV, CO2 with -282.85 Gg CO2 / year (-26.0%)
- 4: 1.A, CO2 with -274.20 Gg CO2 / year (-0.4%)
- 5: 2, N2O with 84.20 Gg CO2 / year (1.5%)
Changes in the main sectors for aggregate KyotoGHG (AR6GWP100) are
- 1: Total sectoral emissions in 2022 are 56685.15 Gg
CO2 / year which is 53.7% of M.0.EL emissions. 2022 Emissions have
changed by -3.1% (-1831.95 Gg CO2 /
year). 1990-2022 Emissions have changed by -0.4% (-271.12 Gg CO2 / year). For 2022
the changes per gas
are:
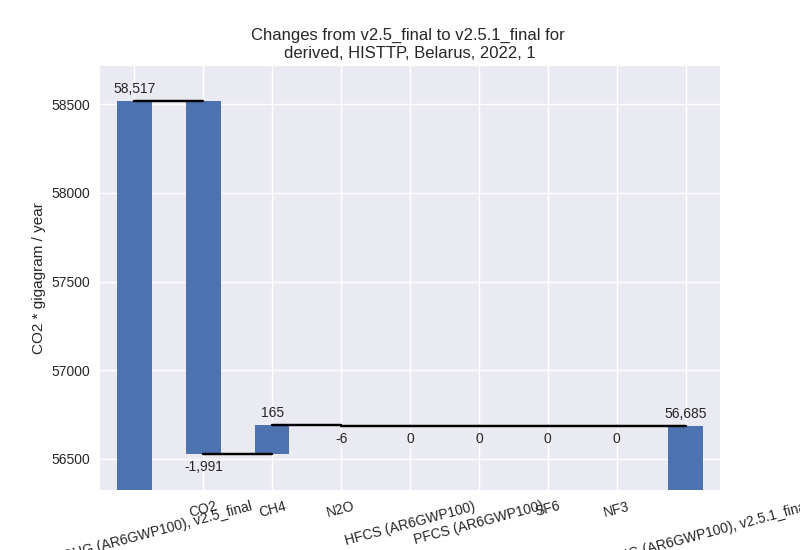
The changes come from the following subsectors:- 1.A: Total sectoral emissions in 2022 are 55999.84
Gg CO2 / year which is 98.8% of category 1 emissions. 2022 Emissions
have changed by -3.5% (-2033.15 Gg
CO2 / year). 1990-2022 Emissions have changed by -0.4% (-271.13 Gg CO2 / year). For 2022
the changes per gas
are:

There is no subsector information available in PRIMAP-hist. - 1.B.1: Total sectoral emissions in 2022 are 258.54
Gg CO2 / year which is 0.5% of category 1 emissions. 2022 Emissions have
changed by 58.8% (95.74 Gg CO2 /
year). 1990-2022 Emissions have changed by 4.2% (8.64 Gg CO2 / year). For 2022 the
changes per gas
are:
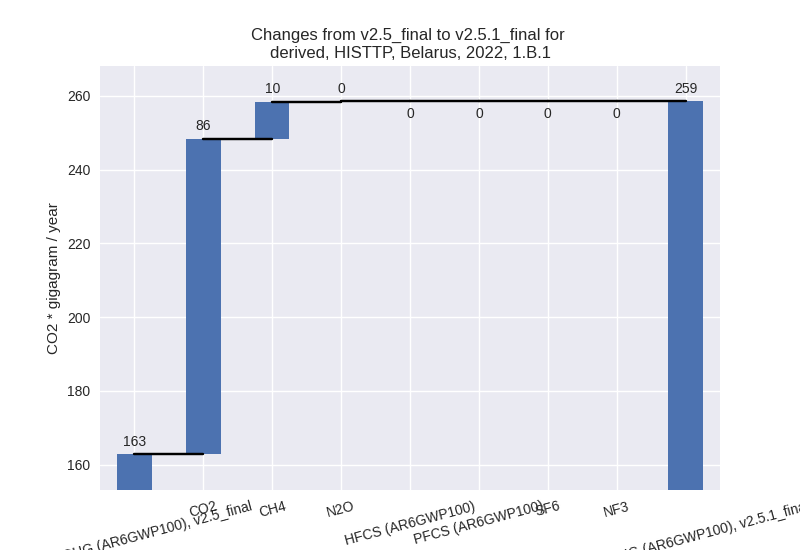
For 1990-2022 the changes per gas are:
There is no subsector information available in PRIMAP-hist. - 1.B.2: Total sectoral emissions in 2022 are 426.78
Gg CO2 / year which is 0.8% of category 1 emissions. 2022 Emissions have
changed by 32.8% (105.46 Gg CO2 /
year). 1990-2022 Emissions have changed by -1.8% (-8.62 Gg CO2 / year). For 2022 the
changes per gas
are:
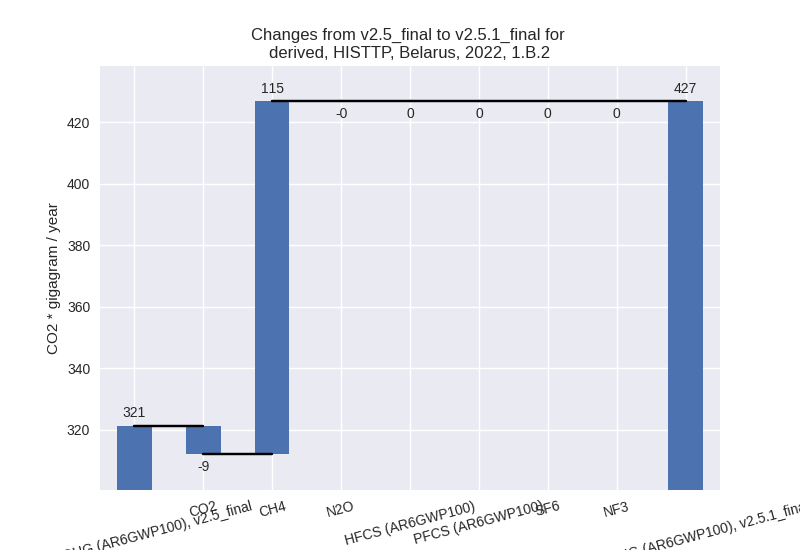
There is no subsector information available in PRIMAP-hist.
- 1.A: Total sectoral emissions in 2022 are 55999.84
Gg CO2 / year which is 98.8% of category 1 emissions. 2022 Emissions
have changed by -3.5% (-2033.15 Gg
CO2 / year). 1990-2022 Emissions have changed by -0.4% (-271.13 Gg CO2 / year). For 2022
the changes per gas
are:
- 2: Total sectoral emissions in 2022 are 18951.82 Gg
CO2 / year which is 18.0% of M.0.EL emissions. 2022 Emissions have
changed by -19.4% (-4551.24 Gg CO2 /
year). 1990-2022 Emissions have changed by -6.3% (-644.67 Gg CO2 / year). For 2022
the changes per gas
are:

For 1990-2022 the changes per gas are: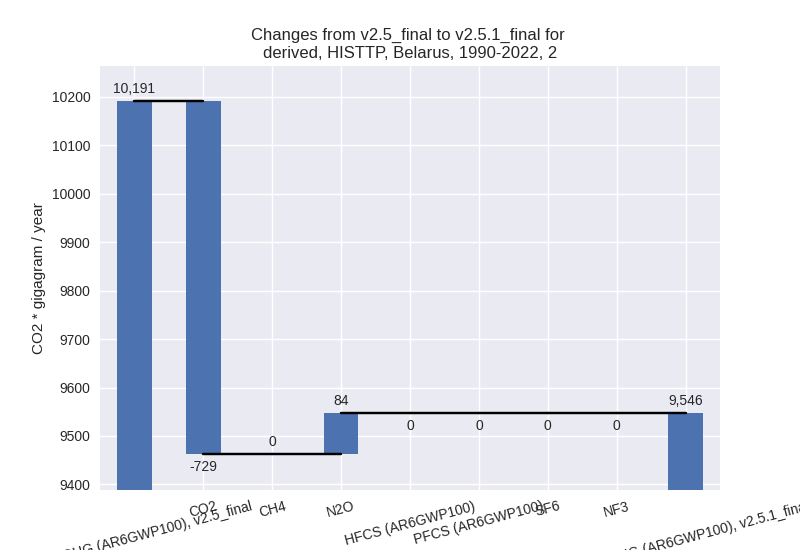
- M.AG: Total sectoral emissions in 2022 are 23941.43
Gg CO2 / year which is 22.7% of M.0.EL emissions. 2022 Emissions have
changed by 12.2% (2600.90 Gg CO2 /
year). 1990-2022 Emissions have changed by 11.7% (2719.41 Gg CO2 / year). For 2022
the changes per gas
are:

For 1990-2022 the changes per gas are: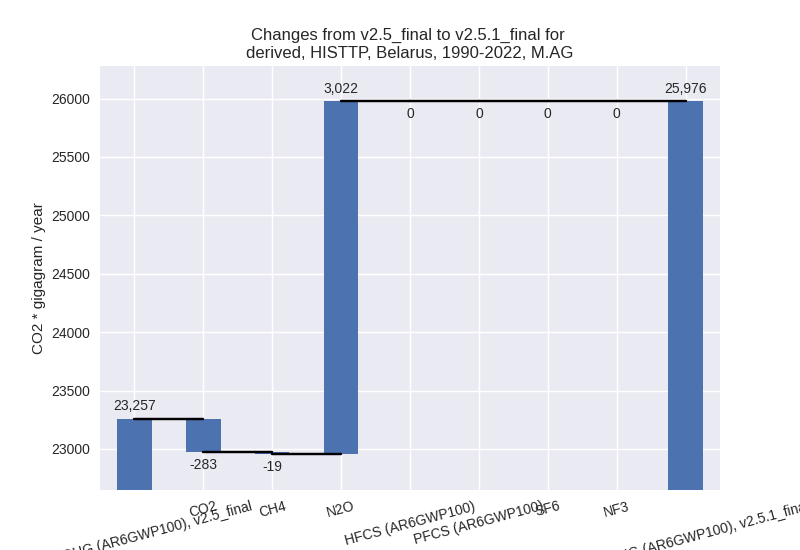
The changes come from the following subsectors:- 3.A: Total sectoral emissions in 2022 are 10775.94
Gg CO2 / year which is 45.0% of category M.AG emissions. 2022 Emissions
have changed by -4.3% (-480.01 Gg
CO2 / year). 1990-2022 Emissions have changed by -0.2% (-21.63 Gg CO2 / year). For 2022 the
changes per gas
are:
There is no subsector information available in PRIMAP-hist. - M.AG.ELV: Total sectoral emissions in 2022 are
13165.50 Gg CO2 / year which is 55.0% of category M.AG emissions. 2022
Emissions have changed by 30.6%
(3080.91 Gg CO2 / year). 1990-2022 Emissions have changed by 25.0% (2741.05 Gg CO2 / year). For 2022
the changes per gas
are:
For 1990-2022 the changes per gas are:
There is no subsector information available in PRIMAP-hist.
- 3.A: Total sectoral emissions in 2022 are 10775.94
Gg CO2 / year which is 45.0% of category M.AG emissions. 2022 Emissions
have changed by -4.3% (-480.01 Gg
CO2 / year). 1990-2022 Emissions have changed by -0.2% (-21.63 Gg CO2 / year). For 2022 the
changes per gas
are:
- 4: Total sectoral emissions in 2022 are 5760.76 Gg
CO2 / year which is 5.5% of M.0.EL emissions. 2022 Emissions have
changed by -6.3% (-385.94 Gg CO2 /
year). 1990-2022 Emissions have changed by -0.3% (-11.73 Gg CO2 / year). For 2022 the
changes per gas
are:

- 5: Total sectoral emissions in 2022 are 235.97 Gg
CO2 / year which is 0.2% of M.0.EL emissions. 2022 Emissions have
changed by -2.5% (-5.96 Gg CO2 /
year). 1990-2022 Emissions have changed by -0.1% (-0.18 Gg CO2 / year). For 2022 the
changes per gas
are:
