Changes in PRIMAP-hist v2.5.1_final compared to v2.5_final for Brazil
2024-02-29
Johannes Gütschow
Change analysis for Brazil for PRIMAP-hist v2.5.1_final compared to v2.5_final
Overview over emissions by sector and gas
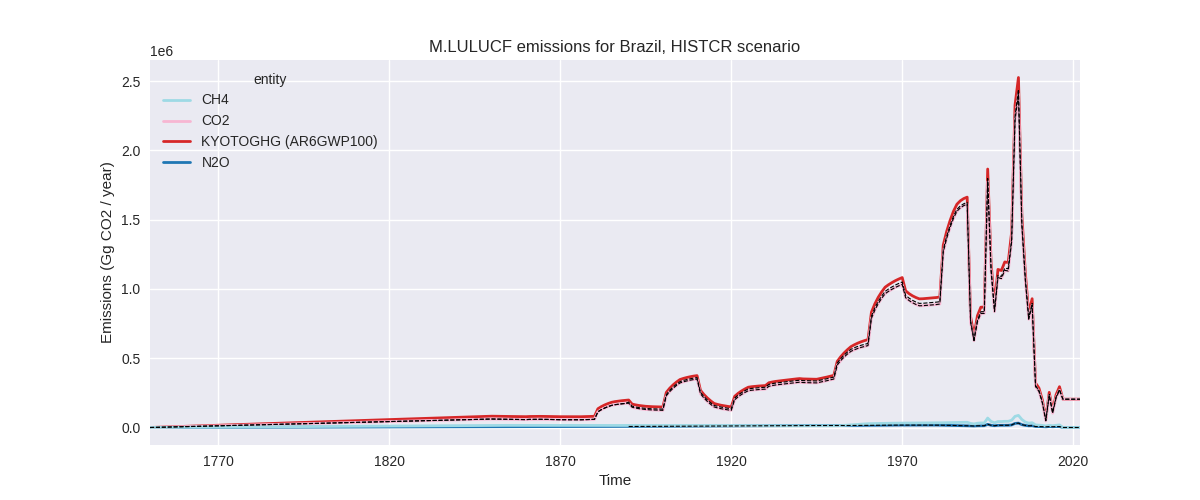
The following figures show the aggregate national total emissions excluding LULUCF AR6GWP100 for the country reported priority scenario. The dotted linesshow the v2.5_final data.


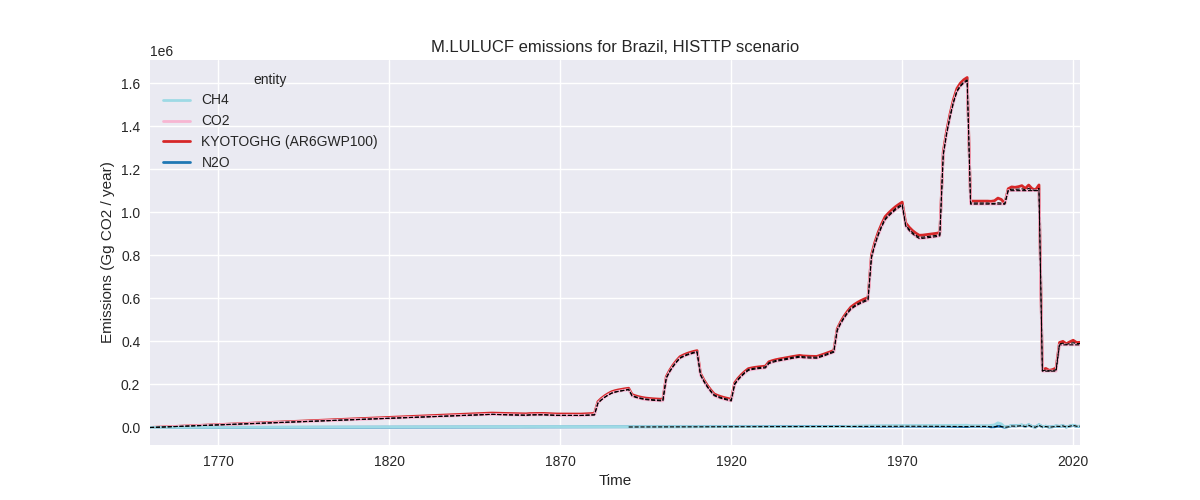
The following figures show the aggregate national total emissions excluding LULUCF AR6GWP100 for the third party priority scenario. The dotted linesshow the v2.5_final data.


Overview over changes
In the country reported priority scenario we have the following changes for aggregate Kyoto GHG and national total emissions excluding LULUCF (M.0.EL):
- Emissions in 2022 have changed by -0.6%% (-7158.30 Gg CO2 / year)
- Emissions in 1990-2022 have changed by -1.5%% (-14169.37 Gg CO2 / year)
In the third party priority scenario we have the following changes for aggregate Kyoto GHG and national total emissions excluding LULUCF (M.0.EL):
- Emissions in 2022 have changed by -1.8%% (-23175.50 Gg CO2 / year)
- Emissions in 1990-2022 have changed by -2.1%% (-22309.70 Gg CO2 / year)
Most important changes per scenario and time frame
In the country reported priority scenario the following sector-gas combinations have the highest absolute impact on national total KyotoGHG (AR6GWP100) emissions in 2022 (top 5):
- 1: 2, CO2 with -6536.26 Gg CO2 / year (-7.4%)
- 2: M.AG.ELV, CO2 with -6503.69 Gg CO2 / year (-33.5%)
- 3: 1.A, CO2 with 6387.50 Gg CO2 / year (1.7%)
- 4: M.AG.ELV, N2O with 5894.55 Gg CO2 / year (3.6%)
- 5: 4, CH4 with -3879.44 Gg CO2 / year (-4.3%)
In the country reported priority scenario the following sector-gas combinations have the highest absolute impact on national total KyotoGHG (AR6GWP100) emissions in 1990-2022 (top 5):
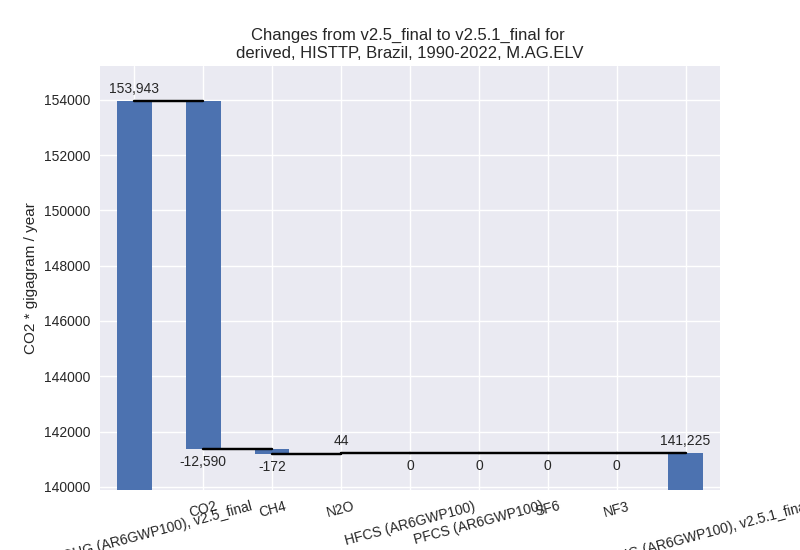
- 1: M.AG.ELV, CO2 with -12590.22 Gg CO2 / year (-66.5%)
- 2: 2, CO2 with -1880.42 Gg CO2 / year (-2.6%)
- 3: 1.A, CO2 with 746.59 Gg CO2 / year (0.3%)
- 4: 3.A, CH4 with -215.58 Gg CO2 / year (-0.1%)
- 5: M.AG.ELV, CH4 with -150.73 Gg CO2 / year (-0.9%)
In the third party priority scenario the following sector-gas combinations have the highest absolute impact on national total KyotoGHG (AR6GWP100) emissions in 2022 (top 5):
- 1: 1.A, CO2 with -23211.70 Gg CO2 / year (-5.2%)
- 2: M.AG.ELV, N2O with 8089.83 Gg CO2 / year (5.0%)
- 3: M.AG.ELV, CO2 with -6503.69 Gg CO2 / year (-33.5%)
- 4: 4, CH4 with -3044.40 Gg CO2 / year (-1.9%)
- 5: 3.A, CH4 with 2394.71 Gg CO2 / year (0.6%)
In the third party priority scenario the following sector-gas combinations have the highest absolute impact on national total KyotoGHG (AR6GWP100) emissions in 1990-2022 (top 5):
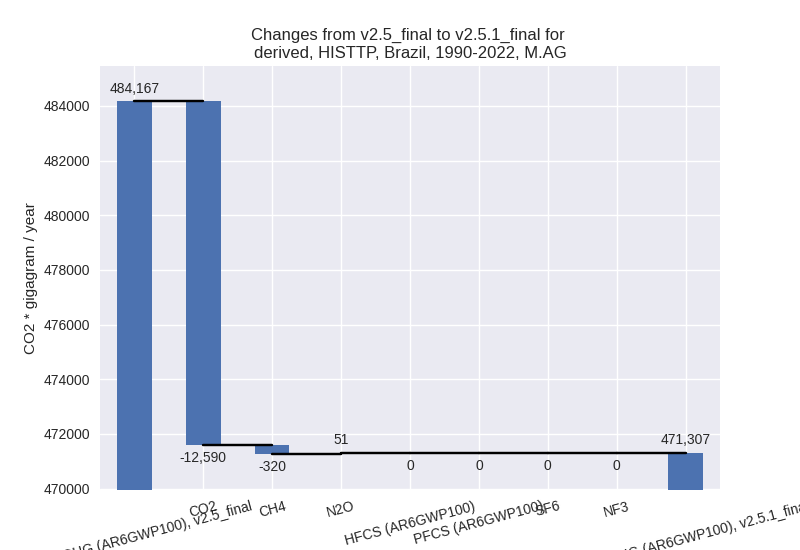
- 1: M.AG.ELV, CO2 with -12590.22 Gg CO2 / year (-66.5%)
- 2: 1.A, CO2 with -7573.52 Gg CO2 / year (-2.2%)
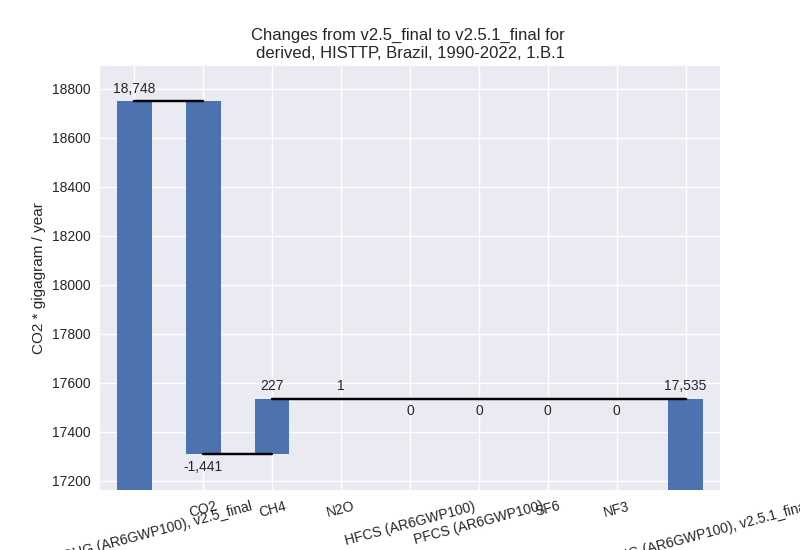
- 3: 1.B.1, CO2 with -1440.75 Gg CO2 / year (-43.3%)
- 4: 1.B.2, CH4 with -1110.05 Gg CO2 / year (-6.4%)
- 5: 2, N2O with 322.44 Gg CO2 / year (13.9%)
Notes on data changes
No country specific notes present for this changelog.
Changes by sector and gas
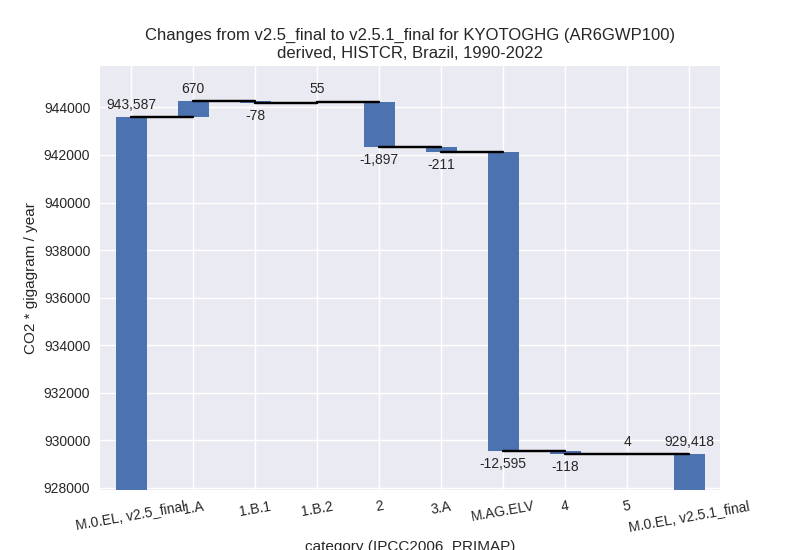
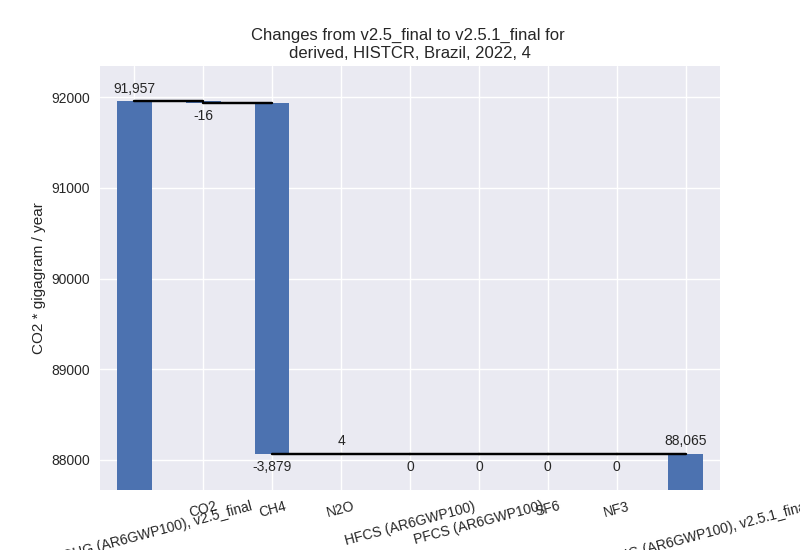
For each scenario and time frame the changes are displayed for all individual sectors and all individual gases. In the sector plot we use aggregate Kyoto GHGs in AR6GWP100. In the gas plot we usenational total emissions without LULUCF. ## country reported scenario
2022


1990-2022

third party scenario
2022


1990-2022


Detailed changes for the scenarios:
country reported scenario (HISTCR):
Most important changes per time frame
For 2022 the following sector-gas combinations have the highest absolute impact on national total KyotoGHG (AR6GWP100) emissions in 2022 (top 5):
- 1: 2, CO2 with -6536.26 Gg CO2 / year (-7.4%)
- 2: M.AG.ELV, CO2 with -6503.69 Gg CO2 / year (-33.5%)
- 3: 1.A, CO2 with 6387.50 Gg CO2 / year (1.7%)
- 4: M.AG.ELV, N2O with 5894.55 Gg CO2 / year (3.6%)
- 5: 4, CH4 with -3879.44 Gg CO2 / year (-4.3%)
For 1990-2022 the following sector-gas combinations have the highest absolute impact on national total KyotoGHG (AR6GWP100) emissions in 1990-2022 (top 5):
- 1: M.AG.ELV, CO2 with -12590.22 Gg CO2 / year (-66.5%)
- 2: 2, CO2 with -1880.42 Gg CO2 / year (-2.6%)
- 3: 1.A, CO2 with 746.59 Gg CO2 / year (0.3%)
- 4: 3.A, CH4 with -215.58 Gg CO2 / year (-0.1%)
- 5: M.AG.ELV, CH4 with -150.73 Gg CO2 / year (-0.9%)
Changes in the main sectors for aggregate KyotoGHG (AR6GWP100) are
- 1: Total sectoral emissions in 2022 are 417849.69 Gg CO2 / year which is 35.6% of M.0.EL emissions. 2022 Emissions have changed by 1.5% (6048.49 Gg CO2 / year). 1990-2022 Emissions have changed by 0.2% (647.10 Gg CO2 / year).
- 2: Total sectoral emissions in 2022 are 101556.05
Gg CO2 / year which is 8.7% of M.0.EL emissions. 2022 Emissions have
changed by -6.0% (-6459.74 Gg CO2 /
year). 1990-2022 Emissions have changed by -2.2% (-1896.89 Gg CO2 / year). For 2022
the changes per gas
are:

For 1990-2022 the changes per gas are:
- M.AG: Total sectoral emissions in 2022 are
559673.19 Gg CO2 / year which is 47.7% of M.0.EL emissions. 2022
Emissions have changed by -0.5%
(-2981.34 Gg CO2 / year). 1990-2022 Emissions have changed by -2.8% (-12805.46 Gg CO2 / year). For
1990-2022 the changes per gas
are:

The changes come from the following subsectors:- 3.A: Total sectoral emissions in 2022 are 361986.34 Gg CO2 / year which is 64.7% of category M.AG emissions. 2022 Emissions have changed by -0.1% (-353.59 Gg CO2 / year). 1990-2022 Emissions have changed by -0.1% (-210.79 Gg CO2 / year).
- M.AG.ELV: Total sectoral emissions in 2022 are
197686.84 Gg CO2 / year which is 35.3% of category M.AG emissions. 2022
Emissions have changed by -1.3%
(-2627.76 Gg CO2 / year). 1990-2022 Emissions have changed by -8.3% (-12594.68 Gg CO2 / year). For
1990-2022 the changes per gas
are:

There is no subsector information available in PRIMAP-hist.
- 4: Total sectoral emissions in 2022 are 88065.22 Gg
CO2 / year which is 7.5% of M.0.EL emissions. 2022 Emissions have
changed by -4.2% (-3891.45 Gg CO2 /
year). 1990-2022 Emissions have changed by -0.2% (-117.92 Gg CO2 / year). For 2022
the changes per gas
are:
- 5: Total sectoral emissions in 2022 are 6174.31 Gg
CO2 / year which is 0.5% of M.0.EL emissions. 2022 Emissions have
changed by 2.1% (125.71 Gg CO2 /
year). 1990-2022 Emissions have changed by 0.1% (3.81 Gg CO2 / year). For 2022 the
changes per gas
are:

third party scenario (HISTTP):
Most important changes per time frame
For 2022 the following sector-gas combinations have the highest absolute impact on national total KyotoGHG (AR6GWP100) emissions in 2022 (top 5):
- 1: 1.A, CO2 with -23211.70 Gg CO2 / year (-5.2%)
- 2: M.AG.ELV, N2O with 8089.83 Gg CO2 / year (5.0%)
- 3: M.AG.ELV, CO2 with -6503.69 Gg CO2 / year (-33.5%)
- 4: 4, CH4 with -3044.40 Gg CO2 / year (-1.9%)
- 5: 3.A, CH4 with 2394.71 Gg CO2 / year (0.6%)
For 1990-2022 the following sector-gas combinations have the highest absolute impact on national total KyotoGHG (AR6GWP100) emissions in 1990-2022 (top 5):
- 1: M.AG.ELV, CO2 with -12590.22 Gg CO2 / year (-66.5%)
- 2: 1.A, CO2 with -7573.52 Gg CO2 / year (-2.2%)
- 3: 1.B.1, CO2 with -1440.75 Gg CO2 / year (-43.3%)
- 4: 1.B.2, CH4 with -1110.05 Gg CO2 / year (-6.4%)
- 5: 2, N2O with 322.44 Gg CO2 / year (13.9%)
Changes in the main sectors for aggregate KyotoGHG (AR6GWP100) are
- 1: Total sectoral emissions in 2022 are 480875.05
Gg CO2 / year which is 37.3% of M.0.EL emissions. 2022 Emissions have
changed by -4.9% (-24787.14 Gg CO2 /
year). 1990-2022 Emissions have changed by -2.5% (-9838.73 Gg CO2 / year). For 2022
the changes per gas
are:

For 1990-2022 the changes per gas are:
The changes come from the following subsectors:- 1.A: Total sectoral emissions in 2022 are 437990.22
Gg CO2 / year which is 91.1% of category 1 emissions. 2022 Emissions
have changed by -4.9% (-22675.68 Gg
CO2 / year). 1990-2022 Emissions have changed by -2.1% (-7515.28 Gg CO2 / year). For 2022
the changes per gas
are:

For 1990-2022 the changes per gas are:
There is no subsector information available in PRIMAP-hist. - 1.B.1: Total sectoral emissions in 2022 are
14713.24 Gg CO2 / year which is 3.1% of category 1 emissions. 2022
Emissions have changed by -0.9%
(-133.12 Gg CO2 / year). 1990-2022 Emissions have changed by -6.5% (-1213.35 Gg CO2 / year). For
1990-2022 the changes per gas
are:
There is no subsector information available in PRIMAP-hist. - 1.B.2: Total sectoral emissions in 2022 are
28171.60 Gg CO2 / year which is 5.9% of category 1 emissions. 2022
Emissions have changed by -6.6%
(-1978.34 Gg CO2 / year). 1990-2022 Emissions have changed by -5.4% (-1110.11 Gg CO2 / year). For 2022
the changes per gas
are:

For 1990-2022 the changes per gas are:
There is no subsector information available in PRIMAP-hist.
- 1.A: Total sectoral emissions in 2022 are 437990.22
Gg CO2 / year which is 91.1% of category 1 emissions. 2022 Emissions
have changed by -4.9% (-22675.68 Gg
CO2 / year). 1990-2022 Emissions have changed by -2.1% (-7515.28 Gg CO2 / year). For 2022
the changes per gas
are:
- 2: Total sectoral emissions in 2022 are 64088.09 Gg CO2 / year which is 5.0% of M.0.EL emissions. 2022 Emissions have changed by 0.6% (389.30 Gg CO2 / year). 1990-2022 Emissions have changed by 1.0% (477.75 Gg CO2 / year).
- M.AG: Total sectoral emissions in 2022 are
575197.34 Gg CO2 / year which is 44.6% of M.0.EL emissions. 2022
Emissions have changed by 0.7%
(4160.00 Gg CO2 / year). 1990-2022 Emissions have changed by -2.7% (-12859.69 Gg CO2 / year). For
1990-2022 the changes per gas
are:
The changes come from the following subsectors:- 3.A: Total sectoral emissions in 2022 are 383787.05 Gg CO2 / year which is 66.7% of category M.AG emissions. 2022 Emissions have changed by 0.6% (2340.80 Gg CO2 / year). 1990-2022 Emissions have changed by -0.0% (-141.79 Gg CO2 / year).
- M.AG.ELV: Total sectoral emissions in 2022 are
191410.29 Gg CO2 / year which is 33.3% of category M.AG emissions. 2022
Emissions have changed by 1.0%
(1819.20 Gg CO2 / year). 1990-2022 Emissions have changed by -8.3% (-12717.90 Gg CO2 / year). For
1990-2022 the changes per gas
are:
There is no subsector information available in PRIMAP-hist.
- 4: Total sectoral emissions in 2022 are 163330.40 Gg CO2 / year which is 12.7% of M.0.EL emissions. 2022 Emissions have changed by -1.8% (-3063.43 Gg CO2 / year). 1990-2022 Emissions have changed by -0.1% (-92.83 Gg CO2 / year).
- 5: Total sectoral emissions in 2022 are 6174.31 Gg
CO2 / year which is 0.5% of M.0.EL emissions. 2022 Emissions have
changed by 2.1% (125.71 Gg CO2 /
year). 1990-2022 Emissions have changed by 0.1% (3.81 Gg CO2 / year). For 2022 the
changes per gas
are:
