Changes in PRIMAP-hist v2.5.1_final compared to v2.5_final for Brunei Darussalam
2024-02-29
Johannes Gütschow
Change analysis for Brunei Darussalam for PRIMAP-hist v2.5.1_final compared to v2.5_final
Overview over emissions by sector and gas
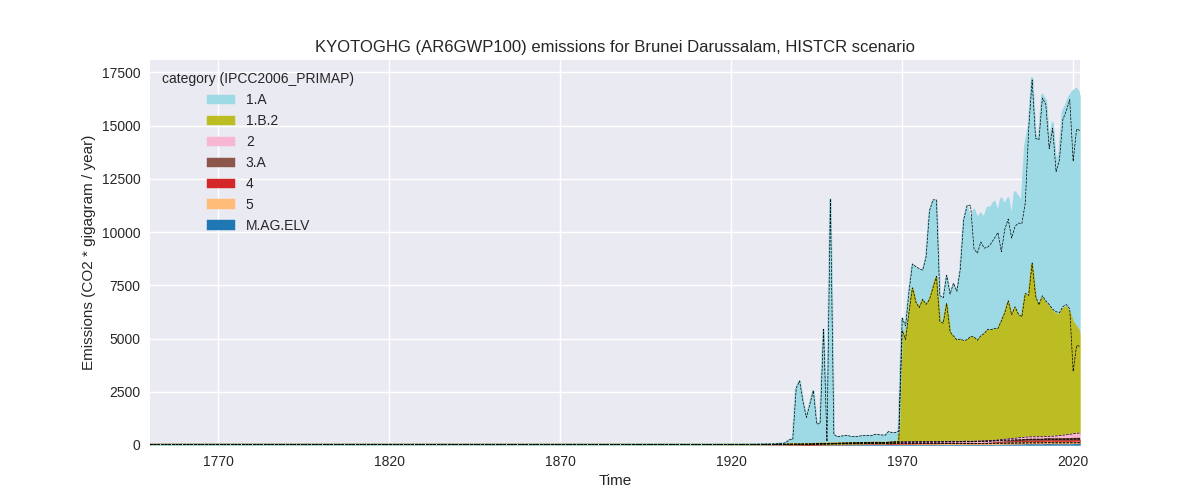
The following figures show the aggregate national total emissions excluding LULUCF AR6GWP100 for the country reported priority scenario. The dotted linesshow the v2.5_final data.


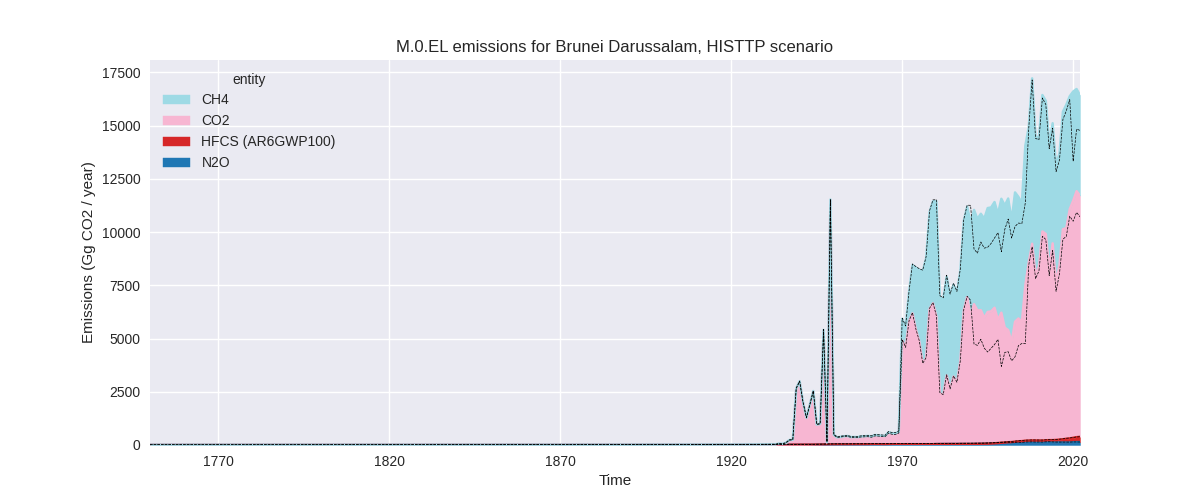
The following figures show the aggregate national total emissions excluding LULUCF AR6GWP100 for the third party priority scenario. The dotted linesshow the v2.5_final data.

Overview over changes
In the country reported priority scenario we have the following changes for aggregate Kyoto GHG and national total emissions excluding LULUCF (M.0.EL):
- Emissions in 2022 have changed by 11.2%% (1649.49 Gg CO2 / year)
- Emissions in 1990-2022 have changed by 8.0%% (988.42 Gg CO2 / year)
In the third party priority scenario we have the following changes for aggregate Kyoto GHG and national total emissions excluding LULUCF (M.0.EL):
- Emissions in 2022 have changed by 11.2%% (1649.49 Gg CO2 / year)
- Emissions in 1990-2022 have changed by 8.0%% (988.42 Gg CO2 / year)
Most important changes per scenario and time frame
In the country reported priority scenario the following sector-gas combinations have the highest absolute impact on national total KyotoGHG (AR6GWP100) emissions in 2022 (top 5):
- 1: 1.A, CO2 with 1017.67 Gg CO2 / year (10.1%)
- 2: 1.B.2, CH4 with 651.38 Gg CO2 / year (16.8%)
- 3: M.AG.ELV, N2O with -15.64 Gg CO2 / year (-16.5%)
- 4: 2, CO2 with -14.79 Gg CO2 / year (-82.4%)
- 5: 1.A, N2O with 8.36 Gg CO2 / year (53.0%)
In the country reported priority scenario the following sector-gas combinations have the highest absolute impact on national total KyotoGHG (AR6GWP100) emissions in 1990-2022 (top 5):
- 1: 1.A, CO2 with 964.99 Gg CO2 / year (15.4%)
- 2: 1.B.2, CH4 with 57.36 Gg CO2 / year (1.1%)
- 3: M.AG.ELV, N2O with -25.41 Gg CO2 / year (-32.8%)
- 4: 2, CO2 with -9.35 Gg CO2 / year (-62.0%)
- 5: 1.A, N2O with 0.67 Gg CO2 / year (4.8%)
In the third party priority scenario the following sector-gas combinations have the highest absolute impact on national total KyotoGHG (AR6GWP100) emissions in 2022 (top 5):
- 1: 1.A, CO2 with 1017.67 Gg CO2 / year (10.1%)
- 2: 1.B.2, CH4 with 651.38 Gg CO2 / year (16.8%)
- 3: M.AG.ELV, N2O with -15.64 Gg CO2 / year (-16.5%)
- 4: 2, CO2 with -14.79 Gg CO2 / year (-82.4%)
- 5: 1.A, N2O with 8.36 Gg CO2 / year (53.0%)
In the third party priority scenario the following sector-gas combinations have the highest absolute impact on national total KyotoGHG (AR6GWP100) emissions in 1990-2022 (top 5):
- 1: 1.A, CO2 with 964.99 Gg CO2 / year (15.4%)
- 2: 1.B.2, CH4 with 57.36 Gg CO2 / year (1.1%)
- 3: M.AG.ELV, N2O with -25.41 Gg CO2 / year (-32.8%)
- 4: 2, CO2 with -9.35 Gg CO2 / year (-62.0%)
- 5: 1.A, N2O with 0.67 Gg CO2 / year (4.8%)
Notes on data changes
Here we list notes explaining important emissions changes for the country. ’' means that the following text only applies to the TP time series, while means that it only applies to the CR scenario. Otherwise the note applies to both scenarios.
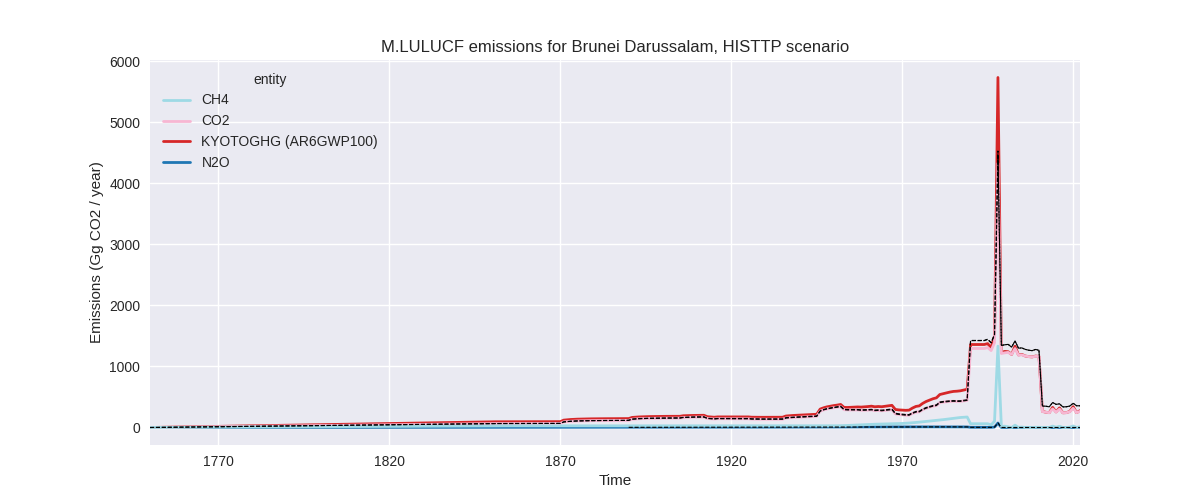
General note: We have no country reported data for Brunei Darussalam, thus the CR and TP time-series are identical except for LULUCF.
- 1.A, CO2: Updated CDIAC emissions lead to higher emissions after 1990
- 1.B.2, CH4: EDGAR 7.0 showed an emission decline in 2020 which is not present in EDGAR 8.0, thus 2022 and cumulative emissions are higher in v2.5.1 than in v2.5.
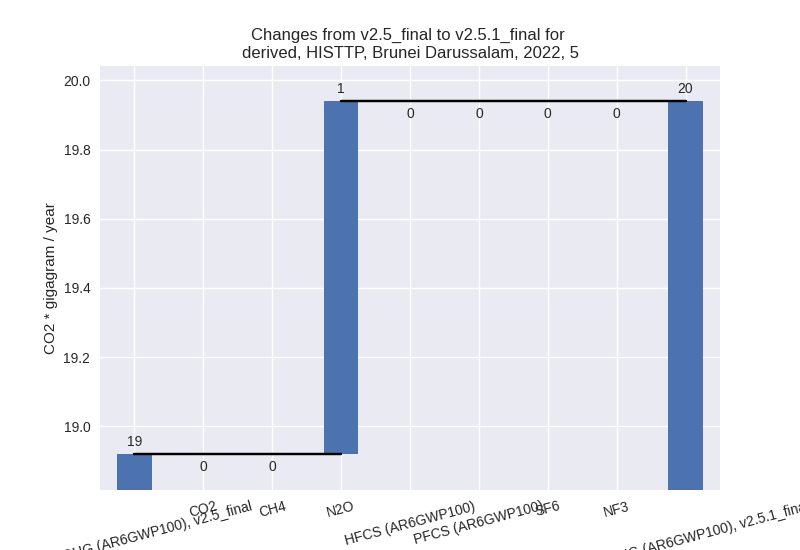
Changes by sector and gas
For each scenario and time frame the changes are displayed for all individual sectors and all individual gases. In the sector plot we use aggregate Kyoto GHGs in AR6GWP100. In the gas plot we usenational total emissions without LULUCF. ## country reported scenario
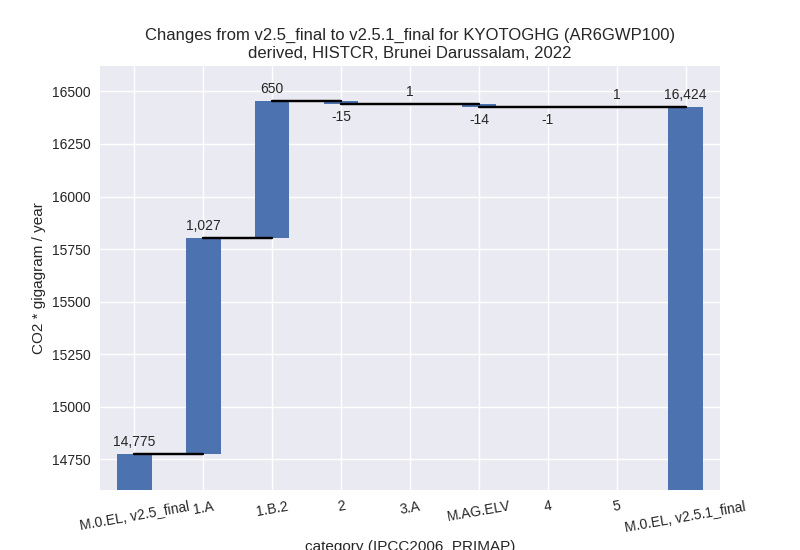
2022

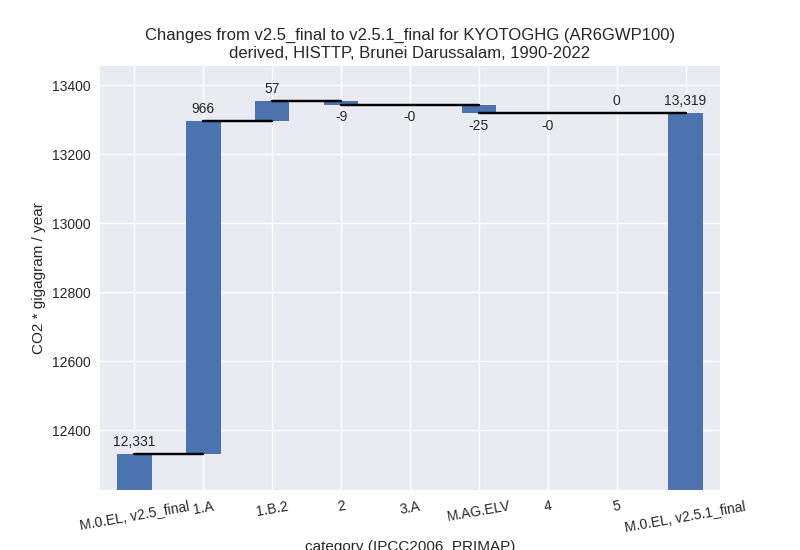
1990-2022


third party scenario
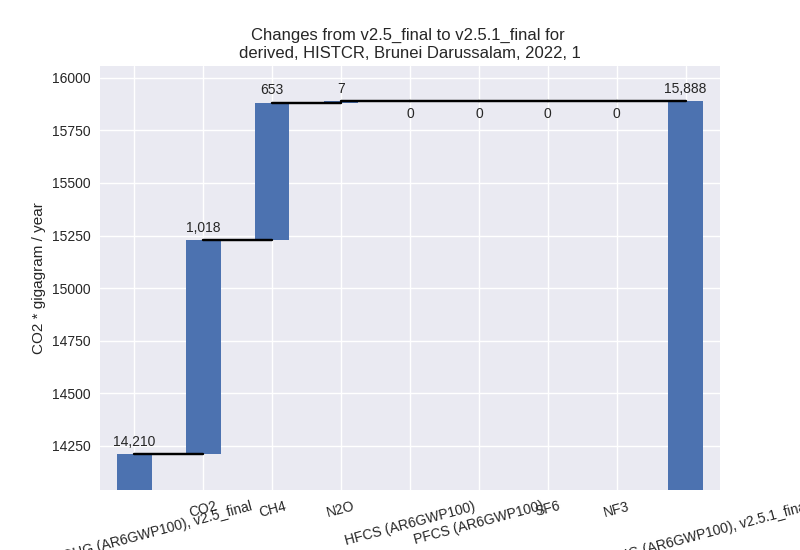
2022


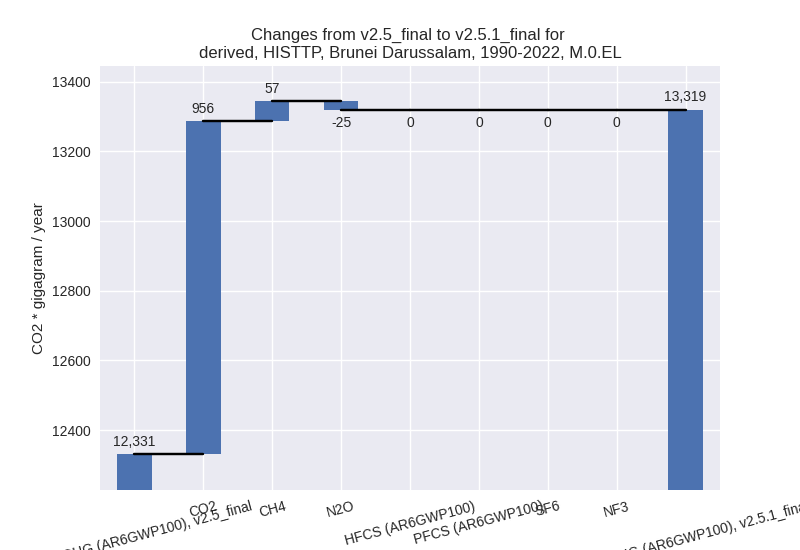
1990-2022
Detailed changes for the scenarios:
country reported scenario (HISTCR):
Most important changes per time frame
For 2022 the following sector-gas combinations have the highest absolute impact on national total KyotoGHG (AR6GWP100) emissions in 2022 (top 5):
- 1: 1.A, CO2 with 1017.67 Gg CO2 / year (10.1%)
- 2: 1.B.2, CH4 with 651.38 Gg CO2 / year (16.8%)
- 3: M.AG.ELV, N2O with -15.64 Gg CO2 / year (-16.5%)
- 4: 2, CO2 with -14.79 Gg CO2 / year (-82.4%)
- 5: 1.A, N2O with 8.36 Gg CO2 / year (53.0%)
For 1990-2022 the following sector-gas combinations have the highest absolute impact on national total KyotoGHG (AR6GWP100) emissions in 1990-2022 (top 5):
- 1: 1.A, CO2 with 964.99 Gg CO2 / year (15.4%)
- 2: 1.B.2, CH4 with 57.36 Gg CO2 / year (1.1%)
- 3: M.AG.ELV, N2O with -25.41 Gg CO2 / year (-32.8%)
- 4: 2, CO2 with -9.35 Gg CO2 / year (-62.0%)
- 5: 1.A, N2O with 0.67 Gg CO2 / year (4.8%)
Changes in the main sectors for aggregate KyotoGHG (AR6GWP100) are
- 1: Total sectoral emissions in 2022 are 15888.15 Gg
CO2 / year which is 96.7% of M.0.EL emissions. 2022 Emissions have
changed by 11.8% (1677.76 Gg CO2 /
year). 1990-2022 Emissions have changed by 8.5% (1023.20 Gg CO2 / year). For 2022 the
changes per gas
are:
For 1990-2022 the changes per gas are:
The changes come from the following subsectors:- 1.A: Total sectoral emissions in 2022 are 11168.78
Gg CO2 / year which is 70.3% of category 1 emissions. 2022 Emissions
have changed by 10.1% (1027.40 Gg
CO2 / year). 1990-2022 Emissions have changed by 15.3% (965.87 Gg CO2 / year). For 2022 the
changes per gas
are:

For 1990-2022 the changes per gas are:
There is no subsector information available in PRIMAP-hist. - 1.B.2: Total sectoral emissions in 2022 are 4719.37
Gg CO2 / year which is 29.7% of category 1 emissions. 2022 Emissions
have changed by 16.0% (650.36 Gg CO2
/ year). 1990-2022 Emissions have changed by 1.0% (57.33 Gg CO2 / year). For 2022 the
changes per gas
are:
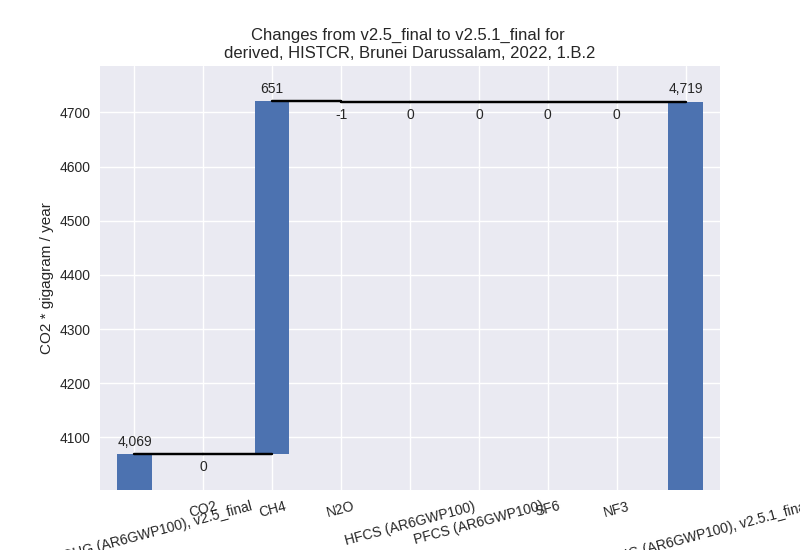
There is no subsector information available in PRIMAP-hist.
- 1.A: Total sectoral emissions in 2022 are 11168.78
Gg CO2 / year which is 70.3% of category 1 emissions. 2022 Emissions
have changed by 10.1% (1027.40 Gg
CO2 / year). 1990-2022 Emissions have changed by 15.3% (965.87 Gg CO2 / year). For 2022 the
changes per gas
are:
- 2: Total sectoral emissions in 2022 are 251.48 Gg
CO2 / year which is 1.5% of M.0.EL emissions. 2022 Emissions have
changed by -5.6% (-14.79 Gg CO2 /
year). 1990-2022 Emissions have changed by -9.6% (-9.35 Gg CO2 / year). For 2022 the
changes per gas
are:

For 1990-2022 the changes per gas are:
- M.AG: Total sectoral emissions in 2022 are 110.01
Gg CO2 / year which is 0.7% of M.0.EL emissions. 2022 Emissions have
changed by -11.1% (-13.78 Gg CO2 /
year). 1990-2022 Emissions have changed by -24.4% (-25.44 Gg CO2 / year). For 2022
the changes per gas
are:
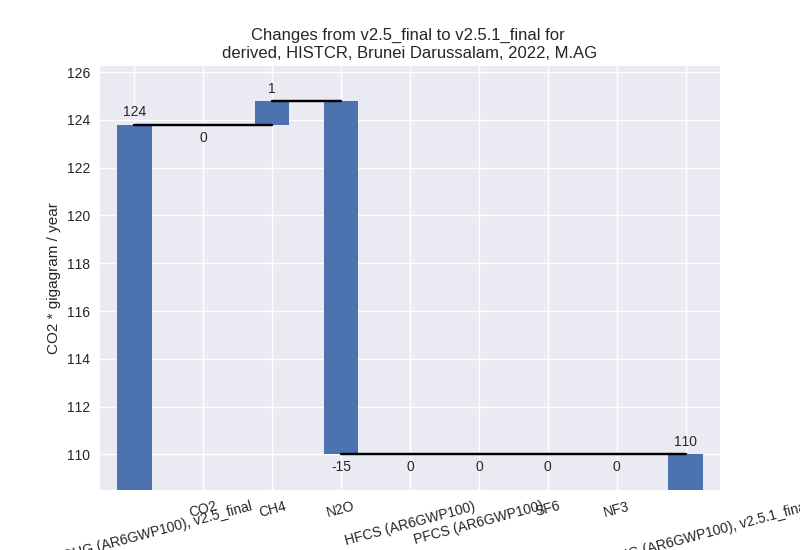
For 1990-2022 the changes per gas are:
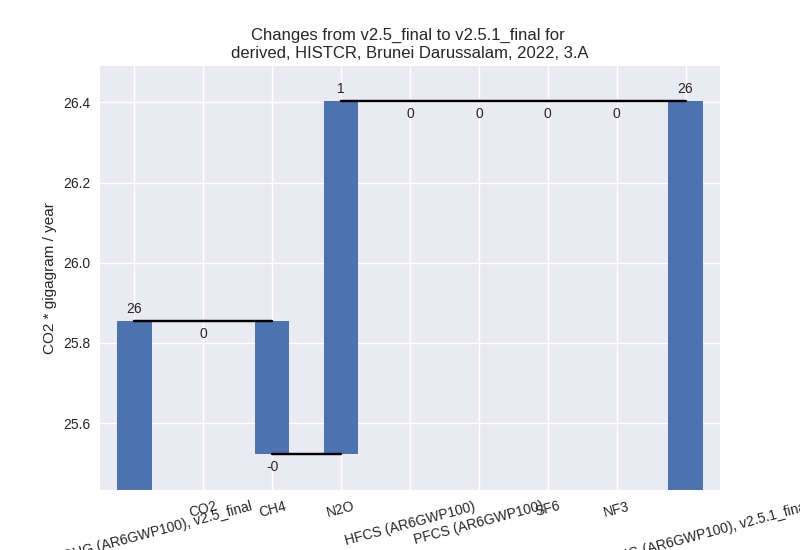
The changes come from the following subsectors:- 3.A: Total sectoral emissions in 2022 are 26.40 Gg
CO2 / year which is 24.0% of category M.AG emissions. 2022 Emissions
have changed by 2.1% (0.55 Gg CO2 /
year). 1990-2022 Emissions have changed by -0.3% (-0.08 Gg CO2 / year). For 2022 the
changes per gas
are:
There is no subsector information available in PRIMAP-hist. - M.AG.ELV: Total sectoral emissions in 2022 are
83.61 Gg CO2 / year which is 76.0% of category M.AG emissions. 2022
Emissions have changed by -14.6%
(-14.33 Gg CO2 / year). 1990-2022 Emissions have changed by -31.1% (-25.36 Gg CO2 / year). For 2022
the changes per gas
are:

For 1990-2022 the changes per gas are:
There is no subsector information available in PRIMAP-hist.
- 3.A: Total sectoral emissions in 2022 are 26.40 Gg
CO2 / year which is 24.0% of category M.AG emissions. 2022 Emissions
have changed by 2.1% (0.55 Gg CO2 /
year). 1990-2022 Emissions have changed by -0.3% (-0.08 Gg CO2 / year). For 2022 the
changes per gas
are:
- 4: Total sectoral emissions in 2022 are 154.77 Gg CO2 / year which is 0.9% of M.0.EL emissions. 2022 Emissions have changed by -0.5% (-0.71 Gg CO2 / year). 1990-2022 Emissions have changed by -0.0% (-0.02 Gg CO2 / year).
- 5: Total sectoral emissions in 2022 are 19.94 Gg
CO2 / year which is 0.1% of M.0.EL emissions. 2022 Emissions have
changed by 5.4% (1.02 Gg CO2 /
year). 1990-2022 Emissions have changed by 0.2% (0.03 Gg CO2 / year). For 2022 the
changes per gas
are:

third party scenario (HISTTP):
Most important changes per time frame
For 2022 the following sector-gas combinations have the highest absolute impact on national total KyotoGHG (AR6GWP100) emissions in 2022 (top 5):
- 1: 1.A, CO2 with 1017.67 Gg CO2 / year (10.1%)
- 2: 1.B.2, CH4 with 651.38 Gg CO2 / year (16.8%)
- 3: M.AG.ELV, N2O with -15.64 Gg CO2 / year (-16.5%)
- 4: 2, CO2 with -14.79 Gg CO2 / year (-82.4%)
- 5: 1.A, N2O with 8.36 Gg CO2 / year (53.0%)
For 1990-2022 the following sector-gas combinations have the highest absolute impact on national total KyotoGHG (AR6GWP100) emissions in 1990-2022 (top 5):
- 1: 1.A, CO2 with 964.99 Gg CO2 / year (15.4%)
- 2: 1.B.2, CH4 with 57.36 Gg CO2 / year (1.1%)
- 3: M.AG.ELV, N2O with -25.41 Gg CO2 / year (-32.8%)
- 4: 2, CO2 with -9.35 Gg CO2 / year (-62.0%)
- 5: 1.A, N2O with 0.67 Gg CO2 / year (4.8%)
Changes in the main sectors for aggregate KyotoGHG (AR6GWP100) are
- 1: Total sectoral emissions in 2022 are 15888.15 Gg
CO2 / year which is 96.7% of M.0.EL emissions. 2022 Emissions have
changed by 11.8% (1677.76 Gg CO2 /
year). 1990-2022 Emissions have changed by 8.5% (1023.20 Gg CO2 / year). For 2022 the
changes per gas
are:

For 1990-2022 the changes per gas are: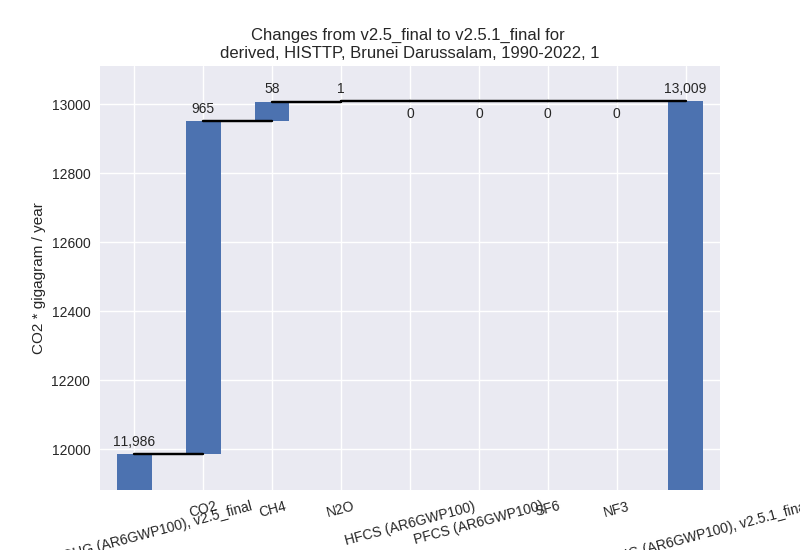
The changes come from the following subsectors:- 1.A: Total sectoral emissions in 2022 are 11168.78
Gg CO2 / year which is 70.3% of category 1 emissions. 2022 Emissions
have changed by 10.1% (1027.40 Gg
CO2 / year). 1990-2022 Emissions have changed by 15.3% (965.87 Gg CO2 / year). For 2022 the
changes per gas
are:

For 1990-2022 the changes per gas are: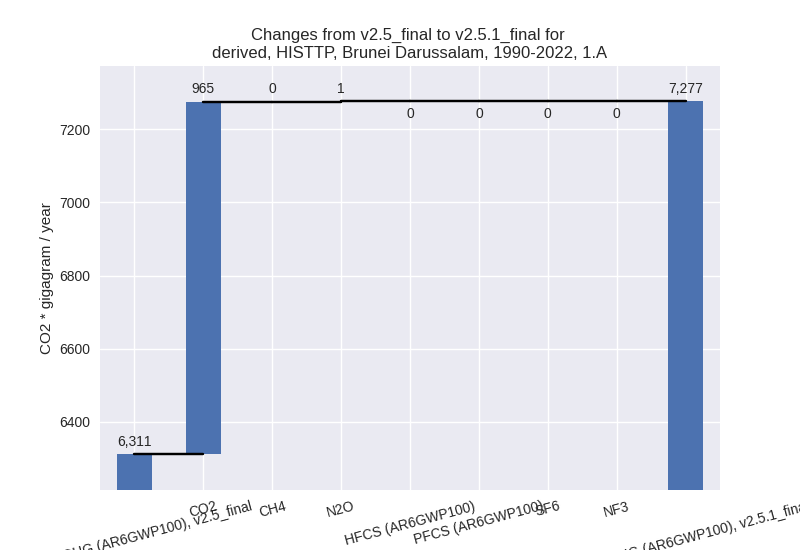
There is no subsector information available in PRIMAP-hist. - 1.B.2: Total sectoral emissions in 2022 are 4719.37
Gg CO2 / year which is 29.7% of category 1 emissions. 2022 Emissions
have changed by 16.0% (650.36 Gg CO2
/ year). 1990-2022 Emissions have changed by 1.0% (57.33 Gg CO2 / year). For 2022 the
changes per gas
are:

There is no subsector information available in PRIMAP-hist.
- 1.A: Total sectoral emissions in 2022 are 11168.78
Gg CO2 / year which is 70.3% of category 1 emissions. 2022 Emissions
have changed by 10.1% (1027.40 Gg
CO2 / year). 1990-2022 Emissions have changed by 15.3% (965.87 Gg CO2 / year). For 2022 the
changes per gas
are:
- 2: Total sectoral emissions in 2022 are 251.48 Gg
CO2 / year which is 1.5% of M.0.EL emissions. 2022 Emissions have
changed by -5.6% (-14.79 Gg CO2 /
year). 1990-2022 Emissions have changed by -9.6% (-9.35 Gg CO2 / year). For 2022 the
changes per gas
are:

For 1990-2022 the changes per gas are: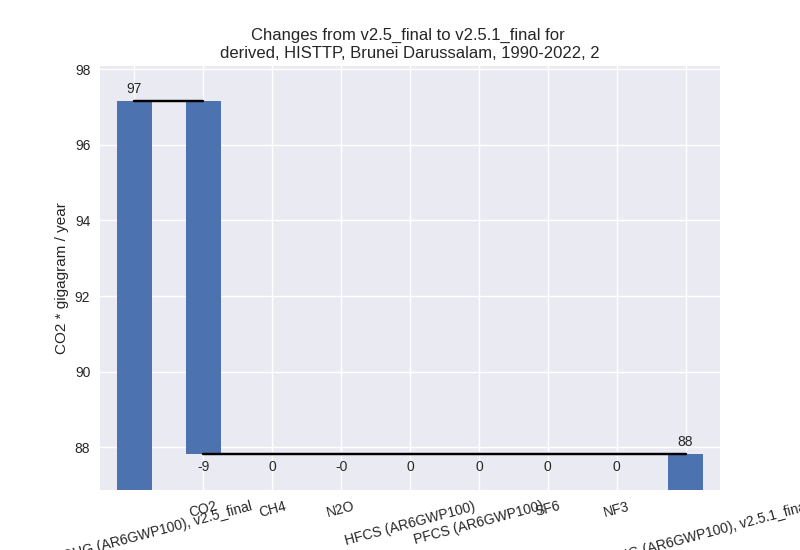
- M.AG: Total sectoral emissions in 2022 are 110.01
Gg CO2 / year which is 0.7% of M.0.EL emissions. 2022 Emissions have
changed by -11.1% (-13.78 Gg CO2 /
year). 1990-2022 Emissions have changed by -24.4% (-25.44 Gg CO2 / year). For 2022
the changes per gas
are:

For 1990-2022 the changes per gas are: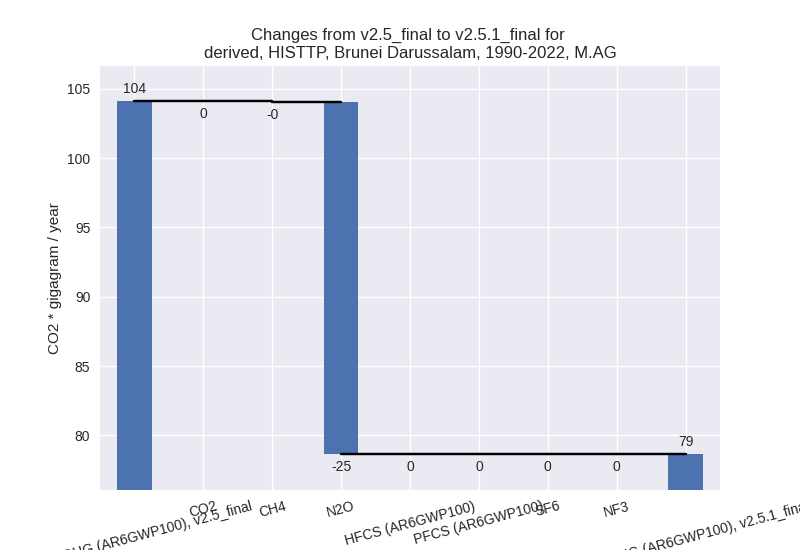
The changes come from the following subsectors:- 3.A: Total sectoral emissions in 2022 are 26.40 Gg
CO2 / year which is 24.0% of category M.AG emissions. 2022 Emissions
have changed by 2.1% (0.55 Gg CO2 /
year). 1990-2022 Emissions have changed by -0.3% (-0.08 Gg CO2 / year). For 2022 the
changes per gas
are:

There is no subsector information available in PRIMAP-hist. - M.AG.ELV: Total sectoral emissions in 2022 are
83.61 Gg CO2 / year which is 76.0% of category M.AG emissions. 2022
Emissions have changed by -14.6%
(-14.33 Gg CO2 / year). 1990-2022 Emissions have changed by -31.1% (-25.36 Gg CO2 / year). For 2022
the changes per gas
are:

For 1990-2022 the changes per gas are:
There is no subsector information available in PRIMAP-hist.
- 3.A: Total sectoral emissions in 2022 are 26.40 Gg
CO2 / year which is 24.0% of category M.AG emissions. 2022 Emissions
have changed by 2.1% (0.55 Gg CO2 /
year). 1990-2022 Emissions have changed by -0.3% (-0.08 Gg CO2 / year). For 2022 the
changes per gas
are:
- 4: Total sectoral emissions in 2022 are 154.77 Gg CO2 / year which is 0.9% of M.0.EL emissions. 2022 Emissions have changed by -0.5% (-0.71 Gg CO2 / year). 1990-2022 Emissions have changed by -0.0% (-0.02 Gg CO2 / year).
- 5: Total sectoral emissions in 2022 are 19.94 Gg
CO2 / year which is 0.1% of M.0.EL emissions. 2022 Emissions have
changed by 5.4% (1.02 Gg CO2 /
year). 1990-2022 Emissions have changed by 0.2% (0.03 Gg CO2 / year). For 2022 the
changes per gas
are: