Changes in PRIMAP-hist v2.5.1_final compared to v2.5_final for Botswana
2024-02-29
Johannes Gütschow
Change analysis for Botswana for PRIMAP-hist v2.5.1_final compared to v2.5_final
Overview over emissions by sector and gas
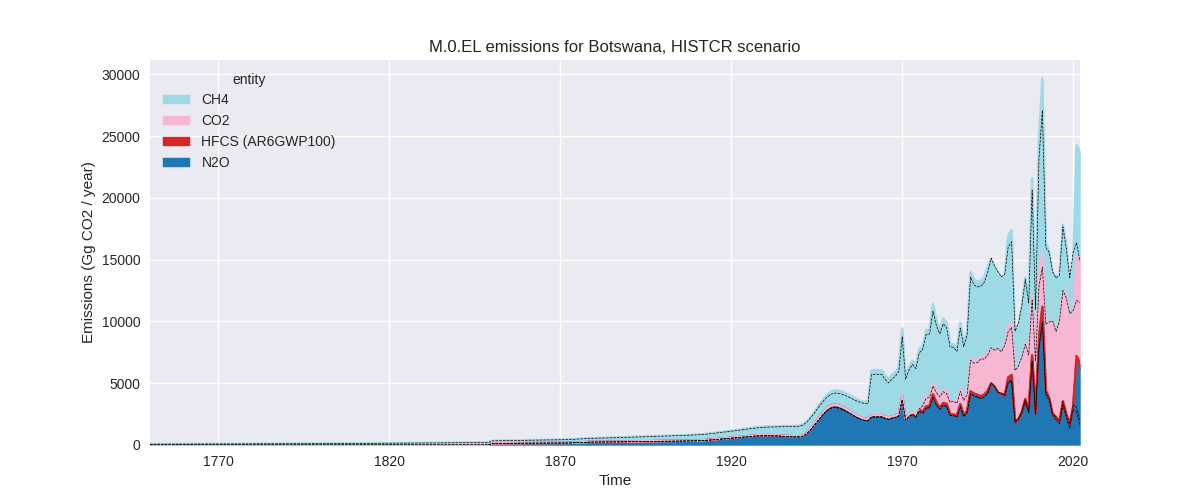
The following figures show the aggregate national total emissions excluding LULUCF AR6GWP100 for the country reported priority scenario. The dotted linesshow the v2.5_final data.


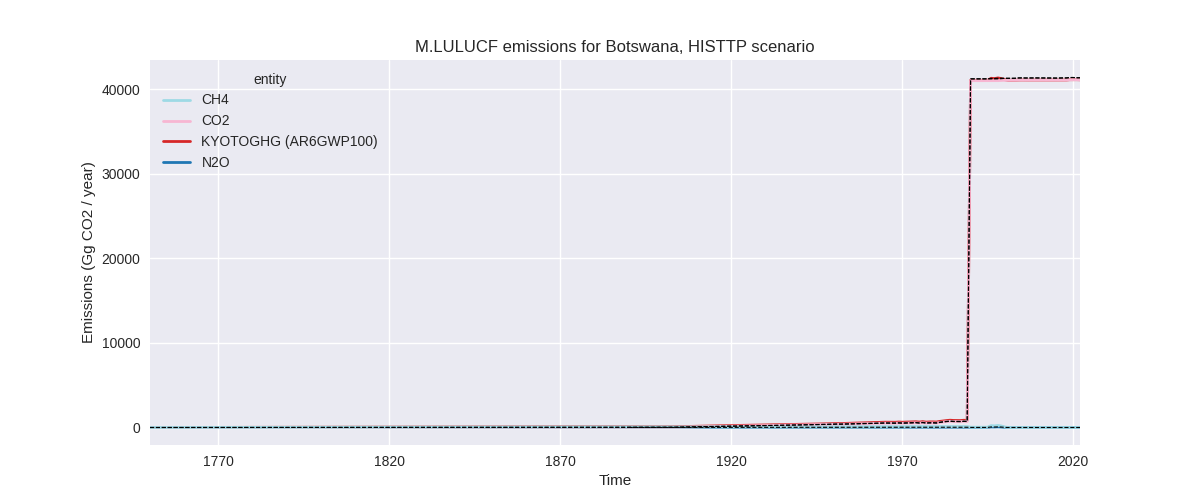
The following figures show the aggregate national total emissions excluding LULUCF AR6GWP100 for the third party priority scenario. The dotted linesshow the v2.5_final data.


Overview over changes
In the country reported priority scenario we have the following changes for aggregate Kyoto GHG and national total emissions excluding LULUCF (M.0.EL):
- Emissions in 2022 have changed by 60.0%% (8916.84 Gg CO2 / year)
- Emissions in 1990-2022 have changed by 5.4%% (792.26 Gg CO2 / year)
In the third party priority scenario we have the following changes for aggregate Kyoto GHG and national total emissions excluding LULUCF (M.0.EL):
- Emissions in 2022 have changed by 70.6%% (9309.96 Gg CO2 / year)
- Emissions in 1990-2022 have changed by 5.9%% (862.69 Gg CO2 / year)
Most important changes per scenario and time frame
In the country reported priority scenario the following sector-gas combinations have the highest absolute impact on national total KyotoGHG (AR6GWP100) emissions in 2022 (top 5):
- 1: M.AG.ELV, CH4 with 5206.70 Gg CO2 / year (617.6%)
- 2: M.AG.ELV, N2O with 4631.39 Gg CO2 / year (355.0%)
- 3: 1.A, CO2 with -686.67 Gg CO2 / year (-7.2%)
- 4: 3.A, CH4 with -130.28 Gg CO2 / year (-7.7%)
- 5: 1.B.1, CH4 with -85.57 Gg CO2 / year (-17.5%)
In the country reported priority scenario the following sector-gas combinations have the highest absolute impact on national total KyotoGHG (AR6GWP100) emissions in 1990-2022 (top 5):
- 1: M.AG.ELV, CH4 with 486.58 Gg CO2 / year (18.2%)
- 2: M.AG.ELV, N2O with 386.26 Gg CO2 / year (10.8%)
- 3: 1.A, CO2 with -57.39 Gg CO2 / year (-1.1%)
- 4: 3.A, CH4 with -11.09 Gg CO2 / year (-0.5%)
- 5: 2, CO2 with -6.06 Gg CO2 / year (-16.6%)
In the third party priority scenario the following sector-gas combinations have the highest absolute impact on national total KyotoGHG (AR6GWP100) emissions in 2022 (top 5):
- 1: M.AG.ELV, CH4 with 5206.70 Gg CO2 / year (617.6%)
- 2: M.AG.ELV, N2O with 4631.39 Gg CO2 / year (355.0%)
- 3: 1.A, CO2 with -541.40 Gg CO2 / year (-7.2%)
- 4: 3.A, CH4 with 159.62 Gg CO2 / year (16.7%)
- 5: 1.B.1, CH4 with -118.78 Gg CO2 / year (-11.5%)
In the third party priority scenario the following sector-gas combinations have the highest absolute impact on national total KyotoGHG (AR6GWP100) emissions in 1990-2022 (top 5):
- 1: M.AG.ELV, CH4 with 486.58 Gg CO2 / year (18.2%)
- 2: M.AG.ELV, N2O with 386.26 Gg CO2 / year (10.8%)
- 3: 1.A, CO2 with -45.25 Gg CO2 / year (-1.0%)
- 4: 1.B.1, CH4 with 43.73 Gg CO2 / year (8.0%)
- 5: 2, CO2 with -6.06 Gg CO2 / year (-16.6%)
Notes on data changes
Here we list notes explaining important emissions changes for the country. ’' means that the following text only applies to the TP time series, while means that it only applies to the CR scenario. Otherwise the note applies to both scenarios.
General note: causes of the main changes are the same as for the CR scenario
- M.AG.ELV, KYOTOGHG (AR6GWP100): reason for the 2022 emissions increase is that updated FAO data shows a strong increase in CH4 and N2O from biomass burning in 2021 which has not been modeled by extrapolation in PRIMAP-hist v2.5. The change in cumulative emissions is due to the change in 2022 emissions.
Changes by sector and gas
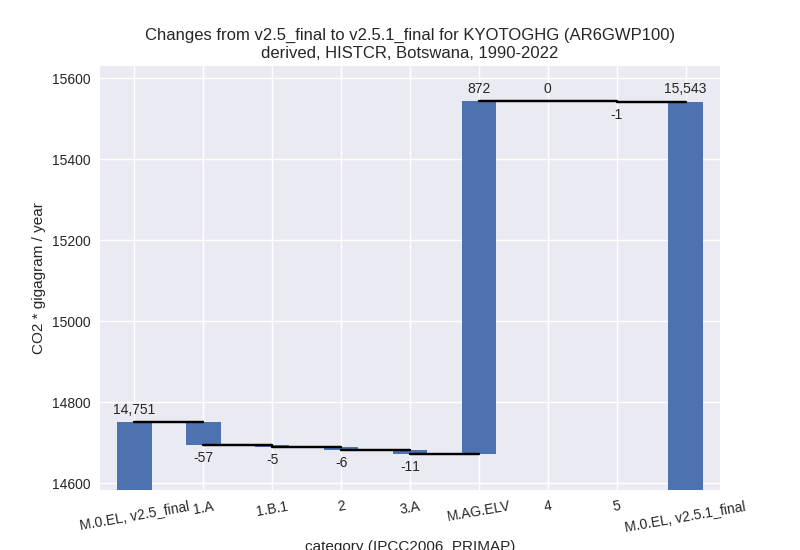
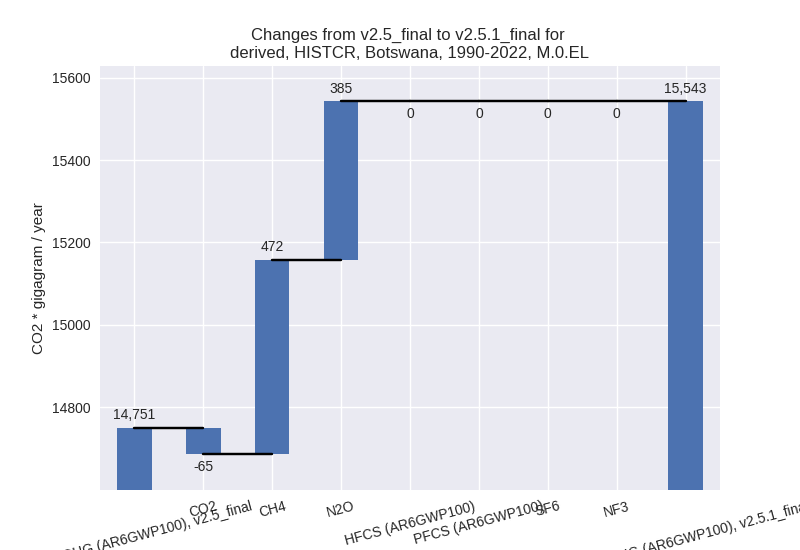
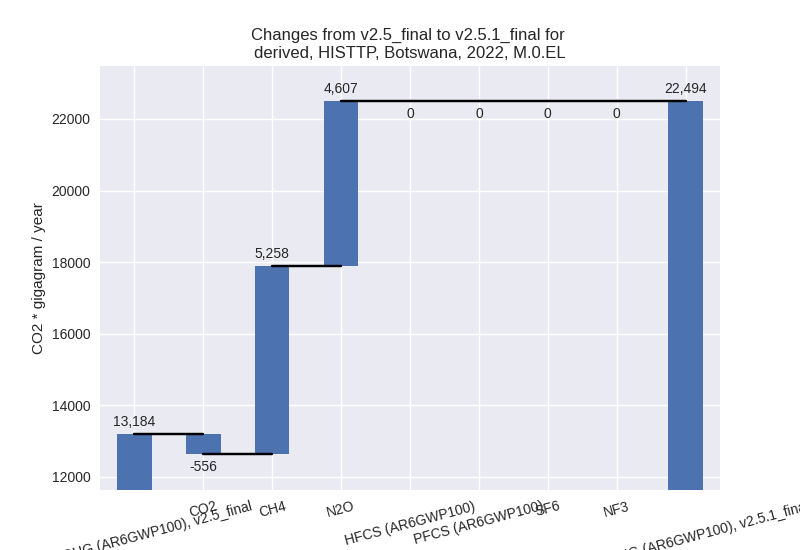
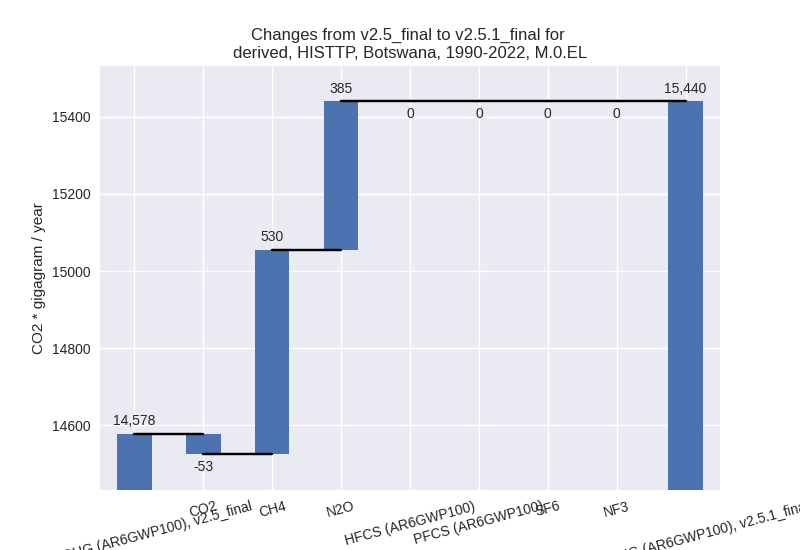
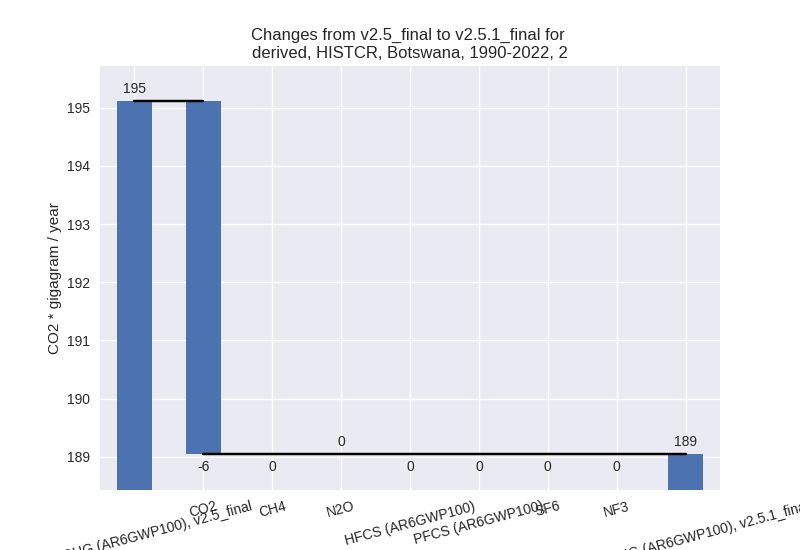
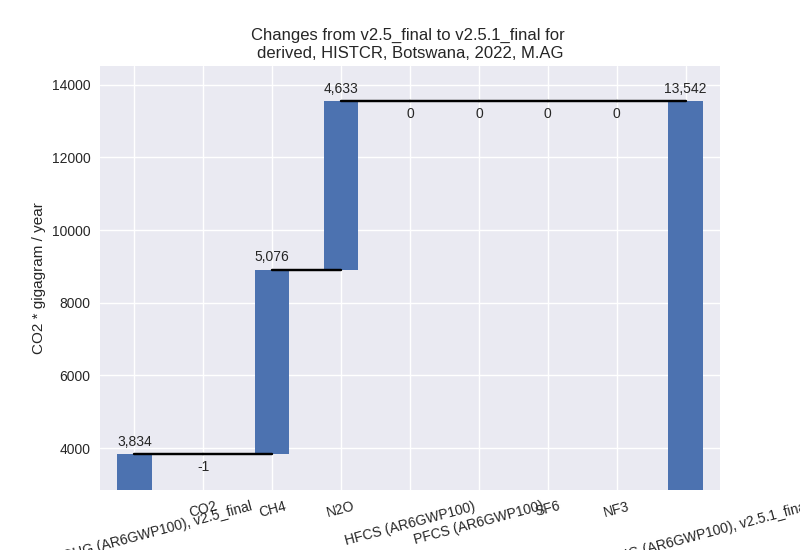
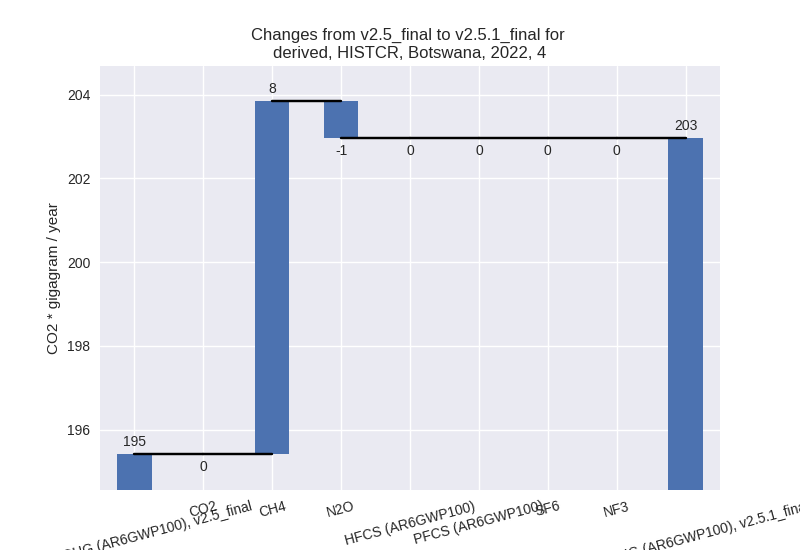
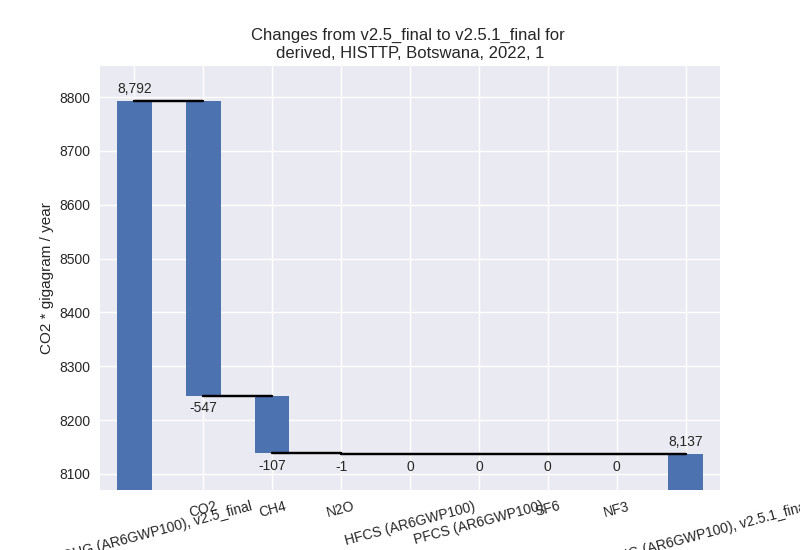
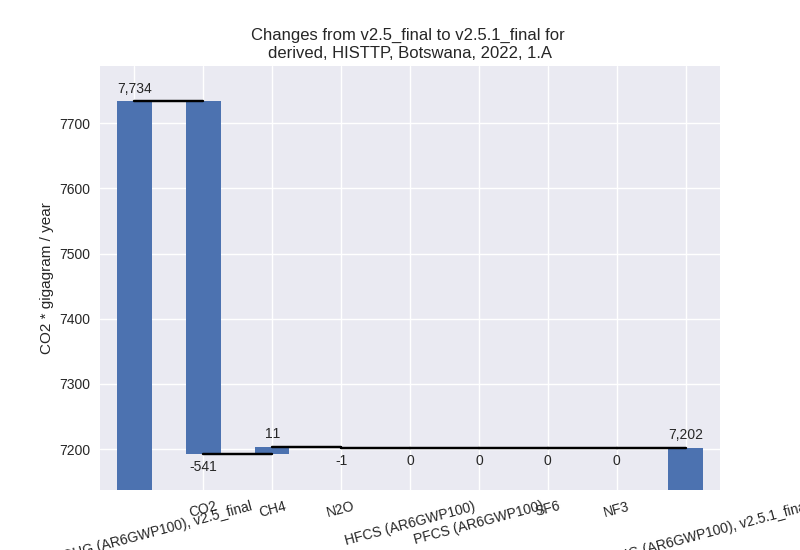
For each scenario and time frame the changes are displayed for all individual sectors and all individual gases. In the sector plot we use aggregate Kyoto GHGs in AR6GWP100. In the gas plot we usenational total emissions without LULUCF. ## country reported scenario
2022


1990-2022
third party scenario
2022

1990-2022

Detailed changes for the scenarios:
country reported scenario (HISTCR):
Most important changes per time frame
For 2022 the following sector-gas combinations have the highest absolute impact on national total KyotoGHG (AR6GWP100) emissions in 2022 (top 5):
- 1: M.AG.ELV, CH4 with 5206.70 Gg CO2 / year (617.6%)
- 2: M.AG.ELV, N2O with 4631.39 Gg CO2 / year (355.0%)
- 3: 1.A, CO2 with -686.67 Gg CO2 / year (-7.2%)
- 4: 3.A, CH4 with -130.28 Gg CO2 / year (-7.7%)
- 5: 1.B.1, CH4 with -85.57 Gg CO2 / year (-17.5%)
For 1990-2022 the following sector-gas combinations have the highest absolute impact on national total KyotoGHG (AR6GWP100) emissions in 1990-2022 (top 5):
- 1: M.AG.ELV, CH4 with 486.58 Gg CO2 / year (18.2%)
- 2: M.AG.ELV, N2O with 386.26 Gg CO2 / year (10.8%)
- 3: 1.A, CO2 with -57.39 Gg CO2 / year (-1.1%)
- 4: 3.A, CH4 with -11.09 Gg CO2 / year (-0.5%)
- 5: 2, CO2 with -6.06 Gg CO2 / year (-16.6%)
Changes in the main sectors for aggregate KyotoGHG (AR6GWP100) are
- 1: Total sectoral emissions in 2022 are 9490.13 Gg
CO2 / year which is 39.9% of M.0.EL emissions. 2022 Emissions have
changed by -7.5% (-767.59 Gg CO2 /
year). 1990-2022 Emissions have changed by -1.1% (-61.79 Gg CO2 / year). For 2022 the
changes per gas
are:

The changes come from the following subsectors:- 1.A: Total sectoral emissions in 2022 are 9068.25
Gg CO2 / year which is 95.6% of category 1 emissions. 2022 Emissions
have changed by -6.9% (-676.85 Gg
CO2 / year). 1990-2022 Emissions have changed by -1.1% (-57.12 Gg CO2 / year). For 2022 the
changes per gas
are:

There is no subsector information available in PRIMAP-hist. - 1.B.1: Total sectoral emissions in 2022 are 421.88
Gg CO2 / year which is 4.4% of category 1 emissions. 2022 Emissions have
changed by -17.7% (-90.75 Gg CO2 /
year). 1990-2022 Emissions have changed by -1.4% (-4.67 Gg CO2 / year). For 2022 the
changes per gas
are:

There is no subsector information available in PRIMAP-hist.
- 1.A: Total sectoral emissions in 2022 are 9068.25
Gg CO2 / year which is 95.6% of category 1 emissions. 2022 Emissions
have changed by -6.9% (-676.85 Gg
CO2 / year). 1990-2022 Emissions have changed by -1.1% (-57.12 Gg CO2 / year). For 2022 the
changes per gas
are:
- 2: Total sectoral emissions in 2022 are 482.27 Gg
CO2 / year which is 2.0% of M.0.EL emissions. 2022 Emissions have
changed by -1.6% (-7.76 Gg CO2 /
year). 1990-2022 Emissions have changed by -3.1% (-6.06 Gg CO2 / year). For 1990-2022
the changes per gas
are:
- M.AG: Total sectoral emissions in 2022 are 13542.08
Gg CO2 / year which is 56.9% of M.0.EL emissions. 2022 Emissions have
changed by 253.2% (9707.84 Gg CO2 /
year). 1990-2022 Emissions have changed by 10.0% (860.58 Gg CO2 / year). For 2022 the
changes per gas
are:
For 1990-2022 the changes per gas are:
The changes come from the following subsectors:- 3.A: Total sectoral emissions in 2022 are 1556.23
Gg CO2 / year which is 11.5% of category M.AG emissions. 2022 Emissions
have changed by -7.7% (-129.08 Gg
CO2 / year). 1990-2022 Emissions have changed by -0.5% (-11.22 Gg CO2 / year). For 2022 the
changes per gas
are:

There is no subsector information available in PRIMAP-hist. - M.AG.ELV: Total sectoral emissions in 2022 are
11985.85 Gg CO2 / year which is 88.5% of category M.AG emissions. 2022
Emissions have changed by 457.8%
(9836.93 Gg CO2 / year). 1990-2022 Emissions have changed by 13.9% (871.80 Gg CO2 / year). For 2022 the
changes per gas
are:

For 1990-2022 the changes per gas are: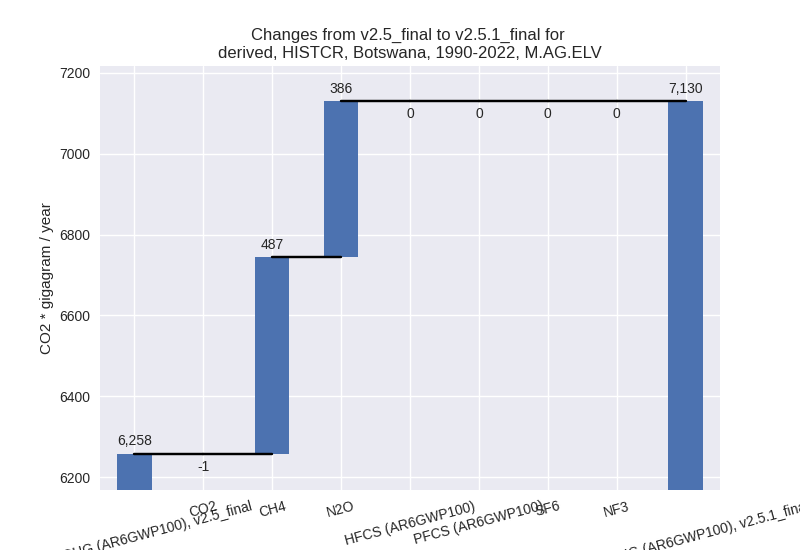
There is no subsector information available in PRIMAP-hist.
- 3.A: Total sectoral emissions in 2022 are 1556.23
Gg CO2 / year which is 11.5% of category M.AG emissions. 2022 Emissions
have changed by -7.7% (-129.08 Gg
CO2 / year). 1990-2022 Emissions have changed by -0.5% (-11.22 Gg CO2 / year). For 2022 the
changes per gas
are:
- 4: Total sectoral emissions in 2022 are 202.96 Gg
CO2 / year which is 0.9% of M.0.EL emissions. 2022 Emissions have
changed by 3.9% (7.55 Gg CO2 /
year). 1990-2022 Emissions have changed by 0.1% (0.23 Gg CO2 / year). For 2022 the
changes per gas
are:
- 5: Total sectoral emissions in 2022 are 66.63 Gg
CO2 / year which is 0.3% of M.0.EL emissions. 2022 Emissions have
changed by -25.8% (-23.20 Gg CO2 /
year). 1990-2022 Emissions have changed by -1.3% (-0.70 Gg CO2 / year). For 2022 the
changes per gas
are:

third party scenario (HISTTP):
Most important changes per time frame
For 2022 the following sector-gas combinations have the highest absolute impact on national total KyotoGHG (AR6GWP100) emissions in 2022 (top 5):
- 1: M.AG.ELV, CH4 with 5206.70 Gg CO2 / year (617.6%)
- 2: M.AG.ELV, N2O with 4631.39 Gg CO2 / year (355.0%)
- 3: 1.A, CO2 with -541.40 Gg CO2 / year (-7.2%)
- 4: 3.A, CH4 with 159.62 Gg CO2 / year (16.7%)
- 5: 1.B.1, CH4 with -118.78 Gg CO2 / year (-11.5%)
For 1990-2022 the following sector-gas combinations have the highest absolute impact on national total KyotoGHG (AR6GWP100) emissions in 1990-2022 (top 5):
- 1: M.AG.ELV, CH4 with 486.58 Gg CO2 / year (18.2%)
- 2: M.AG.ELV, N2O with 386.26 Gg CO2 / year (10.8%)
- 3: 1.A, CO2 with -45.25 Gg CO2 / year (-1.0%)
- 4: 1.B.1, CH4 with 43.73 Gg CO2 / year (8.0%)
- 5: 2, CO2 with -6.06 Gg CO2 / year (-16.6%)
Changes in the main sectors for aggregate KyotoGHG (AR6GWP100) are
- 1: Total sectoral emissions in 2022 are 8136.66 Gg
CO2 / year which is 36.2% of M.0.EL emissions. 2022 Emissions have
changed by -7.5% (-655.54 Gg CO2 /
year). 1990-2022 Emissions have changed by -0.0% (-1.47 Gg CO2 / year). For 2022 the
changes per gas
are:
The changes come from the following subsectors:- 1.A: Total sectoral emissions in 2022 are 7202.00
Gg CO2 / year which is 88.5% of category 1 emissions. 2022 Emissions
have changed by -6.9% (-531.57 Gg
CO2 / year). 1990-2022 Emissions have changed by -0.9% (-44.98 Gg CO2 / year). For 2022 the
changes per gas
are:
There is no subsector information available in PRIMAP-hist. - 1.B.1: Total sectoral emissions in 2022 are 934.66
Gg CO2 / year which is 11.5% of category 1 emissions. 2022 Emissions
have changed by -11.7% (-123.97 Gg
CO2 / year). 1990-2022 Emissions have changed by 7.8% (43.50 Gg CO2 / year). For 2022 the
changes per gas
are:

For 1990-2022 the changes per gas are:
There is no subsector information available in PRIMAP-hist.
- 1.A: Total sectoral emissions in 2022 are 7202.00
Gg CO2 / year which is 88.5% of category 1 emissions. 2022 Emissions
have changed by -6.9% (-531.57 Gg
CO2 / year). 1990-2022 Emissions have changed by -0.9% (-44.98 Gg CO2 / year). For 2022 the
changes per gas
are:
- 2: Total sectoral emissions in 2022 are 482.27 Gg
CO2 / year which is 2.1% of M.0.EL emissions. 2022 Emissions have
changed by -1.6% (-7.76 Gg CO2 /
year). 1990-2022 Emissions have changed by -3.1% (-6.06 Gg CO2 / year). For 1990-2022
the changes per gas
are:

- M.AG: Total sectoral emissions in 2022 are 13105.39
Gg CO2 / year which is 58.3% of M.0.EL emissions. 2022 Emissions have
changed by 321.7% (9997.75 Gg CO2 /
year). 1990-2022 Emissions have changed by 10.2% (870.97 Gg CO2 / year). For 2022 the
changes per gas
are:

For 1990-2022 the changes per gas are:
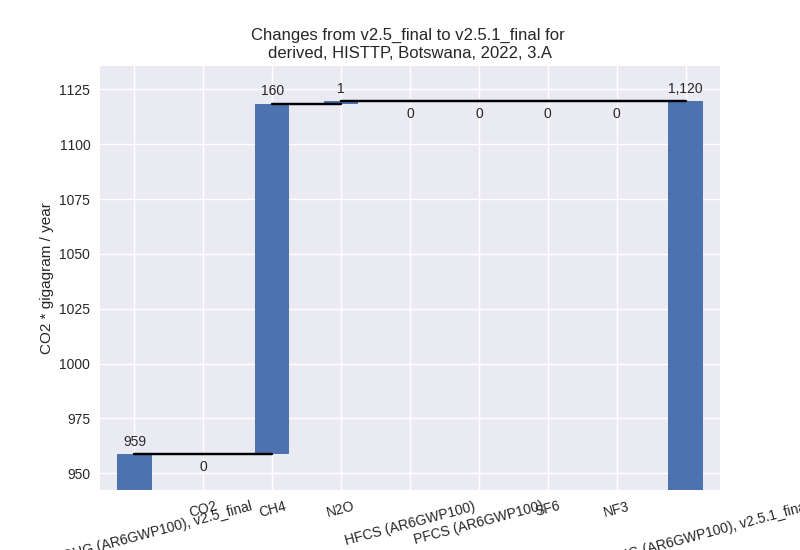
The changes come from the following subsectors:- 3.A: Total sectoral emissions in 2022 are 1119.54
Gg CO2 / year which is 8.5% of category M.AG emissions. 2022 Emissions
have changed by 16.8% (160.82 Gg CO2
/ year). 1990-2022 Emissions have changed by -0.0% (-0.83 Gg CO2 / year). For 2022 the
changes per gas
are:
There is no subsector information available in PRIMAP-hist. - M.AG.ELV: Total sectoral emissions in 2022 are
11985.85 Gg CO2 / year which is 91.5% of category M.AG emissions. 2022
Emissions have changed by 457.8%
(9836.93 Gg CO2 / year). 1990-2022 Emissions have changed by 13.9% (871.80 Gg CO2 / year). For 2022 the
changes per gas
are:

For 1990-2022 the changes per gas are:
There is no subsector information available in PRIMAP-hist.
- 3.A: Total sectoral emissions in 2022 are 1119.54
Gg CO2 / year which is 8.5% of category M.AG emissions. 2022 Emissions
have changed by 16.8% (160.82 Gg CO2
/ year). 1990-2022 Emissions have changed by -0.0% (-0.83 Gg CO2 / year). For 2022 the
changes per gas
are:
- 4: Total sectoral emissions in 2022 are 703.39 Gg CO2 / year which is 3.1% of M.0.EL emissions. 2022 Emissions have changed by -0.2% (-1.29 Gg CO2 / year). 1990-2022 Emissions have changed by -0.0% (-0.04 Gg CO2 / year).
- 5: Total sectoral emissions in 2022 are 66.63 Gg
CO2 / year which is 0.3% of M.0.EL emissions. 2022 Emissions have
changed by -25.8% (-23.20 Gg CO2 /
year). 1990-2022 Emissions have changed by -1.3% (-0.70 Gg CO2 / year). For 2022 the
changes per gas
are:
