Changes in PRIMAP-hist v2.5.1_final compared to v2.5_final for Central African Republic
2024-02-29
Johannes Gütschow
Change analysis for Central African Republic for PRIMAP-hist v2.5.1_final compared to v2.5_final
Overview over emissions by sector and gas
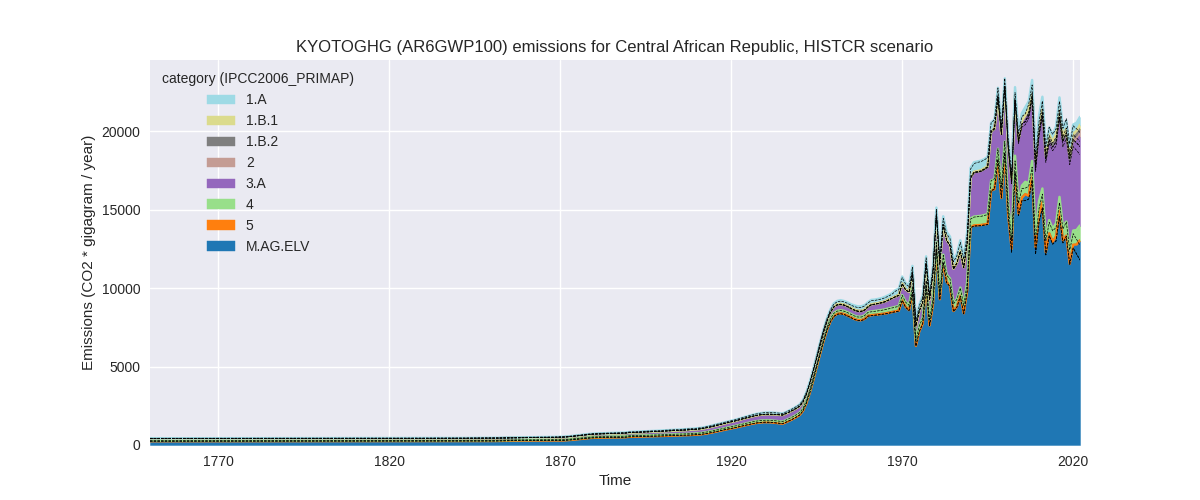
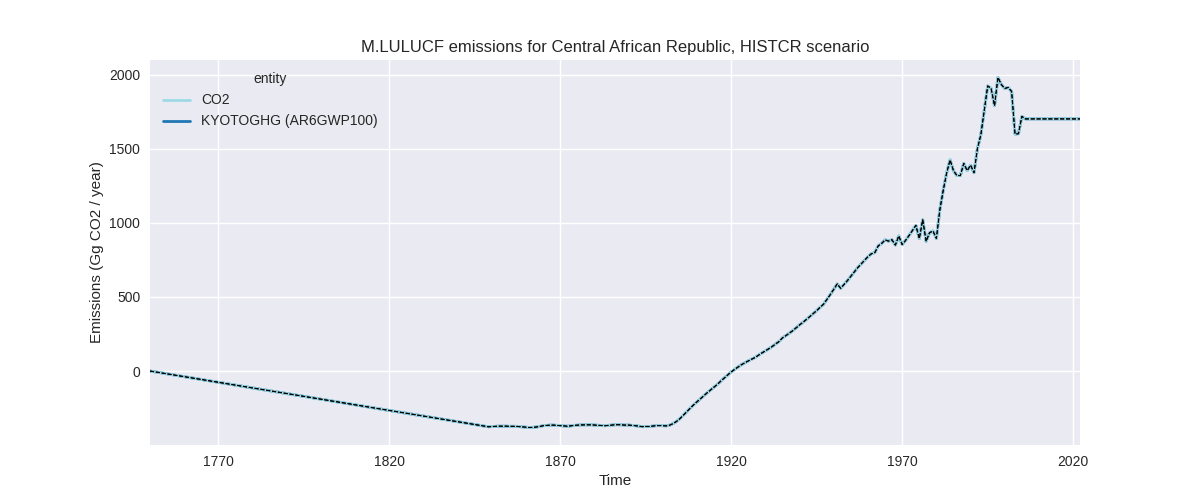
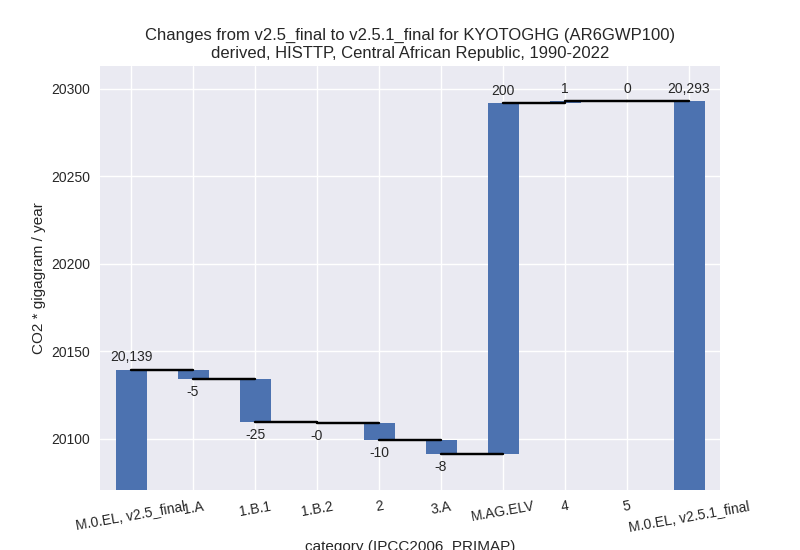
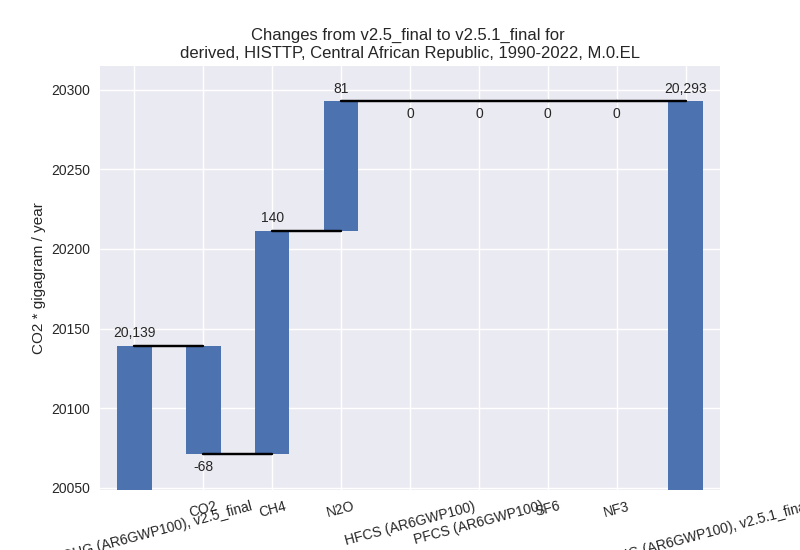
The following figures show the aggregate national total emissions excluding LULUCF AR6GWP100 for the country reported priority scenario. The dotted linesshow the v2.5_final data.

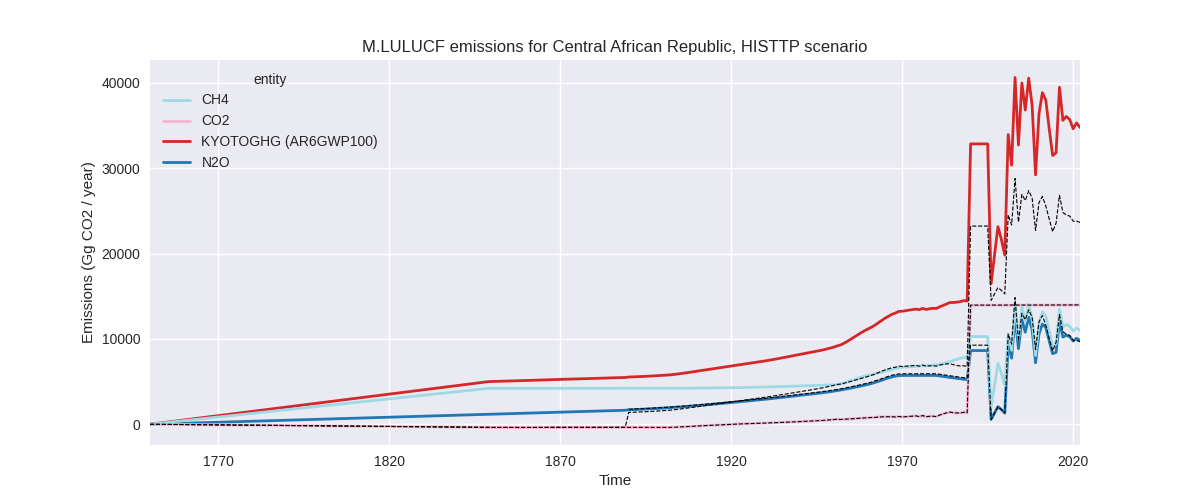
The following figures show the aggregate national total emissions excluding LULUCF AR6GWP100 for the third party priority scenario. The dotted linesshow the v2.5_final data.


Overview over changes
In the country reported priority scenario we have the following changes for aggregate Kyoto GHG and national total emissions excluding LULUCF (M.0.EL):
- Emissions in 2022 have changed by 5.0%% (1001.17 Gg CO2 / year)
- Emissions in 1990-2022 have changed by 0.8%% (153.36 Gg CO2 / year)
In the third party priority scenario we have the following changes for aggregate Kyoto GHG and national total emissions excluding LULUCF (M.0.EL):
- Emissions in 2022 have changed by 5.0%% (1001.17 Gg CO2 / year)
- Emissions in 1990-2022 have changed by 0.8%% (153.36 Gg CO2 / year)
Most important changes per scenario and time frame
In the country reported priority scenario the following sector-gas combinations have the highest absolute impact on national total KyotoGHG (AR6GWP100) emissions in 2022 (top 5):
- 1: M.AG.ELV, CH4 with 834.84 Gg CO2 / year (18.0%)
- 2: M.AG.ELV, N2O with 408.32 Gg CO2 / year (5.7%)
- 3: 3.A, CH4 with -122.41 Gg CO2 / year (-2.2%)
- 4: 1.A, CO2 with -109.95 Gg CO2 / year (-39.0%)
- 5: 1.B.1, CH4 with -73.72 Gg CO2 / year (-23.2%)
In the country reported priority scenario the following sector-gas combinations have the highest absolute impact on national total KyotoGHG (AR6GWP100) emissions in 1990-2022 (top 5):
- 1: M.AG.ELV, CH4 with 124.48 Gg CO2 / year (1.9%)
- 2: M.AG.ELV, N2O with 76.42 Gg CO2 / year (1.0%)
- 3: 1.A, CO2 with -58.08 Gg CO2 / year (-22.4%)
- 4: 1.A, CH4 with 47.57 Gg CO2 / year (20.1%)
- 5: 1.B.1, CH4 with -24.57 Gg CO2 / year (-16.9%)
In the third party priority scenario the following sector-gas combinations have the highest absolute impact on national total KyotoGHG (AR6GWP100) emissions in 2022 (top 5):
- 1: M.AG.ELV, CH4 with 834.84 Gg CO2 / year (18.0%)
- 2: M.AG.ELV, N2O with 408.32 Gg CO2 / year (5.7%)
- 3: 3.A, CH4 with -122.41 Gg CO2 / year (-2.2%)
- 4: 1.A, CO2 with -109.95 Gg CO2 / year (-39.0%)
- 5: 1.B.1, CH4 with -73.72 Gg CO2 / year (-23.2%)
In the third party priority scenario the following sector-gas combinations have the highest absolute impact on national total KyotoGHG (AR6GWP100) emissions in 1990-2022 (top 5):
- 1: M.AG.ELV, CH4 with 124.48 Gg CO2 / year (1.9%)
- 2: M.AG.ELV, N2O with 76.42 Gg CO2 / year (1.0%)
- 3: 1.A, CO2 with -58.08 Gg CO2 / year (-22.4%)
- 4: 1.A, CH4 with 47.57 Gg CO2 / year (20.1%)
- 5: 1.B.1, CH4 with -24.57 Gg CO2 / year (-16.9%)
Notes on data changes
Here we list notes explaining important emissions changes for the country. ’' means that the following text only applies to the TP time series, while means that it only applies to the CR scenario. Otherwise the note applies to both scenarios.
General note: We have no country reported data for Central African Republic, thus the CR and TP time-series are identical except for LULUCF.
- M.AG.ELV, CH4: New FAO data with an additional year of data have changed emissions for 2021 and 2022. Emissions for other years have changed slightly in the new FAO data.
- M.AG.ELV, N2O: New FAO data with an additional year of data have changed emissions for 2021 and 2022. Emissions for other years have changed slightly in the new FAO data.
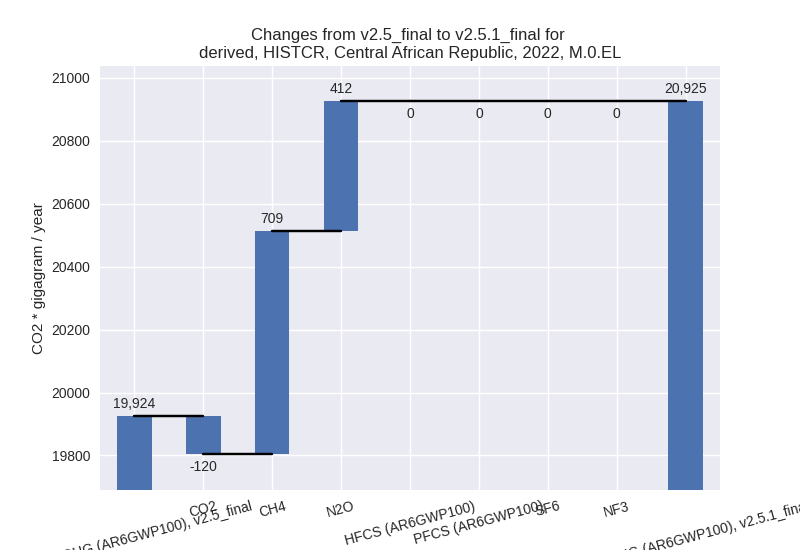
Changes by sector and gas
For each scenario and time frame the changes are displayed for all individual sectors and all individual gases. In the sector plot we use aggregate Kyoto GHGs in AR6GWP100. In the gas plot we usenational total emissions without LULUCF. ## country reported scenario
2022

1990-2022


third party scenario
2022


1990-2022
Detailed changes for the scenarios:
country reported scenario (HISTCR):
Most important changes per time frame
For 2022 the following sector-gas combinations have the highest absolute impact on national total KyotoGHG (AR6GWP100) emissions in 2022 (top 5):
- 1: M.AG.ELV, CH4 with 834.84 Gg CO2 / year (18.0%)
- 2: M.AG.ELV, N2O with 408.32 Gg CO2 / year (5.7%)
- 3: 3.A, CH4 with -122.41 Gg CO2 / year (-2.2%)
- 4: 1.A, CO2 with -109.95 Gg CO2 / year (-39.0%)
- 5: 1.B.1, CH4 with -73.72 Gg CO2 / year (-23.2%)
For 1990-2022 the following sector-gas combinations have the highest absolute impact on national total KyotoGHG (AR6GWP100) emissions in 1990-2022 (top 5):
- 1: M.AG.ELV, CH4 with 124.48 Gg CO2 / year (1.9%)
- 2: M.AG.ELV, N2O with 76.42 Gg CO2 / year (1.0%)
- 3: 1.A, CO2 with -58.08 Gg CO2 / year (-22.4%)
- 4: 1.A, CH4 with 47.57 Gg CO2 / year (20.1%)
- 5: 1.B.1, CH4 with -24.57 Gg CO2 / year (-16.9%)
Changes in the main sectors for aggregate KyotoGHG (AR6GWP100) are
- 1: Total sectoral emissions in 2022 are 749.89 Gg
CO2 / year which is 3.6% of M.0.EL emissions. 2022 Emissions have
changed by -15.8% (-140.31 Gg CO2 /
year). 1990-2022 Emissions have changed by -4.4% (-30.10 Gg CO2 / year). For 2022 the
changes per gas
are:

For 1990-2022 the changes per gas are:
The changes come from the following subsectors:- 1.A: Total sectoral emissions in 2022 are 502.40 Gg
CO2 / year which is 67.0% of category 1 emissions. 2022 Emissions have
changed by -11.5% (-65.19 Gg CO2 /
year). 1990-2022 Emissions have changed by -1.0% (-5.11 Gg CO2 / year). For 2022 the
changes per gas
are:

There is no subsector information available in PRIMAP-hist. - 1.B.1: Total sectoral emissions in 2022 are 247.49
Gg CO2 / year which is 33.0% of category 1 emissions. 2022 Emissions
have changed by -23.2% (-74.70 Gg
CO2 / year). 1990-2022 Emissions have changed by -16.9% (-24.90 Gg CO2 / year). For 2022
the changes per gas
are:
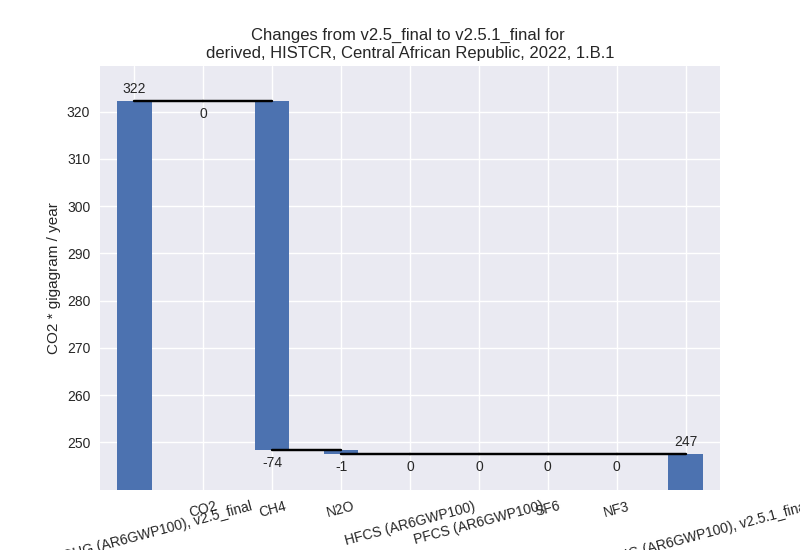
For 1990-2022 the changes per gas are:
There is no subsector information available in PRIMAP-hist. - 1.B.2: Total sectoral emissions in 2022 are 0.00 Gg
CO2 / year which is 0.0% of category 1 emissions. 2022 Emissions have
changed by -99.6% (-0.42 Gg CO2 /
year). 1990-2022 Emissions have changed by -98.2% (-0.09 Gg CO2 / year). For 2022 the
changes per gas
are:

For 1990-2022 the changes per gas are:
There is no subsector information available in PRIMAP-hist.
- 1.A: Total sectoral emissions in 2022 are 502.40 Gg
CO2 / year which is 67.0% of category 1 emissions. 2022 Emissions have
changed by -11.5% (-65.19 Gg CO2 /
year). 1990-2022 Emissions have changed by -1.0% (-5.11 Gg CO2 / year). For 2022 the
changes per gas
are:
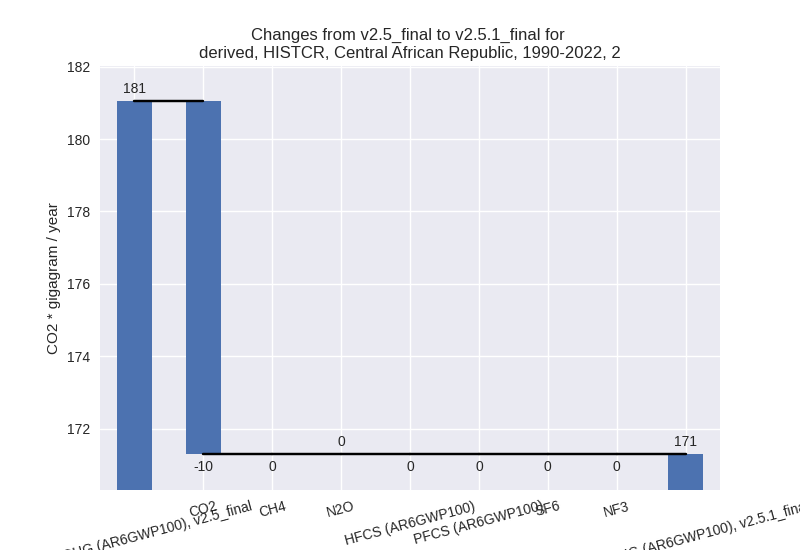
- 2: Total sectoral emissions in 2022 are 500.97 Gg
CO2 / year which is 2.4% of M.0.EL emissions. 2022 Emissions have
changed by -1.8% (-9.26 Gg CO2 /
year). 1990-2022 Emissions have changed by -5.4% (-9.74 Gg CO2 / year). For 1990-2022
the changes per gas
are:
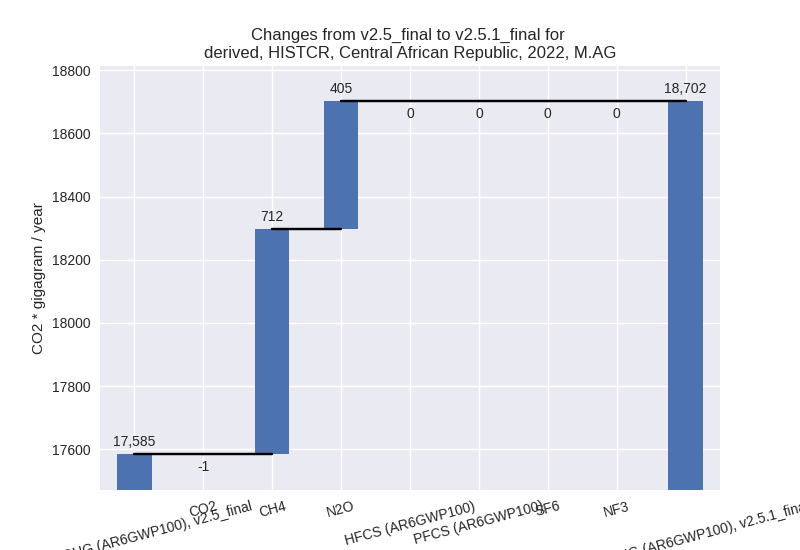
- M.AG: Total sectoral emissions in 2022 are 18701.54
Gg CO2 / year which is 89.4% of M.0.EL emissions. 2022 Emissions have
changed by 6.4% (1116.71 Gg CO2 /
year). 1990-2022 Emissions have changed by 1.0% (192.17 Gg CO2 / year). For 2022 the
changes per gas
are:
The changes come from the following subsectors:- 3.A: Total sectoral emissions in 2022 are 5673.68
Gg CO2 / year which is 30.3% of category M.AG emissions. 2022 Emissions
have changed by -2.2% (-125.89 Gg
CO2 / year). 1990-2022 Emissions have changed by -0.2% (-8.29 Gg CO2 / year). For 2022 the
changes per gas
are:

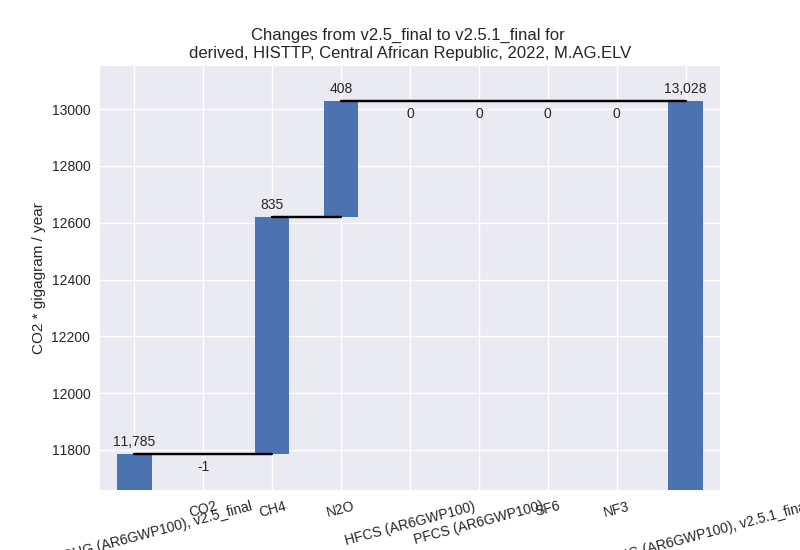
There is no subsector information available in PRIMAP-hist. - M.AG.ELV: Total sectoral emissions in 2022 are
13027.86 Gg CO2 / year which is 69.7% of category M.AG emissions. 2022
Emissions have changed by 10.5%
(1242.60 Gg CO2 / year). 1990-2022 Emissions have changed by 1.4% (200.46 Gg CO2 / year). For 2022 the
changes per gas
are:

There is no subsector information available in PRIMAP-hist.
- 3.A: Total sectoral emissions in 2022 are 5673.68
Gg CO2 / year which is 30.3% of category M.AG emissions. 2022 Emissions
have changed by -2.2% (-125.89 Gg
CO2 / year). 1990-2022 Emissions have changed by -0.2% (-8.29 Gg CO2 / year). For 2022 the
changes per gas
are:
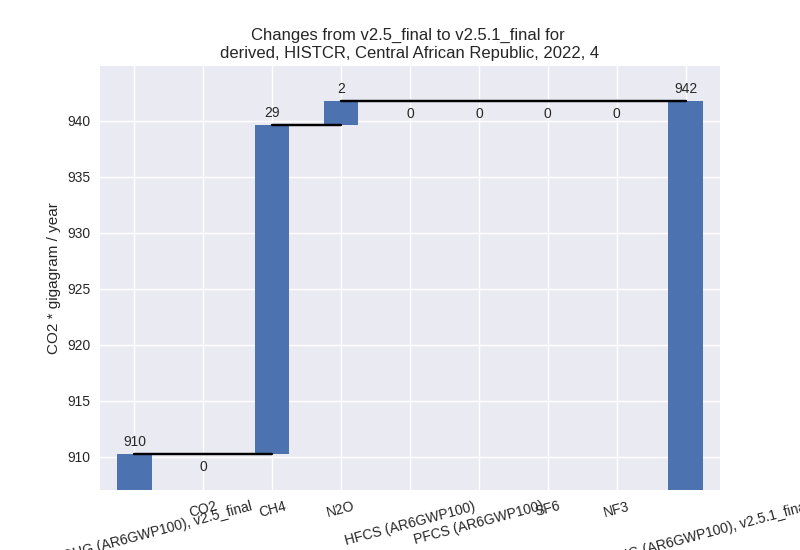
- 4: Total sectoral emissions in 2022 are 941.75 Gg
CO2 / year which is 4.5% of M.0.EL emissions. 2022 Emissions have
changed by 3.5% (31.50 Gg CO2 /
year). 1990-2022 Emissions have changed by 0.1% (0.95 Gg CO2 / year). For 2022 the
changes per gas
are:
- 5: Total sectoral emissions in 2022 are 30.81 Gg
CO2 / year which is 0.1% of M.0.EL emissions. 2022 Emissions have
changed by 9.0% (2.53 Gg CO2 /
year). 1990-2022 Emissions have changed by 0.4% (0.08 Gg CO2 / year). For 2022 the
changes per gas
are:

third party scenario (HISTTP):
Most important changes per time frame
For 2022 the following sector-gas combinations have the highest absolute impact on national total KyotoGHG (AR6GWP100) emissions in 2022 (top 5):
- 1: M.AG.ELV, CH4 with 834.84 Gg CO2 / year (18.0%)
- 2: M.AG.ELV, N2O with 408.32 Gg CO2 / year (5.7%)
- 3: 3.A, CH4 with -122.41 Gg CO2 / year (-2.2%)
- 4: 1.A, CO2 with -109.95 Gg CO2 / year (-39.0%)
- 5: 1.B.1, CH4 with -73.72 Gg CO2 / year (-23.2%)
For 1990-2022 the following sector-gas combinations have the highest absolute impact on national total KyotoGHG (AR6GWP100) emissions in 1990-2022 (top 5):
- 1: M.AG.ELV, CH4 with 124.48 Gg CO2 / year (1.9%)
- 2: M.AG.ELV, N2O with 76.42 Gg CO2 / year (1.0%)
- 3: 1.A, CO2 with -58.08 Gg CO2 / year (-22.4%)
- 4: 1.A, CH4 with 47.57 Gg CO2 / year (20.1%)
- 5: 1.B.1, CH4 with -24.57 Gg CO2 / year (-16.9%)
Changes in the main sectors for aggregate KyotoGHG (AR6GWP100) are
- 1: Total sectoral emissions in 2022 are 749.89 Gg
CO2 / year which is 3.6% of M.0.EL emissions. 2022 Emissions have
changed by -15.8% (-140.31 Gg CO2 /
year). 1990-2022 Emissions have changed by -4.4% (-30.10 Gg CO2 / year). For 2022 the
changes per gas
are:

For 1990-2022 the changes per gas are: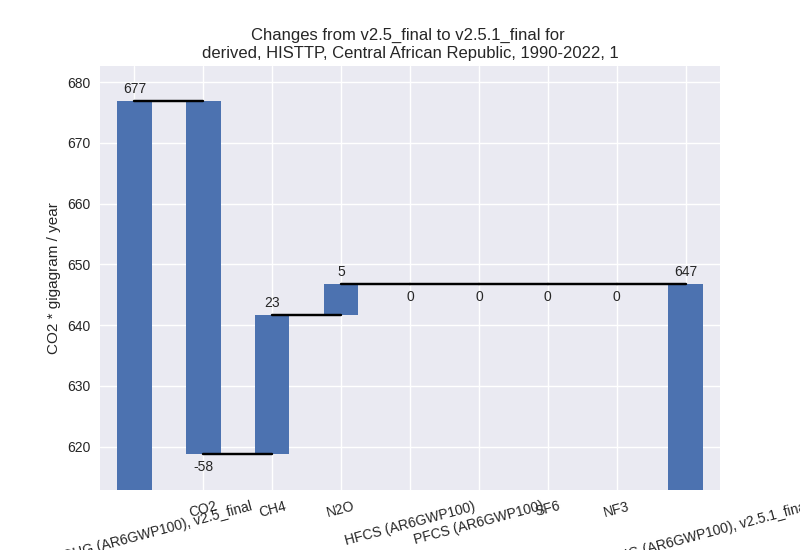
The changes come from the following subsectors:- 1.A: Total sectoral emissions in 2022 are 502.40 Gg
CO2 / year which is 67.0% of category 1 emissions. 2022 Emissions have
changed by -11.5% (-65.19 Gg CO2 /
year). 1990-2022 Emissions have changed by -1.0% (-5.11 Gg CO2 / year). For 2022 the
changes per gas
are:
There is no subsector information available in PRIMAP-hist. - 1.B.1: Total sectoral emissions in 2022 are 247.49
Gg CO2 / year which is 33.0% of category 1 emissions. 2022 Emissions
have changed by -23.2% (-74.70 Gg
CO2 / year). 1990-2022 Emissions have changed by -16.9% (-24.90 Gg CO2 / year). For 2022
the changes per gas
are:

For 1990-2022 the changes per gas are:
There is no subsector information available in PRIMAP-hist. - 1.B.2: Total sectoral emissions in 2022 are 0.00 Gg
CO2 / year which is 0.0% of category 1 emissions. 2022 Emissions have
changed by -99.6% (-0.42 Gg CO2 /
year). 1990-2022 Emissions have changed by -98.2% (-0.09 Gg CO2 / year). For 2022 the
changes per gas
are:
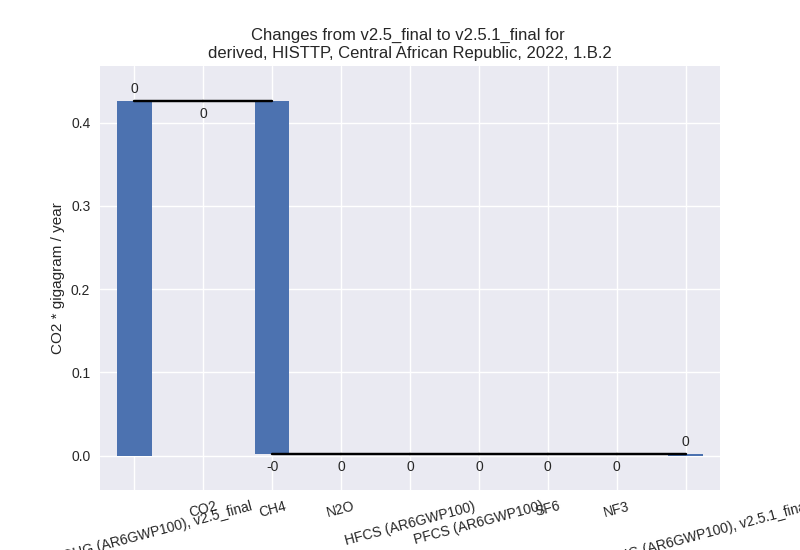
For 1990-2022 the changes per gas are: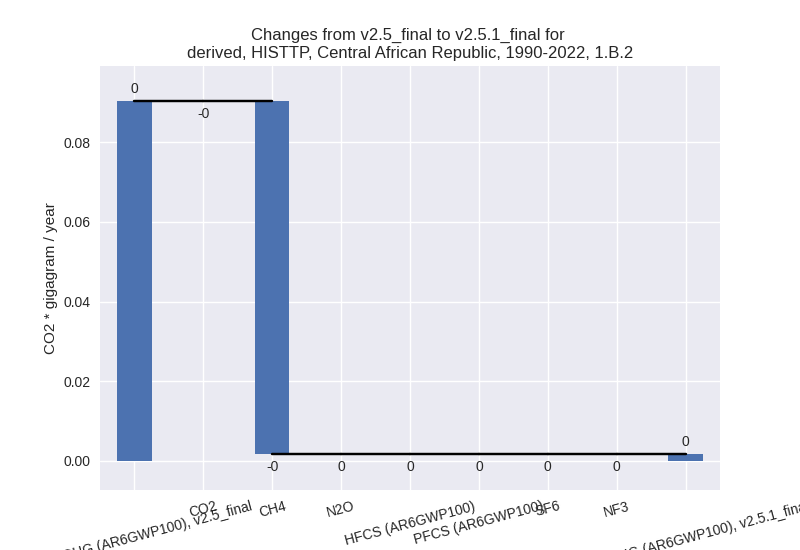
There is no subsector information available in PRIMAP-hist.
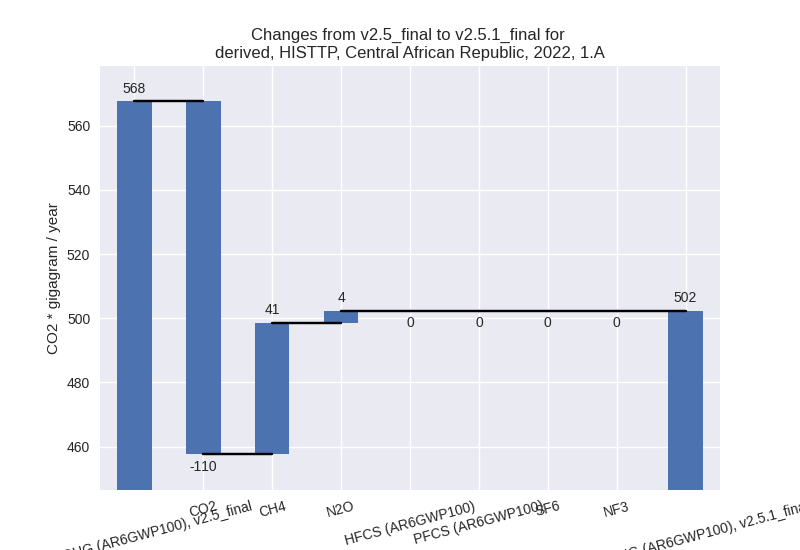
- 1.A: Total sectoral emissions in 2022 are 502.40 Gg
CO2 / year which is 67.0% of category 1 emissions. 2022 Emissions have
changed by -11.5% (-65.19 Gg CO2 /
year). 1990-2022 Emissions have changed by -1.0% (-5.11 Gg CO2 / year). For 2022 the
changes per gas
are:
- 2: Total sectoral emissions in 2022 are 500.97 Gg
CO2 / year which is 2.4% of M.0.EL emissions. 2022 Emissions have
changed by -1.8% (-9.26 Gg CO2 /
year). 1990-2022 Emissions have changed by -5.4% (-9.74 Gg CO2 / year). For 1990-2022
the changes per gas
are:

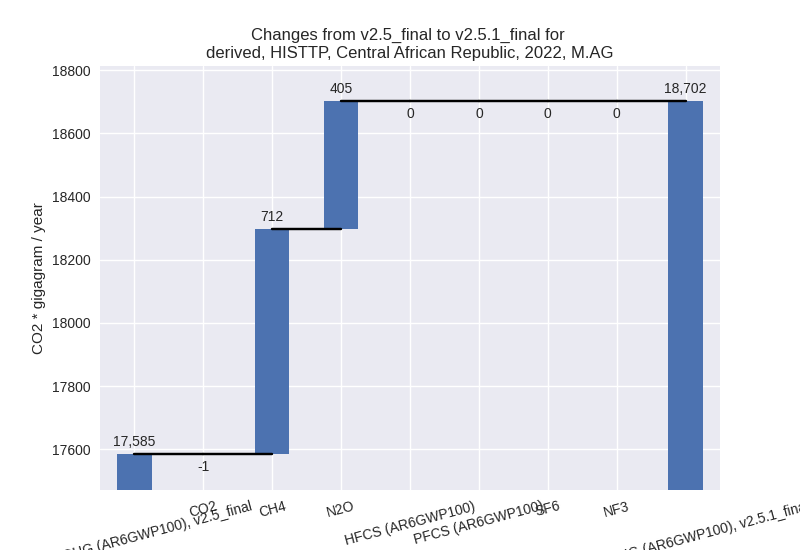
- M.AG: Total sectoral emissions in 2022 are 18701.54
Gg CO2 / year which is 89.4% of M.0.EL emissions. 2022 Emissions have
changed by 6.4% (1116.71 Gg CO2 /
year). 1990-2022 Emissions have changed by 1.0% (192.17 Gg CO2 / year). For 2022 the
changes per gas
are:
The changes come from the following subsectors:- 3.A: Total sectoral emissions in 2022 are 5673.68
Gg CO2 / year which is 30.3% of category M.AG emissions. 2022 Emissions
have changed by -2.2% (-125.89 Gg
CO2 / year). 1990-2022 Emissions have changed by -0.2% (-8.29 Gg CO2 / year). For 2022 the
changes per gas
are:
There is no subsector information available in PRIMAP-hist. - M.AG.ELV: Total sectoral emissions in 2022 are
13027.86 Gg CO2 / year which is 69.7% of category M.AG emissions. 2022
Emissions have changed by 10.5%
(1242.60 Gg CO2 / year). 1990-2022 Emissions have changed by 1.4% (200.46 Gg CO2 / year). For 2022 the
changes per gas
are:
There is no subsector information available in PRIMAP-hist.
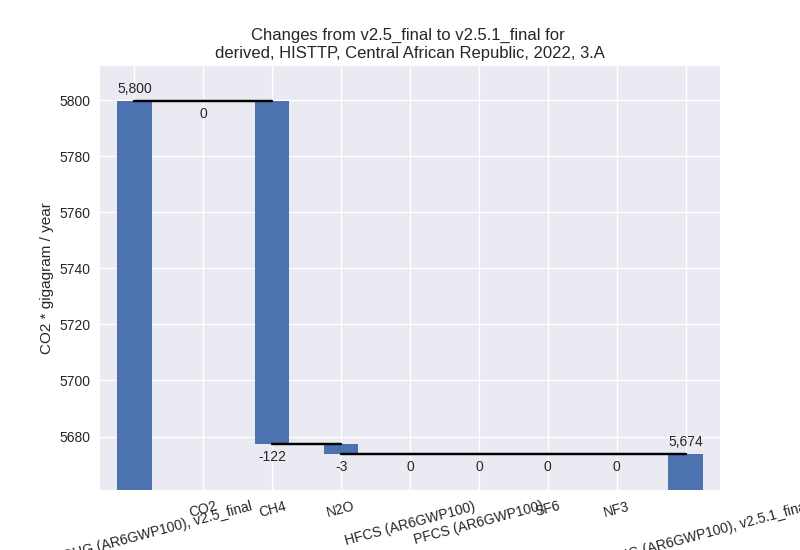
- 3.A: Total sectoral emissions in 2022 are 5673.68
Gg CO2 / year which is 30.3% of category M.AG emissions. 2022 Emissions
have changed by -2.2% (-125.89 Gg
CO2 / year). 1990-2022 Emissions have changed by -0.2% (-8.29 Gg CO2 / year). For 2022 the
changes per gas
are:
- 4: Total sectoral emissions in 2022 are 941.75 Gg
CO2 / year which is 4.5% of M.0.EL emissions. 2022 Emissions have
changed by 3.5% (31.50 Gg CO2 /
year). 1990-2022 Emissions have changed by 0.1% (0.95 Gg CO2 / year). For 2022 the
changes per gas
are:

- 5: Total sectoral emissions in 2022 are 30.81 Gg
CO2 / year which is 0.1% of M.0.EL emissions. 2022 Emissions have
changed by 9.0% (2.53 Gg CO2 /
year). 1990-2022 Emissions have changed by 0.4% (0.08 Gg CO2 / year). For 2022 the
changes per gas
are:
