Changes in PRIMAP-hist v2.5.1_final compared to v2.5_final for Canada
2024-02-29
Johannes Gütschow
Change analysis for Canada for PRIMAP-hist v2.5.1_final compared to v2.5_final
Overview over emissions by sector and gas
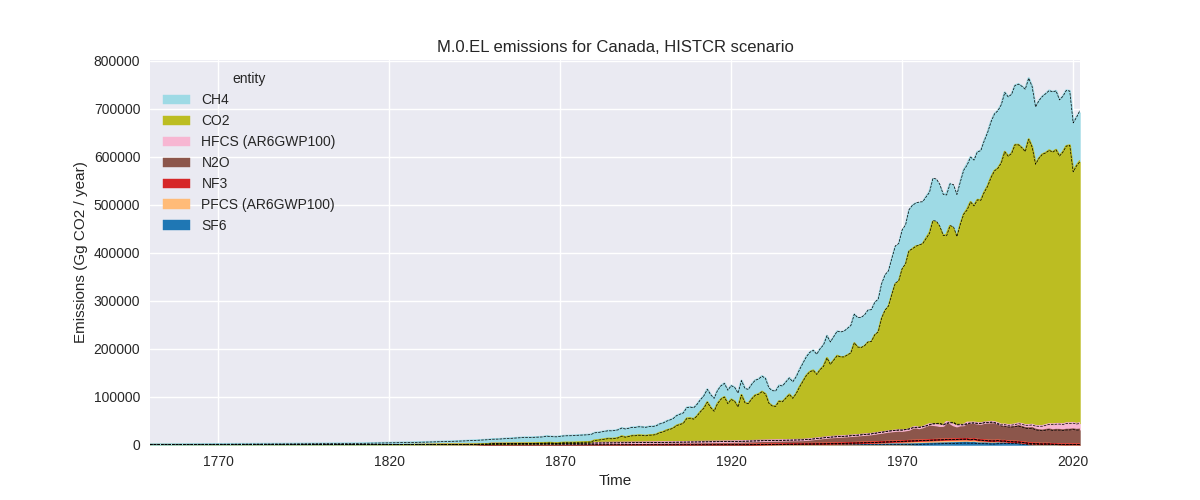
The following figures show the aggregate national total emissions excluding LULUCF AR6GWP100 for the country reported priority scenario. The dotted linesshow the v2.5_final data.


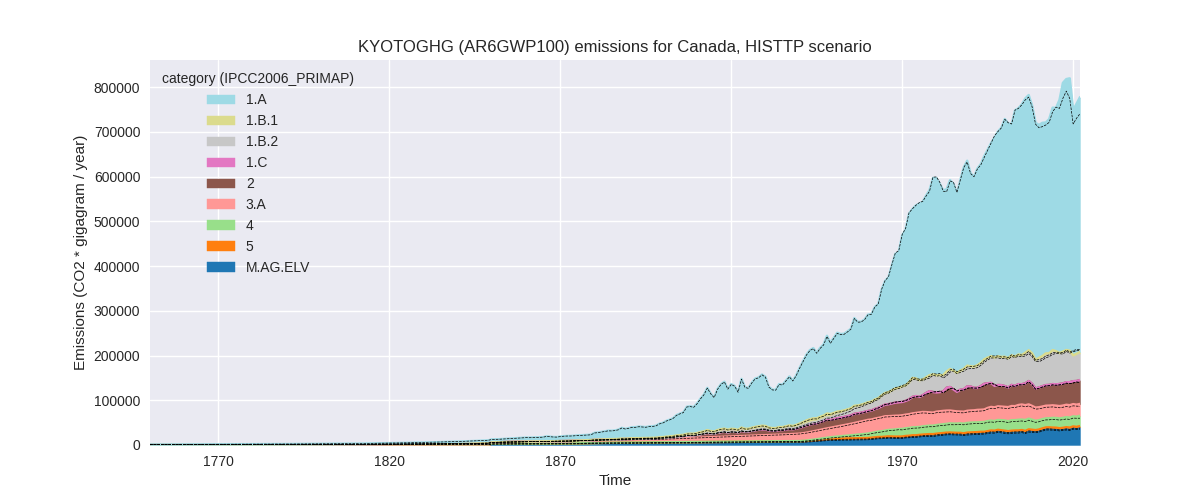
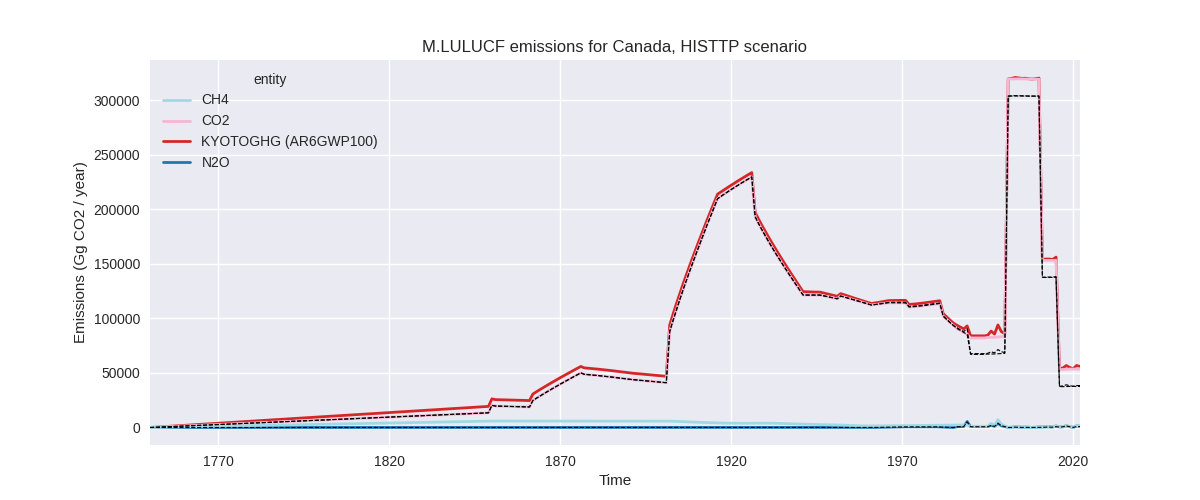
The following figures show the aggregate national total emissions excluding LULUCF AR6GWP100 for the third party priority scenario. The dotted linesshow the v2.5_final data.

Overview over changes
In the country reported priority scenario we have the following changes for aggregate Kyoto GHG and national total emissions excluding LULUCF (M.0.EL):
- Emissions in 2022 have changed by -0.5%% (-3791.48 Gg CO2 / year)
- Emissions in 1990-2022 have changed by -0.0%% (-274.75 Gg CO2 / year)
In the third party priority scenario we have the following changes for aggregate Kyoto GHG and national total emissions excluding LULUCF (M.0.EL):
- Emissions in 2022 have changed by 5.0%% (37050.81 Gg CO2 / year)
- Emissions in 1990-2022 have changed by 1.2%% (8417.91 Gg CO2 / year)
Most important changes per scenario and time frame
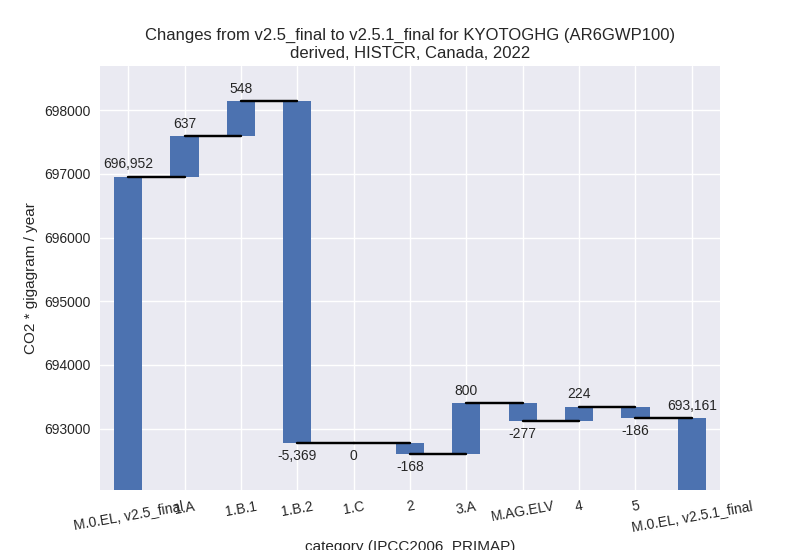
In the country reported priority scenario the following sector-gas combinations have the highest absolute impact on national total KyotoGHG (AR6GWP100) emissions in 2022 (top 5):
- 1: 1.B.2, CH4 with -5365.47 Gg CO2 / year (-11.2%)
- 2: 3.A, CH4 with 766.87 Gg CO2 / year (2.5%)
- 3: 1.A, N2O with 662.23 Gg CO2 / year (16.7%)
- 4: 1.B.1, CO2 with 619.80 Gg CO2 / year (465.0%)
- 5: 2, CO2 with -378.41 Gg CO2 / year (-1.0%)
In the country reported priority scenario the following sector-gas combinations have the highest absolute impact on national total KyotoGHG (AR6GWP100) emissions in 1990-2022 (top 5):
- 1: 1.B.2, CH4 with -162.59 Gg CO2 / year (-0.3%)
- 2: 1.B.1, CO2 with -141.07 Gg CO2 / year (-15.0%)
- 3: 3.A, CH4 with 23.24 Gg CO2 / year (0.1%)
- 4: 1.A, N2O with 20.07 Gg CO2 / year (0.3%)
- 5: 2, CO2 with -11.47 Gg CO2 / year (-0.0%)
In the third party priority scenario the following sector-gas combinations have the highest absolute impact on national total KyotoGHG (AR6GWP100) emissions in 2022 (top 5):
- 1: 1.A, CO2 with 42966.82 Gg CO2 / year (8.3%)
- 2: 1.B.2, CH4 with -11888.01 Gg CO2 / year (-17.1%)
- 3: M.AG.ELV, N2O with 2777.08 Gg CO2 / year (8.7%)
- 4: M.AG.ELV, CO2 with 1468.44 Gg CO2 / year (50.1%)
- 5: 4, CH4 with 810.99 Gg CO2 / year (3.8%)
In the third party priority scenario the following sector-gas combinations have the highest absolute impact on national total KyotoGHG (AR6GWP100) emissions in 1990-2022 (top 5):
- 1: 1.A, CO2 with 8157.21 Gg CO2 / year (1.6%)
- 2: M.AG.ELV, N2O with 2569.18 Gg CO2 / year (9.9%)
- 3: 2, CO2 with -1800.97 Gg CO2 / year (-6.3%)
- 4: 1.B.2, CH4 with -1516.44 Gg CO2 / year (-2.6%)
- 5: M.AG.ELV, CO2 with 761.20 Gg CO2 / year (40.2%)
Notes on data changes
Here we list notes explaining important emissions changes for the country. ’' means that the following text only applies to the TP time series, while means that it only applies to the CR scenario. Otherwise the note applies to both scenarios.
- 1.A, CO2: Updated CDIAC emissions are higher in 2017 leading to changes in PRIMAP-hist for the last years.
- 1.B.2, CH4: EDGAR 8.0 emissions drop in 2020 which is not the case for EDGAR 7.0. Thus PRIMAP-hist emissions are lower for the latest years.
Changes by sector and gas
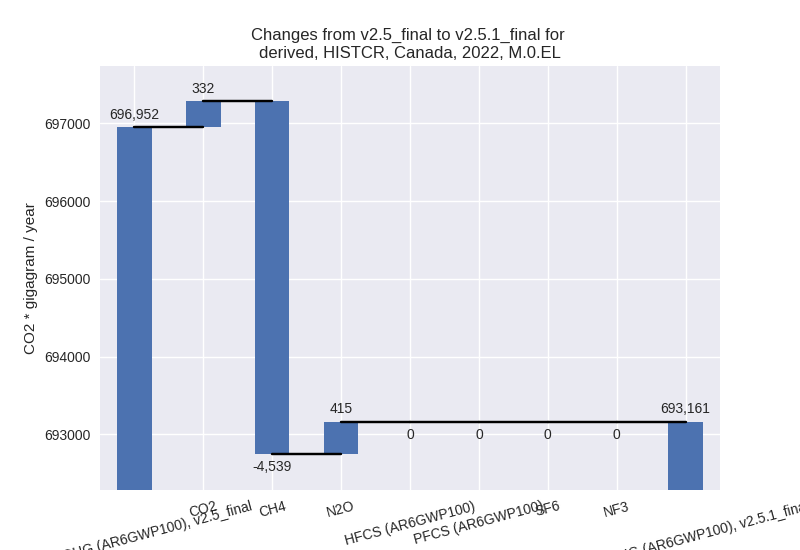
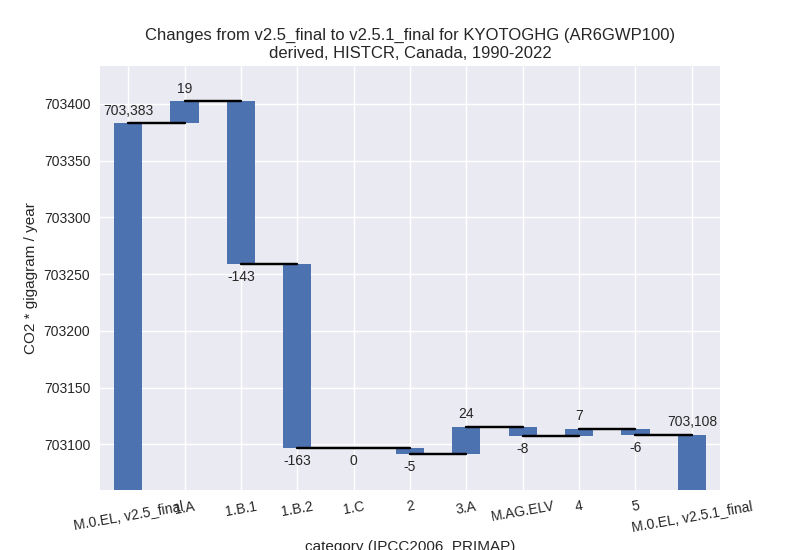
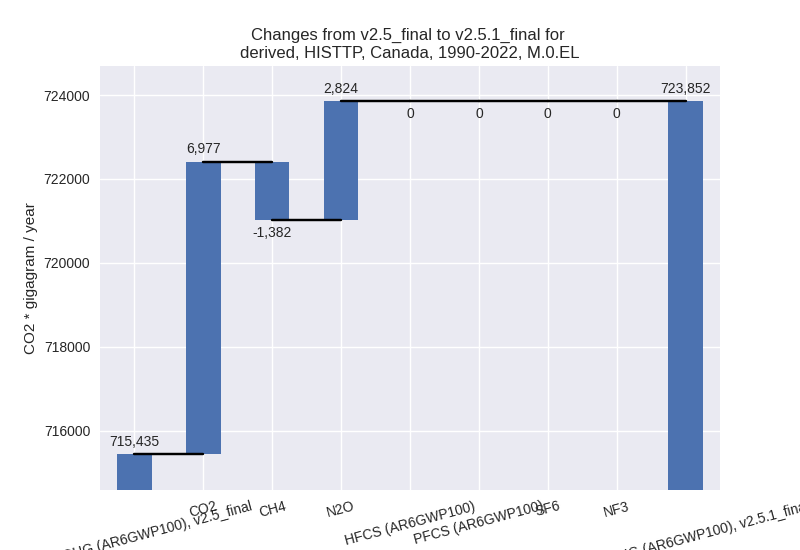
For each scenario and time frame the changes are displayed for all individual sectors and all individual gases. In the sector plot we use aggregate Kyoto GHGs in AR6GWP100. In the gas plot we usenational total emissions without LULUCF. ## country reported scenario
2022
1990-2022

third party scenario
2022


1990-2022

Detailed changes for the scenarios:
country reported scenario (HISTCR):
Most important changes per time frame
For 2022 the following sector-gas combinations have the highest absolute impact on national total KyotoGHG (AR6GWP100) emissions in 2022 (top 5):
- 1: 1.B.2, CH4 with -5365.47 Gg CO2 / year (-11.2%)
- 2: 3.A, CH4 with 766.87 Gg CO2 / year (2.5%)
- 3: 1.A, N2O with 662.23 Gg CO2 / year (16.7%)
- 4: 1.B.1, CO2 with 619.80 Gg CO2 / year (465.0%)
- 5: 2, CO2 with -378.41 Gg CO2 / year (-1.0%)
For 1990-2022 the following sector-gas combinations have the highest absolute impact on national total KyotoGHG (AR6GWP100) emissions in 1990-2022 (top 5):
- 1: 1.B.2, CH4 with -162.59 Gg CO2 / year (-0.3%)
- 2: 1.B.1, CO2 with -141.07 Gg CO2 / year (-15.0%)
- 3: 3.A, CH4 with 23.24 Gg CO2 / year (0.1%)
- 4: 1.A, N2O with 20.07 Gg CO2 / year (0.3%)
- 5: 2, CO2 with -11.47 Gg CO2 / year (-0.0%)
Changes in the main sectors for aggregate KyotoGHG (AR6GWP100) are
- 1: Total sectoral emissions in 2022 are 557776.14 Gg CO2 / year which is 80.5% of M.0.EL emissions. 2022 Emissions have changed by -0.7% (-4183.71 Gg CO2 / year). 1990-2022 Emissions have changed by -0.1% (-286.63 Gg CO2 / year).
- 2: Total sectoral emissions in 2022 are 53970.47 Gg CO2 / year which is 7.8% of M.0.EL emissions. 2022 Emissions have changed by -0.3% (-168.26 Gg CO2 / year). 1990-2022 Emissions have changed by -0.0% (-5.10 Gg CO2 / year).
- M.AG: Total sectoral emissions in 2022 are 55933.57 Gg CO2 / year which is 8.1% of M.0.EL emissions. 2022 Emissions have changed by 0.9% (522.37 Gg CO2 / year). 1990-2022 Emissions have changed by 0.0% (15.83 Gg CO2 / year).
- 4: Total sectoral emissions in 2022 are 23485.37 Gg CO2 / year which is 3.4% of M.0.EL emissions. 2022 Emissions have changed by 1.0% (223.67 Gg CO2 / year). 1990-2022 Emissions have changed by 0.0% (6.78 Gg CO2 / year).
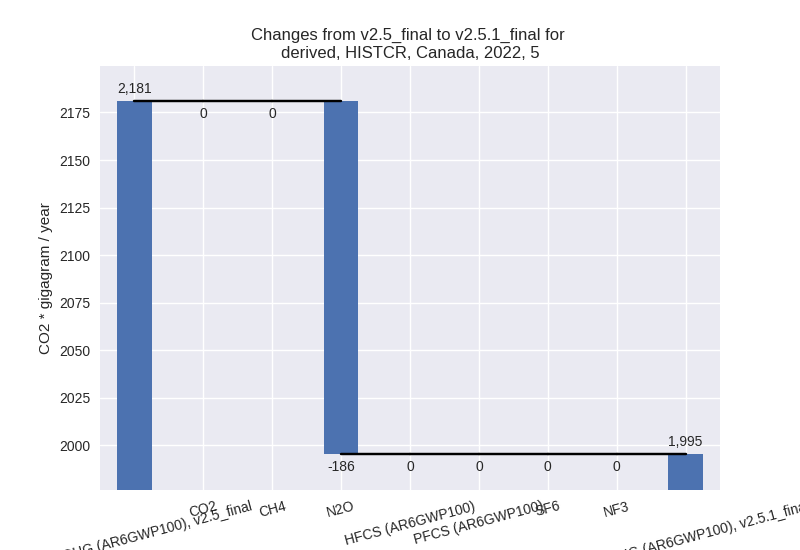
- 5: Total sectoral emissions in 2022 are 1995.34 Gg
CO2 / year which is 0.3% of M.0.EL emissions. 2022 Emissions have
changed by -8.5% (-185.53 Gg CO2 /
year). 1990-2022 Emissions have changed by -0.2% (-5.62 Gg CO2 / year). For 2022 the
changes per gas
are:
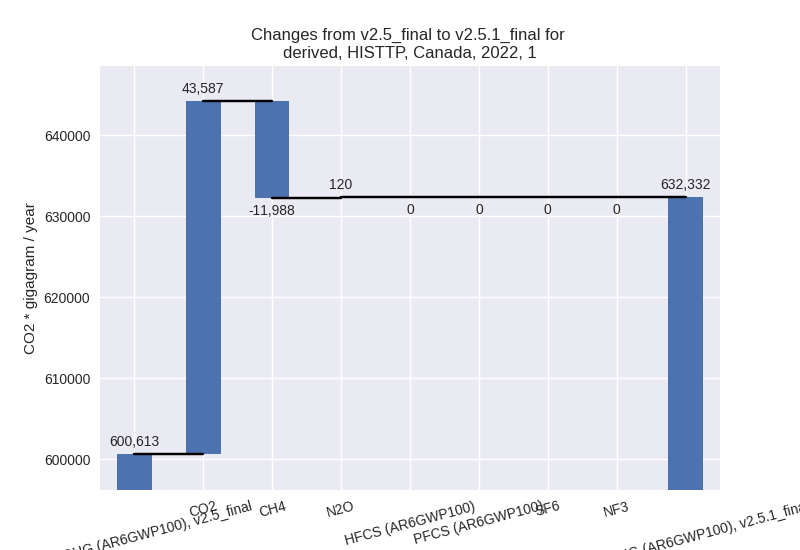
third party scenario (HISTTP):
Most important changes per time frame
For 2022 the following sector-gas combinations have the highest absolute impact on national total KyotoGHG (AR6GWP100) emissions in 2022 (top 5):
- 1: 1.A, CO2 with 42966.82 Gg CO2 / year (8.3%)
- 2: 1.B.2, CH4 with -11888.01 Gg CO2 / year (-17.1%)
- 3: M.AG.ELV, N2O with 2777.08 Gg CO2 / year (8.7%)
- 4: M.AG.ELV, CO2 with 1468.44 Gg CO2 / year (50.1%)
- 5: 4, CH4 with 810.99 Gg CO2 / year (3.8%)
For 1990-2022 the following sector-gas combinations have the highest absolute impact on national total KyotoGHG (AR6GWP100) emissions in 1990-2022 (top 5):
- 1: 1.A, CO2 with 8157.21 Gg CO2 / year (1.6%)
- 2: M.AG.ELV, N2O with 2569.18 Gg CO2 / year (9.9%)
- 3: 2, CO2 with -1800.97 Gg CO2 / year (-6.3%)
- 4: 1.B.2, CH4 with -1516.44 Gg CO2 / year (-2.6%)
- 5: M.AG.ELV, CO2 with 761.20 Gg CO2 / year (40.2%)
Changes in the main sectors for aggregate KyotoGHG (AR6GWP100) are
- 1: Total sectoral emissions in 2022 are 632332.04
Gg CO2 / year which is 81.3% of M.0.EL emissions. 2022 Emissions have
changed by 5.3% (31718.64 Gg CO2 /
year). 1990-2022 Emissions have changed by 1.1% (6582.58 Gg CO2 / year). For 2022 the
changes per gas
are:
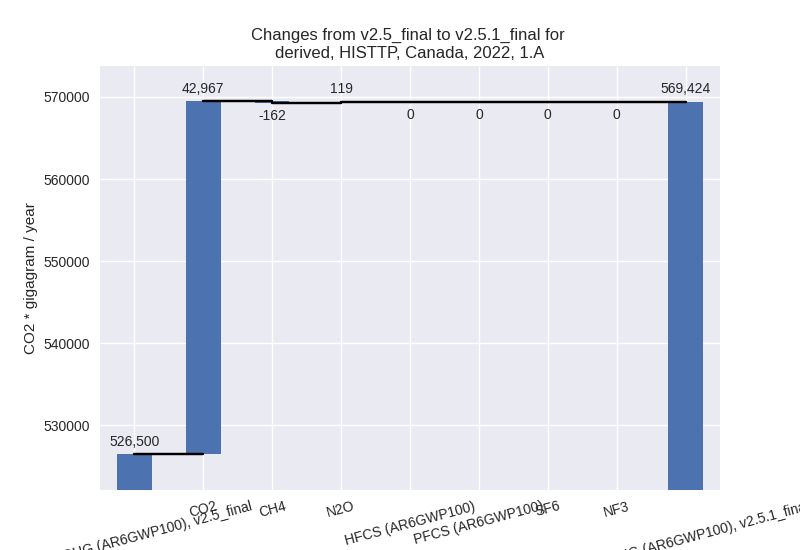
The changes come from the following subsectors:- 1.A: Total sectoral emissions in 2022 are 569423.82
Gg CO2 / year which is 90.1% of category 1 emissions. 2022 Emissions
have changed by 8.2% (42924.27 Gg
CO2 / year). 1990-2022 Emissions have changed by 1.5% (7982.09 Gg CO2 / year). For 2022 the
changes per gas
are:
There is no subsector information available in PRIMAP-hist. - 1.B.1: Total sectoral emissions in 2022 are 3076.48
Gg CO2 / year which is 0.5% of category 1 emissions. 2022 Emissions have
changed by 28.5% (681.93 Gg CO2 /
year). 1990-2022 Emissions have changed by 3.1% (116.95 Gg CO2 / year). For 2022 the
changes per gas
are:

For 1990-2022 the changes per gas are: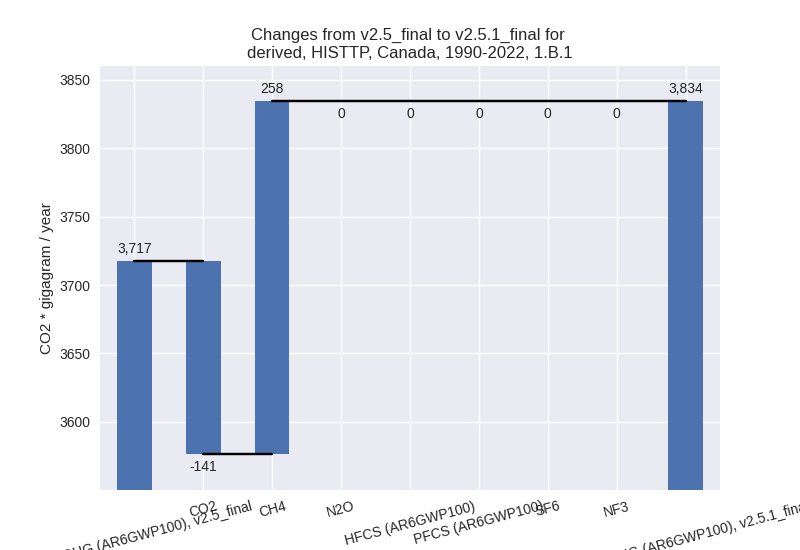
There is no subsector information available in PRIMAP-hist. - 1.B.2: Total sectoral emissions in 2022 are
59831.26 Gg CO2 / year which is 9.5% of category 1 emissions. 2022
Emissions have changed by -16.6%
(-11887.57 Gg CO2 / year). 1990-2022 Emissions have changed by -2.5% (-1516.46 Gg CO2 / year). For 2022
the changes per gas
are:

For 1990-2022 the changes per gas are:
There is no subsector information available in PRIMAP-hist. - 1.C: Total sectoral emissions in 2022 are 0.47 Gg CO2 / year which is 0.0% of category 1 emissions. 2022 Emissions have changed by 0.0% (0.00 Gg CO2 / year). 1990-2022 Emissions have changed by 0.0% (0.00 Gg CO2 / year).
- 1.A: Total sectoral emissions in 2022 are 569423.82
Gg CO2 / year which is 90.1% of category 1 emissions. 2022 Emissions
have changed by 8.2% (42924.27 Gg
CO2 / year). 1990-2022 Emissions have changed by 1.5% (7982.09 Gg CO2 / year). For 2022 the
changes per gas
are:
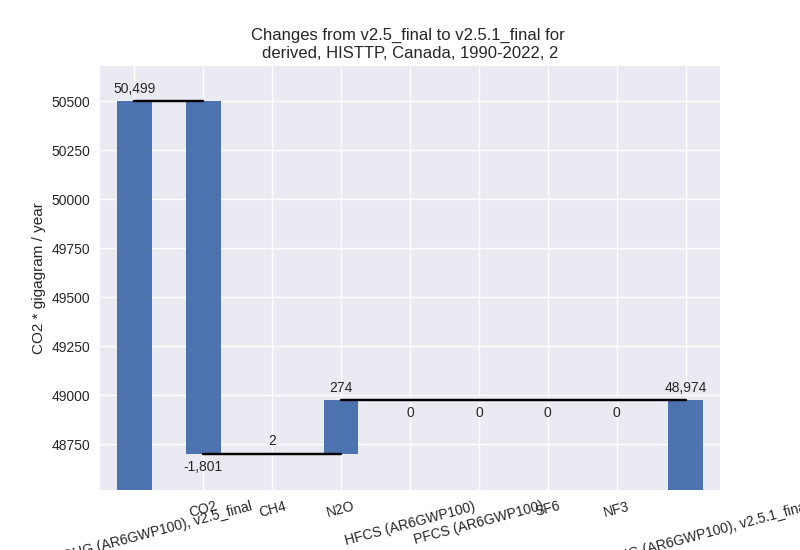
- 2: Total sectoral emissions in 2022 are 53244.18 Gg
CO2 / year which is 6.8% of M.0.EL emissions. 2022 Emissions have
changed by -0.4% (-201.46 Gg CO2 /
year). 1990-2022 Emissions have changed by -3.0% (-1525.11 Gg CO2 / year). For
1990-2022 the changes per gas
are:
- M.AG: Total sectoral emissions in 2022 are 66732.55
Gg CO2 / year which is 8.6% of M.0.EL emissions. 2022 Emissions have
changed by 7.9% (4894.86 Gg CO2 /
year). 1990-2022 Emissions have changed by 5.8% (3341.09 Gg CO2 / year). For 2022 the
changes per gas
are:

For 1990-2022 the changes per gas are:
The changes come from the following subsectors:- 3.A: Total sectoral emissions in 2022 are 26405.29 Gg CO2 / year which is 39.6% of category M.AG emissions. 2022 Emissions have changed by 0.1% (19.89 Gg CO2 / year). 1990-2022 Emissions have changed by -0.0% (-6.30 Gg CO2 / year).
- M.AG.ELV: Total sectoral emissions in 2022 are
40327.25 Gg CO2 / year which is 60.4% of category M.AG emissions. 2022
Emissions have changed by 13.8%
(4874.96 Gg CO2 / year). 1990-2022 Emissions have changed by 11.6% (3347.39 Gg CO2 / year). For 2022
the changes per gas
are:

For 1990-2022 the changes per gas are: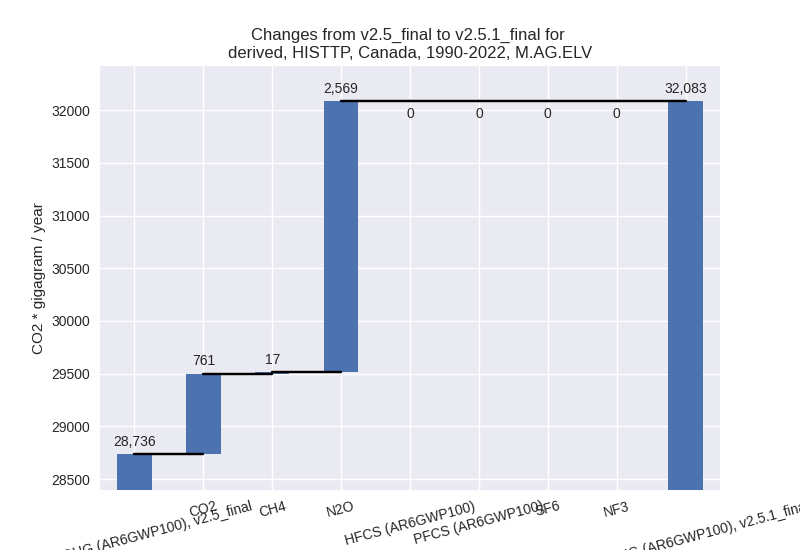
There is no subsector information available in PRIMAP-hist.
- 4: Total sectoral emissions in 2022 are 23047.32 Gg
CO2 / year which is 3.0% of M.0.EL emissions. 2022 Emissions have
changed by 3.7% (824.31 Gg CO2 /
year). 1990-2022 Emissions have changed by 0.1% (24.98 Gg CO2 / year). For 2022 the
changes per gas
are:

- 5: Total sectoral emissions in 2022 are 1995.34 Gg
CO2 / year which is 0.3% of M.0.EL emissions. 2022 Emissions have
changed by -8.5% (-185.53 Gg CO2 /
year). 1990-2022 Emissions have changed by -0.2% (-5.62 Gg CO2 / year). For 2022 the
changes per gas
are:
