Changes in PRIMAP-hist v2.5.1_final compared to v2.5_final for Switzerland
2024-02-29
Johannes Gütschow
Change analysis for Switzerland for PRIMAP-hist v2.5.1_final compared to v2.5_final
Overview over emissions by sector and gas
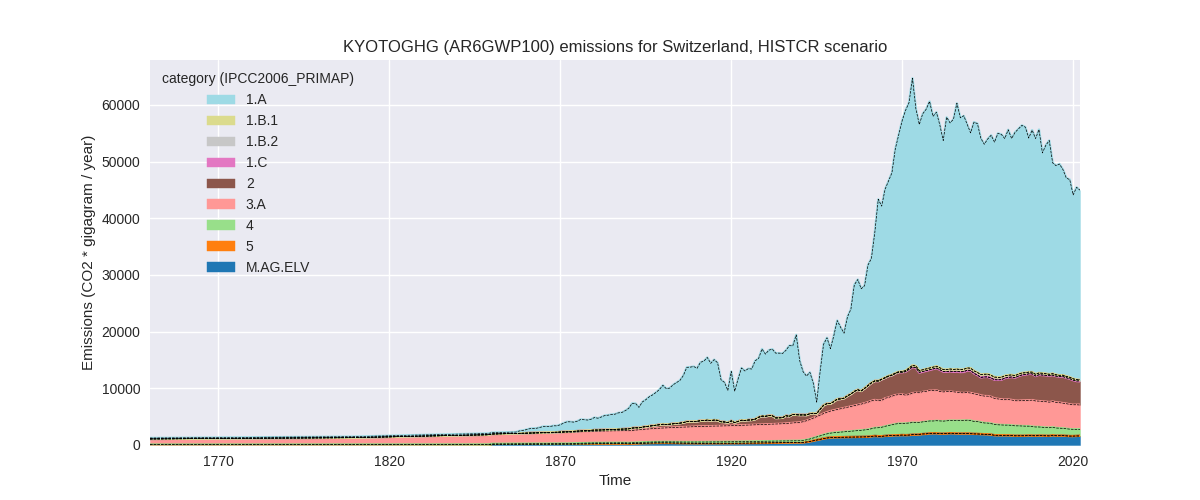
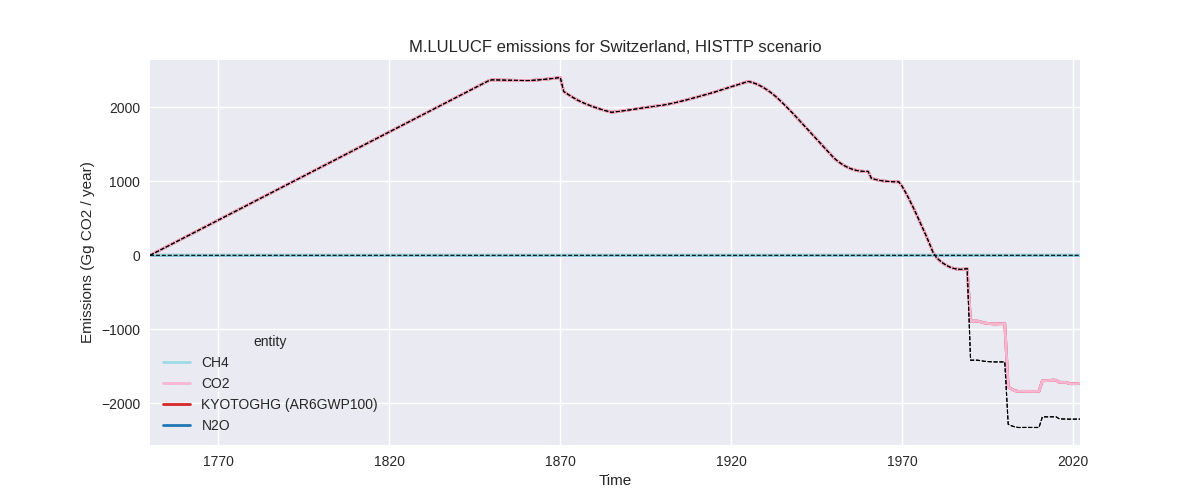
The following figures show the aggregate national total emissions excluding LULUCF AR6GWP100 for the country reported priority scenario. The dotted linesshow the v2.5_final data.

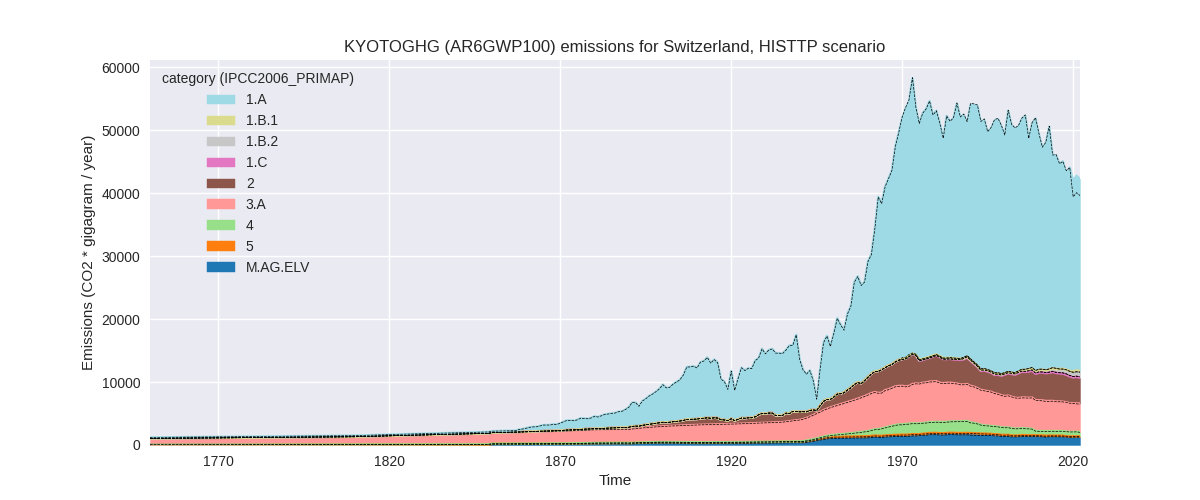
The following figures show the aggregate national total emissions excluding LULUCF AR6GWP100 for the third party priority scenario. The dotted linesshow the v2.5_final data.

Overview over changes
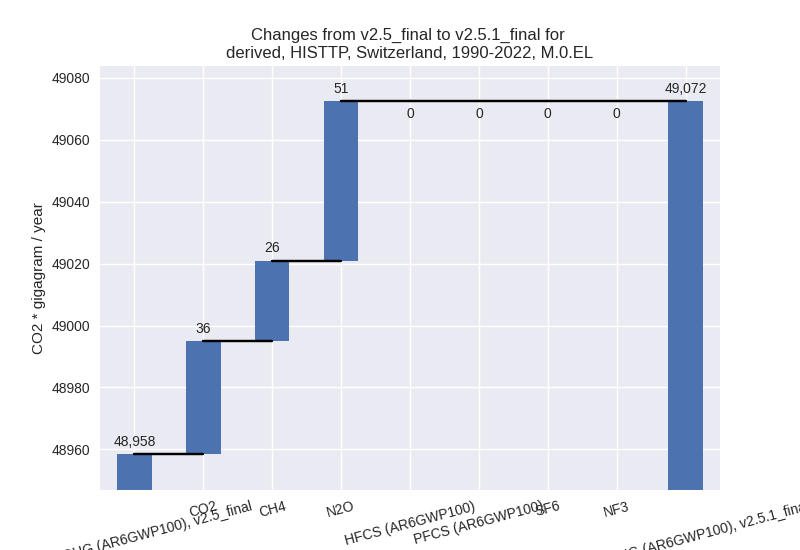
In the country reported priority scenario we have the following changes for aggregate Kyoto GHG and national total emissions excluding LULUCF (M.0.EL):
- Emissions in 2022 have changed by -0.1%% (-47.82 Gg CO2 / year)
- Emissions in 1990-2022 have changed by -0.0%% (-1.45 Gg CO2 / year)
In the third party priority scenario we have the following changes for aggregate Kyoto GHG and national total emissions excluding LULUCF (M.0.EL):
- Emissions in 2022 have changed by 6.6%% (2626.06 Gg CO2 / year)
- Emissions in 1990-2022 have changed by 0.2%% (114.04 Gg CO2 / year)
Most important changes per scenario and time frame
In the country reported priority scenario the following sector-gas combinations have the highest absolute impact on national total KyotoGHG (AR6GWP100) emissions in 2022 (top 5):
- 1: 2, N2O with -135.14 Gg CO2 / year (-26.2%)
- 2: M.AG.ELV, N2O with 44.01 Gg CO2 / year (2.9%)
- 3: 1.B.2, CH4 with 34.49 Gg CO2 / year (18.0%)
- 4: 3.A, CH4 with -32.59 Gg CO2 / year (-0.8%)
- 5: 4, N2O with 25.59 Gg CO2 / year (4.3%)
In the country reported priority scenario the following sector-gas combinations have the highest absolute impact on national total KyotoGHG (AR6GWP100) emissions in 1990-2022 (top 5):
- 1: 2, N2O with -4.10 Gg CO2 / year (-0.7%)
- 2: M.AG.ELV, N2O with 1.33 Gg CO2 / year (0.1%)
- 3: 1.B.2, CH4 with 1.05 Gg CO2 / year (0.3%)
- 4: 3.A, CH4 with -0.99 Gg CO2 / year (-0.0%)
- 5: 4, N2O with 0.78 Gg CO2 / year (0.1%)
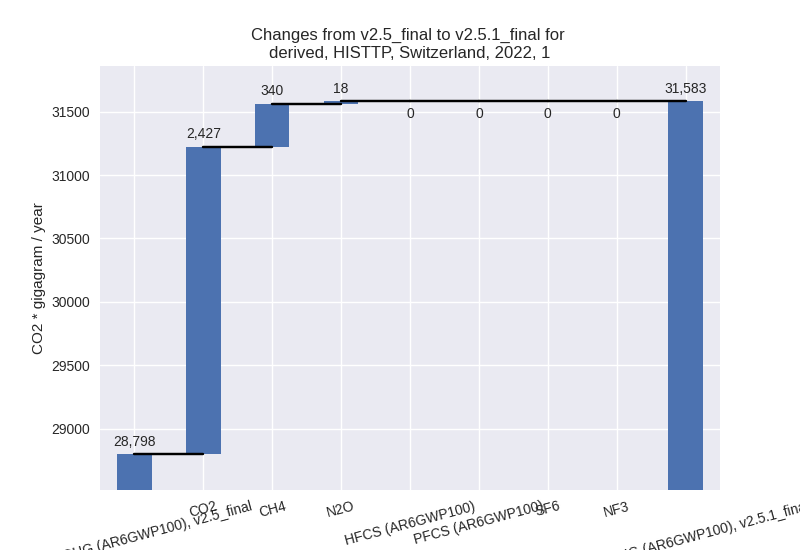
In the third party priority scenario the following sector-gas combinations have the highest absolute impact on national total KyotoGHG (AR6GWP100) emissions in 2022 (top 5):
- 1: 1.A, CO2 with 2426.81 Gg CO2 / year (8.9%)
- 2: 1.B.2, CH4 with 341.21 Gg CO2 / year (46.0%)
- 3: 2, CO2 with -252.75 Gg CO2 / year (-9.8%)
- 4: M.AG.ELV, N2O with 76.64 Gg CO2 / year (6.5%)
- 5: 4, CH4 with 63.23 Gg CO2 / year (14.2%)
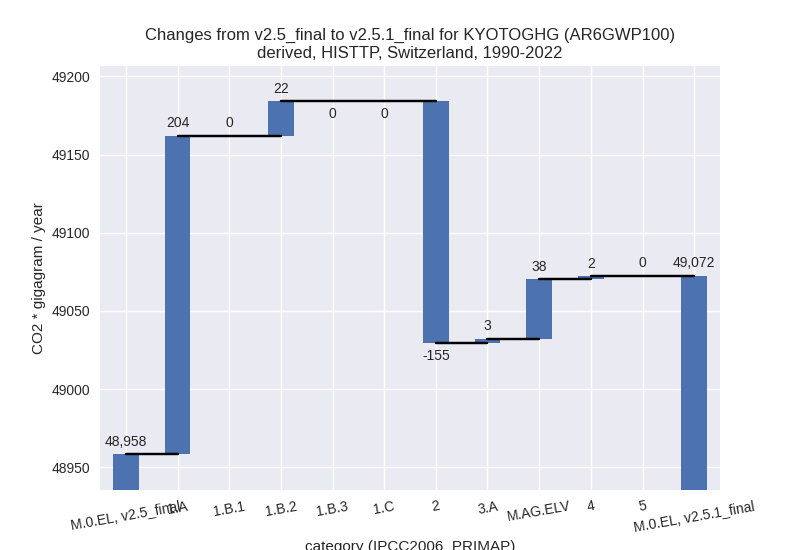
In the third party priority scenario the following sector-gas combinations have the highest absolute impact on national total KyotoGHG (AR6GWP100) emissions in 1990-2022 (top 5):
- 1: 1.A, CO2 with 202.72 Gg CO2 / year (0.6%)
- 2: 2, CO2 with -154.88 Gg CO2 / year (-5.9%)
- 3: M.AG.ELV, N2O with 49.50 Gg CO2 / year (3.8%)
- 4: 1.B.2, CH4 with 22.06 Gg CO2 / year (5.8%)
- 5: M.AG.ELV, CO2 with -11.38 Gg CO2 / year (-22.8%)
Notes on data changes
Here we list notes explaining important emissions changes for the country. ’' means that the following text only applies to the TP time series, while means that it only applies to the CR scenario. Otherwise the note applies to both scenarios.
- 1.B.2, CH4: EDGAR 8.0 emissions are higher than EDGAR 7.0 starting in 2016 leading to much higher emissions in PRIMAP-hist for the latest years.
- 1.A, CO2: CDIAC 2023 data shows a further decline in emissions after 2017 leading to lower emissions for the last years in PRIMAP-hist.
Changes by sector and gas
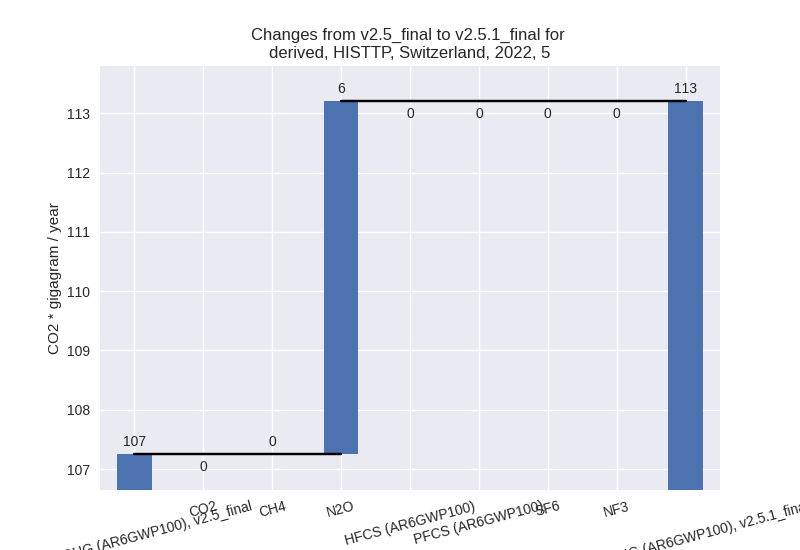
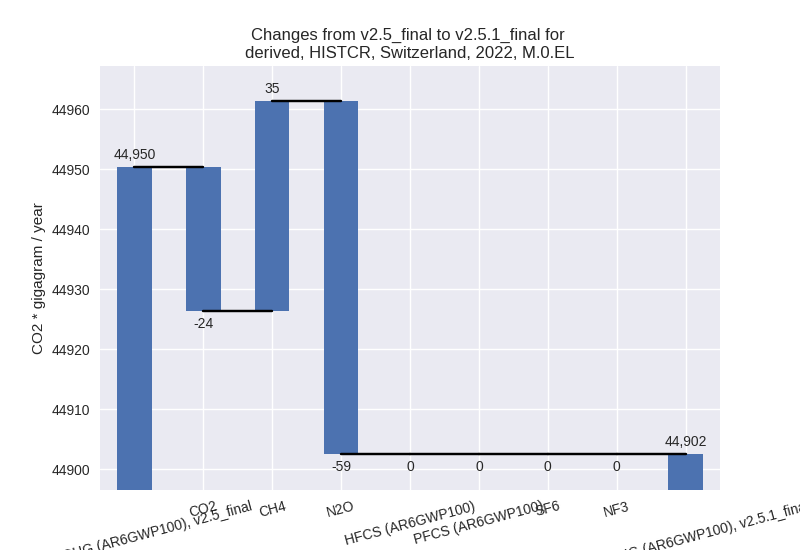
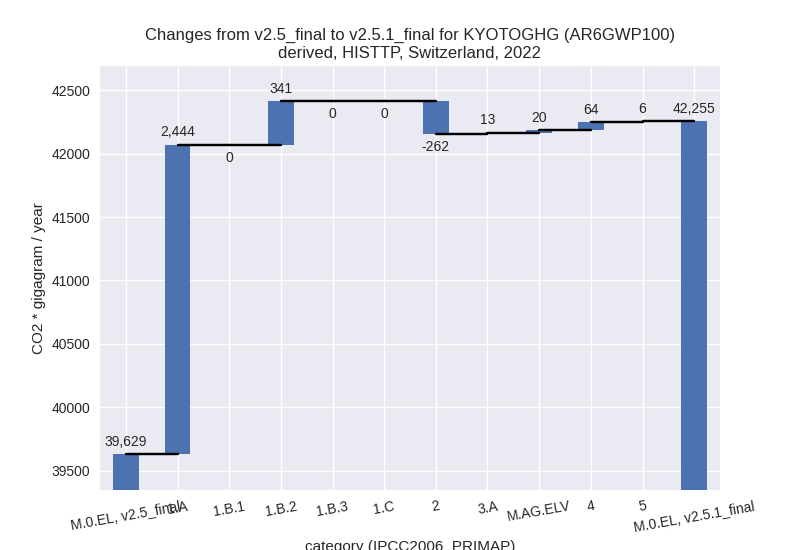
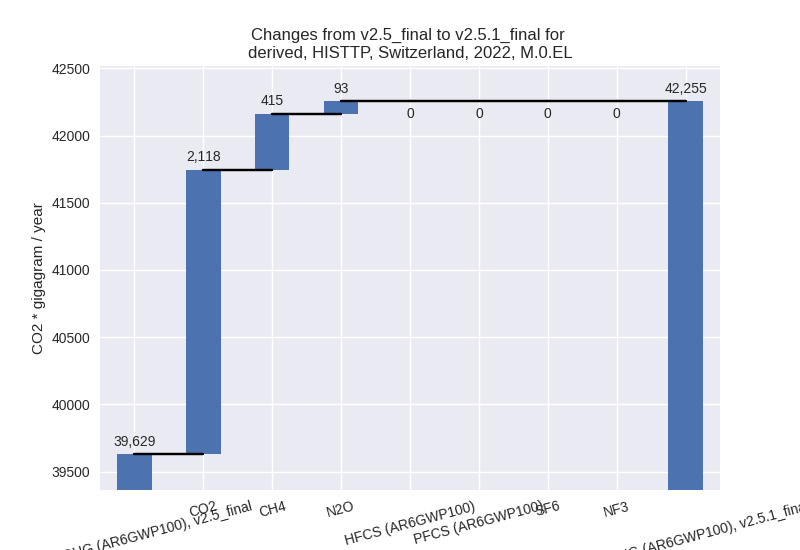
For each scenario and time frame the changes are displayed for all individual sectors and all individual gases. In the sector plot we use aggregate Kyoto GHGs in AR6GWP100. In the gas plot we usenational total emissions without LULUCF. ## country reported scenario
2022

1990-2022


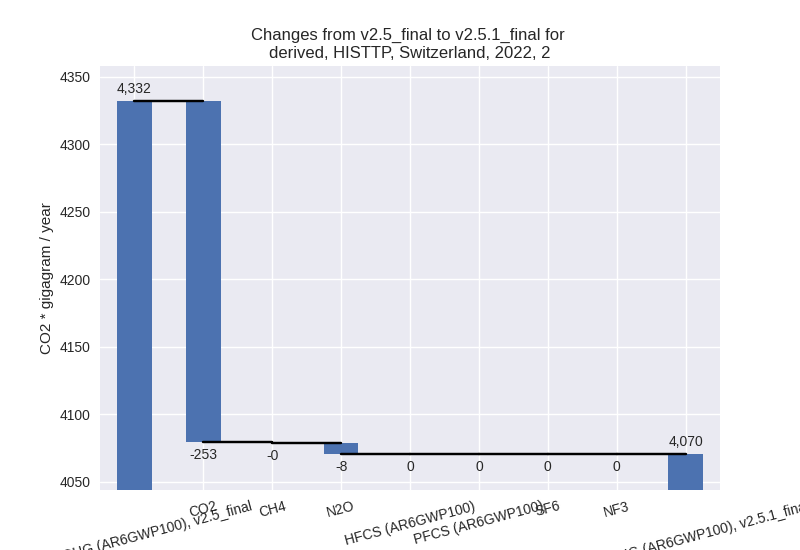
third party scenario
2022
1990-2022
Detailed changes for the scenarios:
country reported scenario (HISTCR):
Most important changes per time frame
For 2022 the following sector-gas combinations have the highest absolute impact on national total KyotoGHG (AR6GWP100) emissions in 2022 (top 5):
- 1: 2, N2O with -135.14 Gg CO2 / year (-26.2%)
- 2: M.AG.ELV, N2O with 44.01 Gg CO2 / year (2.9%)
- 3: 1.B.2, CH4 with 34.49 Gg CO2 / year (18.0%)
- 4: 3.A, CH4 with -32.59 Gg CO2 / year (-0.8%)
- 5: 4, N2O with 25.59 Gg CO2 / year (4.3%)
For 1990-2022 the following sector-gas combinations have the highest absolute impact on national total KyotoGHG (AR6GWP100) emissions in 1990-2022 (top 5):
- 1: 2, N2O with -4.10 Gg CO2 / year (-0.7%)
- 2: M.AG.ELV, N2O with 1.33 Gg CO2 / year (0.1%)
- 3: 1.B.2, CH4 with 1.05 Gg CO2 / year (0.3%)
- 4: 3.A, CH4 with -0.99 Gg CO2 / year (-0.0%)
- 5: 4, N2O with 0.78 Gg CO2 / year (0.1%)
Changes in the main sectors for aggregate KyotoGHG (AR6GWP100) are
- 1: Total sectoral emissions in 2022 are 33673.04 Gg CO2 / year which is 75.0% of M.0.EL emissions. 2022 Emissions have changed by 0.2% (56.56 Gg CO2 / year). 1990-2022 Emissions have changed by 0.0% (1.71 Gg CO2 / year).
- 2: Total sectoral emissions in 2022 are 4121.02 Gg
CO2 / year which is 9.2% of M.0.EL emissions. 2022 Emissions have
changed by -3.7% (-159.39 Gg CO2 /
year). 1990-2022 Emissions have changed by -0.1% (-4.83 Gg CO2 / year). For 2022 the
changes per gas
are:

- M.AG: Total sectoral emissions in 2022 are 5933.41 Gg CO2 / year which is 13.2% of M.0.EL emissions. 2022 Emissions have changed by 0.2% (10.03 Gg CO2 / year). 1990-2022 Emissions have changed by 0.0% (0.30 Gg CO2 / year).
- 4: Total sectoral emissions in 2022 are 1161.53 Gg
CO2 / year which is 2.6% of M.0.EL emissions. 2022 Emissions have
changed by 4.0% (44.96 Gg CO2 /
year). 1990-2022 Emissions have changed by 0.1% (1.36 Gg CO2 / year). For 2022 the
changes per gas
are:

- 5: Total sectoral emissions in 2022 are 13.49 Gg CO2 / year which is 0.0% of M.0.EL emissions. 2022 Emissions have changed by 0.2% (0.03 Gg CO2 / year). 1990-2022 Emissions have changed by 0.0% (0.00 Gg CO2 / year).
third party scenario (HISTTP):
Most important changes per time frame
For 2022 the following sector-gas combinations have the highest absolute impact on national total KyotoGHG (AR6GWP100) emissions in 2022 (top 5):
- 1: 1.A, CO2 with 2426.81 Gg CO2 / year (8.9%)
- 2: 1.B.2, CH4 with 341.21 Gg CO2 / year (46.0%)
- 3: 2, CO2 with -252.75 Gg CO2 / year (-9.8%)
- 4: M.AG.ELV, N2O with 76.64 Gg CO2 / year (6.5%)
- 5: 4, CH4 with 63.23 Gg CO2 / year (14.2%)
For 1990-2022 the following sector-gas combinations have the highest absolute impact on national total KyotoGHG (AR6GWP100) emissions in 1990-2022 (top 5):
- 1: 1.A, CO2 with 202.72 Gg CO2 / year (0.6%)
- 2: 2, CO2 with -154.88 Gg CO2 / year (-5.9%)
- 3: M.AG.ELV, N2O with 49.50 Gg CO2 / year (3.8%)
- 4: 1.B.2, CH4 with 22.06 Gg CO2 / year (5.8%)
- 5: M.AG.ELV, CO2 with -11.38 Gg CO2 / year (-22.8%)
Changes in the main sectors for aggregate KyotoGHG (AR6GWP100) are
- 1: Total sectoral emissions in 2022 are 31582.67 Gg
CO2 / year which is 74.7% of M.0.EL emissions. 2022 Emissions have
changed by 9.7% (2785.09 Gg CO2 /
year). 1990-2022 Emissions have changed by 0.6% (225.66 Gg CO2 / year). For 2022 the
changes per gas
are:
The changes come from the following subsectors:- 1.A: Total sectoral emissions in 2022 are 30489.06
Gg CO2 / year which is 96.5% of category 1 emissions. 2022 Emissions
have changed by 8.7% (2443.62 Gg CO2
/ year). 1990-2022 Emissions have changed by 0.6% (203.64 Gg CO2 / year). For 2022 the
changes per gas
are:

There is no subsector information available in PRIMAP-hist. - 1.B.1: Total sectoral emissions in 2022 are 0.00 Gg CO2 / year which is 0.0% of category 1 emissions. 2022 Emissions have changed by 0.0% (0.00 Gg CO2 / year). 1990-2022 Emissions have changed by 0.0% (0.00 Gg CO2 / year).
- 1.B.2: Total sectoral emissions in 2022 are 1093.61
Gg CO2 / year which is 3.5% of category 1 emissions. 2022 Emissions have
changed by 45.4% (341.47 Gg CO2 /
year). 1990-2022 Emissions have changed by 5.7% (22.02 Gg CO2 / year). For 2022 the
changes per gas
are:

For 1990-2022 the changes per gas are: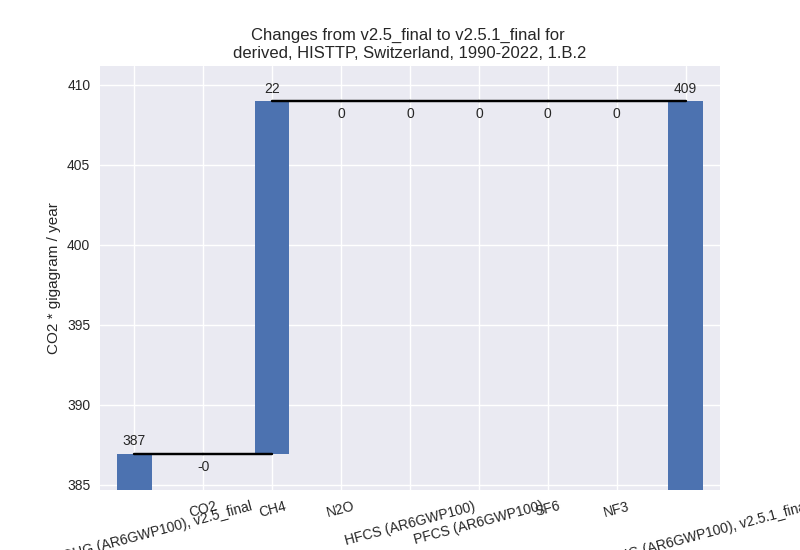
There is no subsector information available in PRIMAP-hist.
- 1.A: Total sectoral emissions in 2022 are 30489.06
Gg CO2 / year which is 96.5% of category 1 emissions. 2022 Emissions
have changed by 8.7% (2443.62 Gg CO2
/ year). 1990-2022 Emissions have changed by 0.6% (203.64 Gg CO2 / year). For 2022 the
changes per gas
are:
- 2: Total sectoral emissions in 2022 are 4070.33 Gg
CO2 / year which is 9.6% of M.0.EL emissions. 2022 Emissions have
changed by -6.0% (-261.58 Gg CO2 /
year). 1990-2022 Emissions have changed by -3.8% (-154.66 Gg CO2 / year). For 2022
the changes per gas
are:
For 1990-2022 the changes per gas are: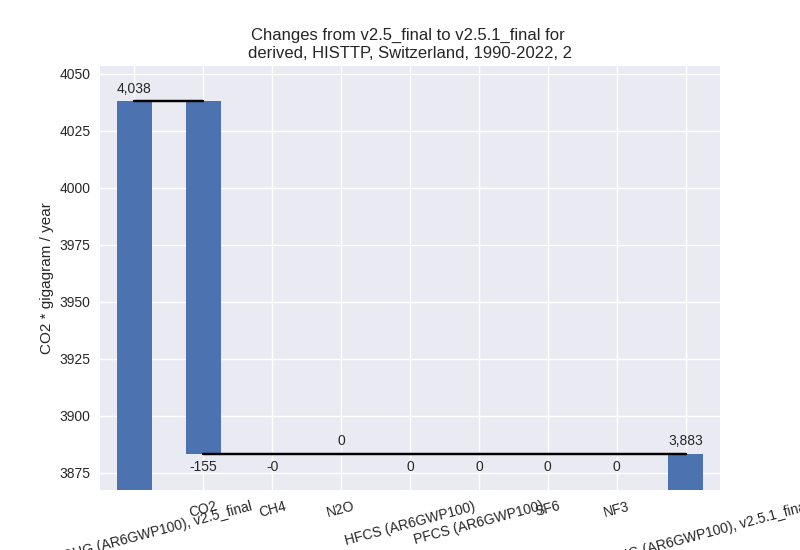
- M.AG: Total sectoral emissions in 2022 are 5777.34 Gg CO2 / year which is 13.7% of M.0.EL emissions. 2022 Emissions have changed by 0.6% (32.90 Gg CO2 / year). 1990-2022 Emissions have changed by 0.6% (40.93 Gg CO2 / year).
- 4: Total sectoral emissions in 2022 are 711.19 Gg
CO2 / year which is 1.7% of M.0.EL emissions. 2022 Emissions have
changed by 9.8% (63.69 Gg CO2 /
year). 1990-2022 Emissions have changed by 0.2% (1.93 Gg CO2 / year). For 2022 the
changes per gas
are:

- 5: Total sectoral emissions in 2022 are 113.20 Gg
CO2 / year which is 0.3% of M.0.EL emissions. 2022 Emissions have
changed by 5.5% (5.95 Gg CO2 /
year). 1990-2022 Emissions have changed by 0.1% (0.18 Gg CO2 / year). For 2022 the
changes per gas
are: