Changes in PRIMAP-hist v2.5.1_final compared to v2.5_final for Chile
2024-02-29
Johannes Gütschow
Change analysis for Chile for PRIMAP-hist v2.5.1_final compared to v2.5_final
Overview over emissions by sector and gas
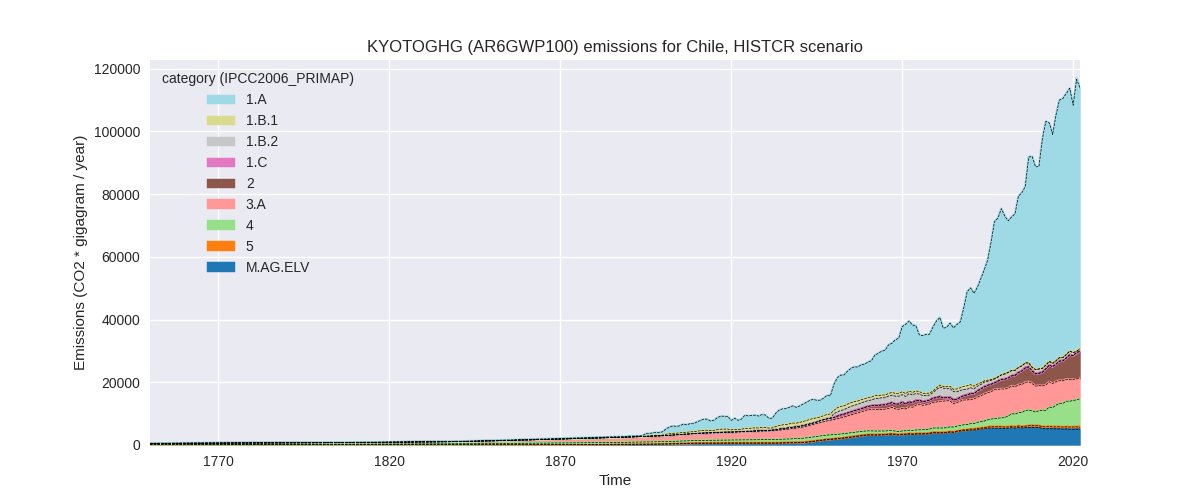
The following figures show the aggregate national total emissions excluding LULUCF AR6GWP100 for the country reported priority scenario. The dotted linesshow the v2.5_final data.


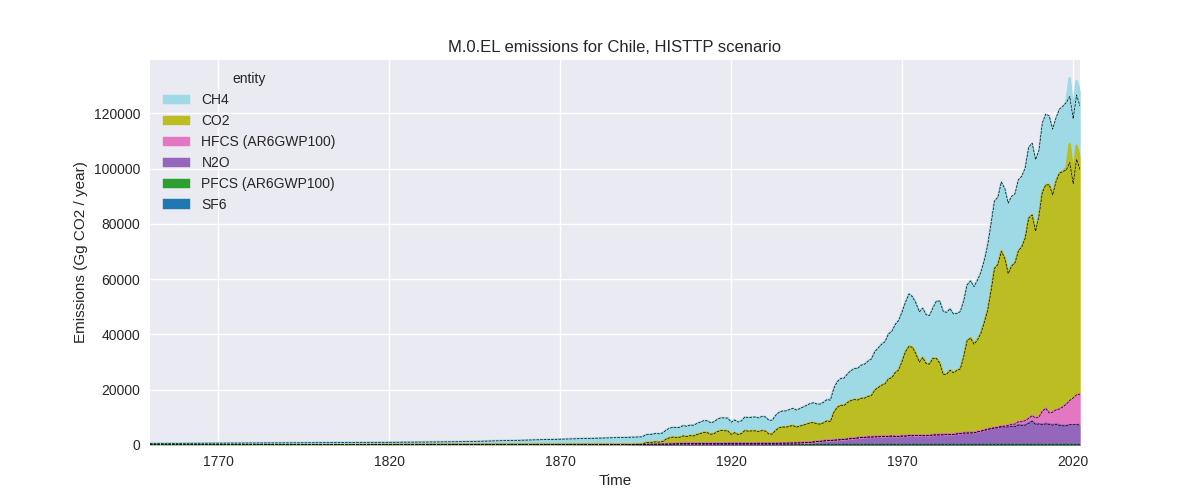
The following figures show the aggregate national total emissions excluding LULUCF AR6GWP100 for the third party priority scenario. The dotted linesshow the v2.5_final data.


Overview over changes
In the country reported priority scenario we have the following changes for aggregate Kyoto GHG and national total emissions excluding LULUCF (M.0.EL):
- Emissions in 2022 have changed by 0.1%% (128.05 Gg CO2 / year)
- Emissions in 1990-2022 have changed by 0.0%% (14.43 Gg CO2 / year)
In the third party priority scenario we have the following changes for aggregate Kyoto GHG and national total emissions excluding LULUCF (M.0.EL):
- Emissions in 2022 have changed by 4.3%% (5317.63 Gg CO2 / year)
- Emissions in 1990-2022 have changed by 0.4%% (402.00 Gg CO2 / year)
Most important changes per scenario and time frame
In the country reported priority scenario the following sector-gas combinations have the highest absolute impact on national total KyotoGHG (AR6GWP100) emissions in 2022 (top 5):
- 1: 4, CH4 with -428.59 Gg CO2 / year (-4.9%)
- 2: M.AG.ELV, N2O with 299.80 Gg CO2 / year (7.3%)
- 3: 1.B.2, CH4 with 210.85 Gg CO2 / year (27.5%)
- 4: 3.A, CH4 with 145.19 Gg CO2 / year (2.4%)
- 5: 1.B.1, CH4 with -72.33 Gg CO2 / year (-82.0%)
In the country reported priority scenario the following sector-gas combinations have the highest absolute impact on national total KyotoGHG (AR6GWP100) emissions in 1990-2022 (top 5):
- 1: 1.B.2, CH4 with 23.55 Gg CO2 / year (1.9%)
- 2: 4, CH4 with -12.99 Gg CO2 / year (-0.3%)
- 3: M.AG.ELV, N2O with 9.19 Gg CO2 / year (0.2%)
- 4: 3.A, CH4 with -5.03 Gg CO2 / year (-0.1%)
- 5: 2, CO2 with 2.53 Gg CO2 / year (0.1%)
In the third party priority scenario the following sector-gas combinations have the highest absolute impact on national total KyotoGHG (AR6GWP100) emissions in 2022 (top 5):
- 1: 1.A, CO2 with 4126.97 Gg CO2 / year (5.2%)
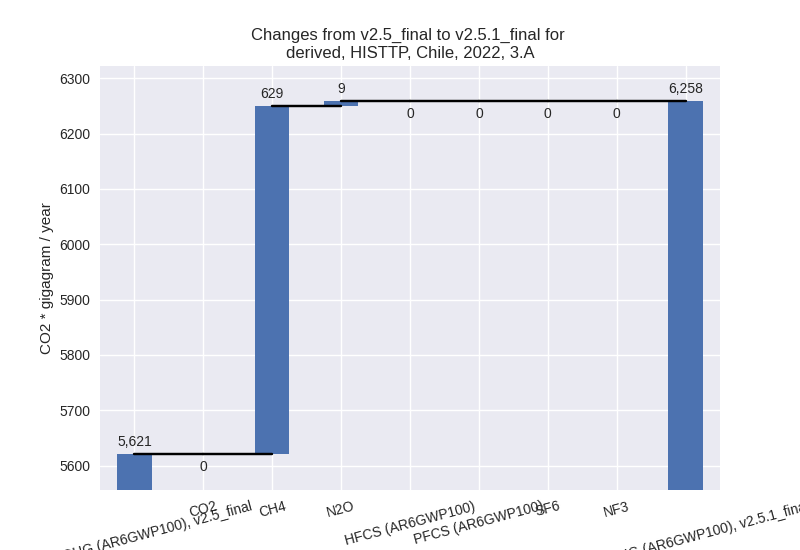
- 2: 3.A, CH4 with 628.61 Gg CO2 / year (11.9%)
- 3: 1.B.1, CH4 with -383.48 Gg CO2 / year (-49.7%)
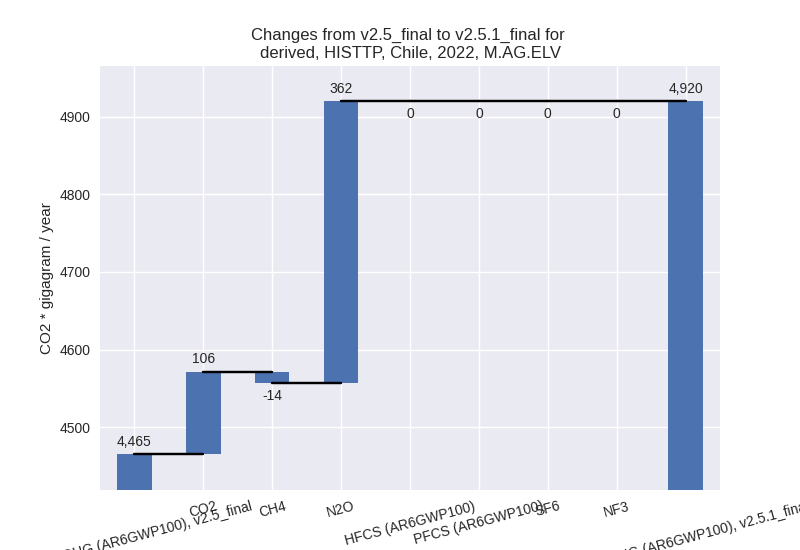
- 4: M.AG.ELV, N2O with 362.34 Gg CO2 / year (9.1%)
- 5: 4, CH4 with 281.16 Gg CO2 / year (1.9%)
In the third party priority scenario the following sector-gas combinations have the highest absolute impact on national total KyotoGHG (AR6GWP100) emissions in 1990-2022 (top 5):
- 1: 1.A, CO2 with 617.25 Gg CO2 / year (1.0%)
- 2: 1.B.2, CH4 with -249.10 Gg CO2 / year (-9.8%)
- 3: 2, CO2 with -82.82 Gg CO2 / year (-4.1%)
- 4: M.AG.ELV, N2O with 44.71 Gg CO2 / year (1.0%)
- 5: M.AG.ELV, CO2 with 34.08 Gg CO2 / year (11.6%)
Notes on data changes
No country specific notes present for this changelog.
Changes by sector and gas
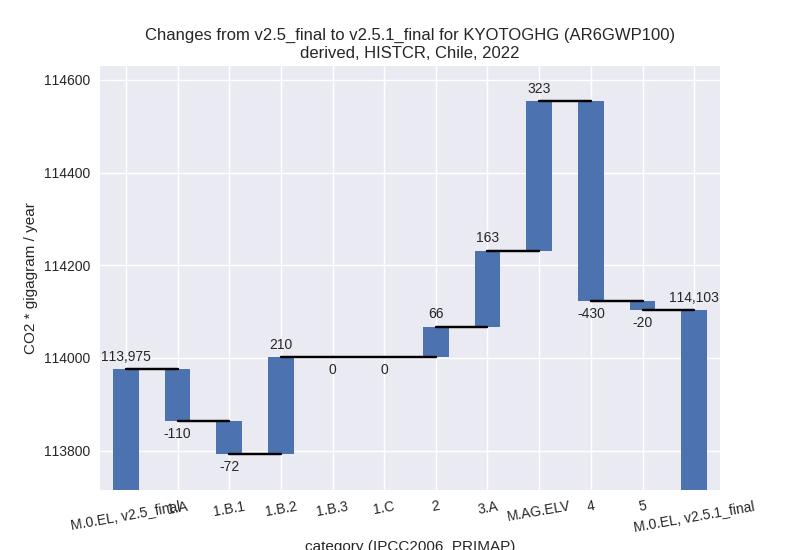
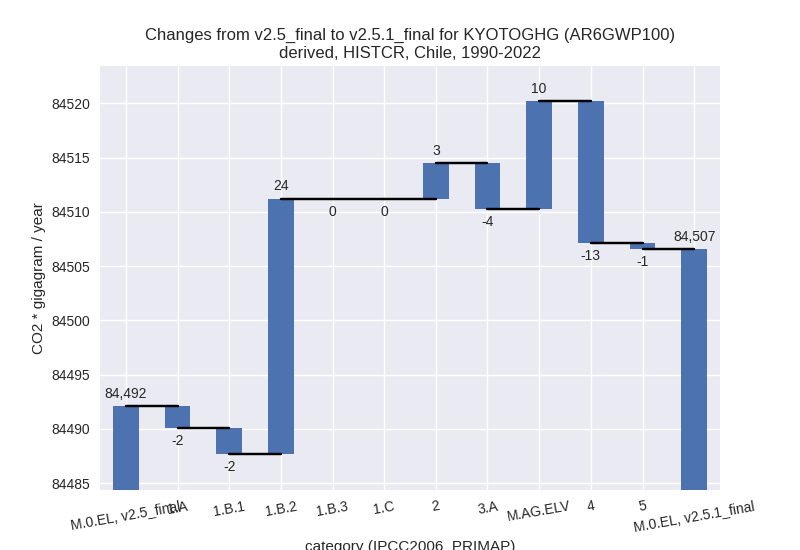
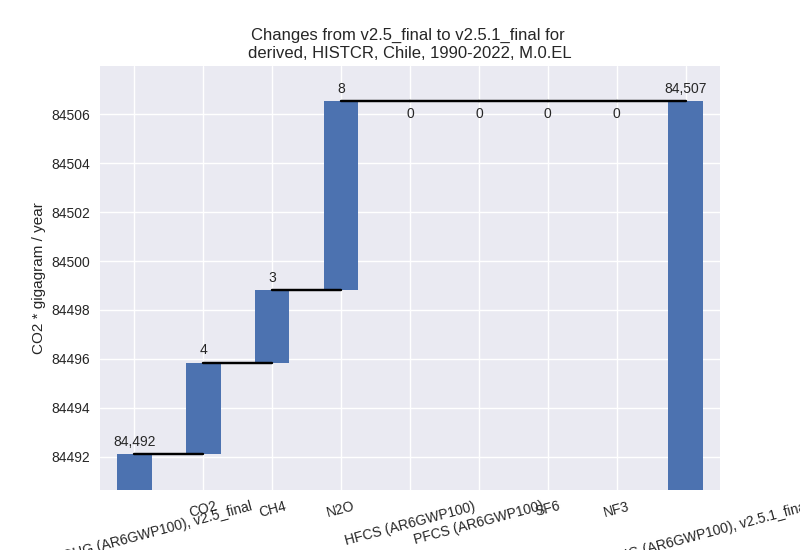
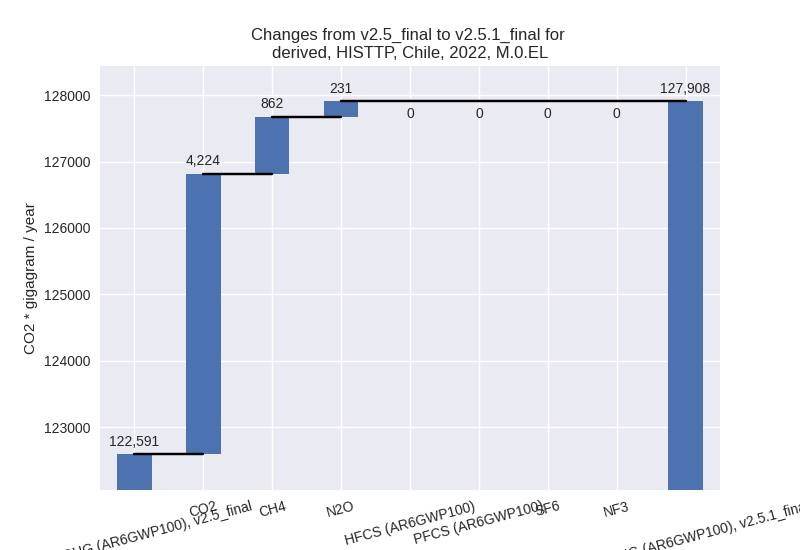
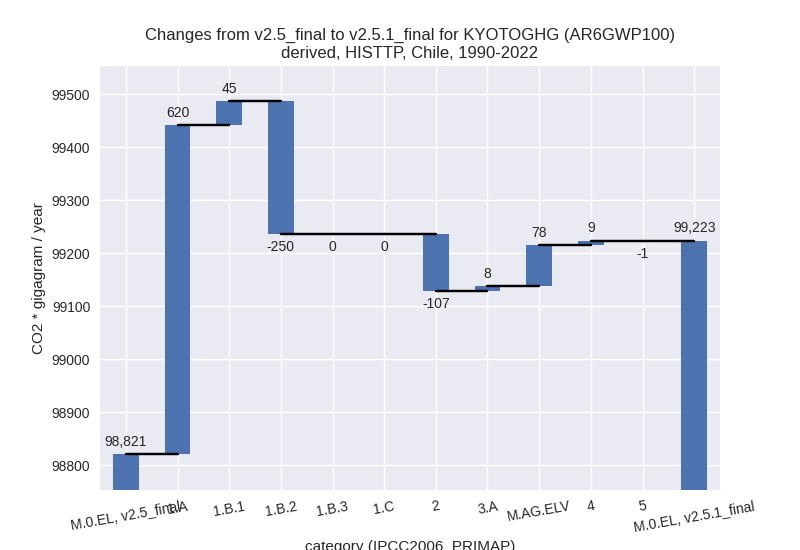
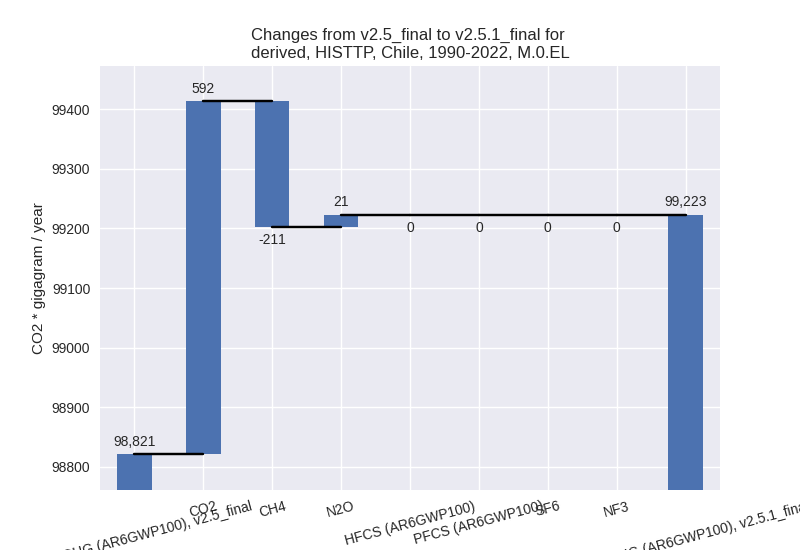
For each scenario and time frame the changes are displayed for all individual sectors and all individual gases. In the sector plot we use aggregate Kyoto GHGs in AR6GWP100. In the gas plot we usenational total emissions without LULUCF. ## country reported scenario
2022

1990-2022
third party scenario
2022

1990-2022
Detailed changes for the scenarios:
country reported scenario (HISTCR):
Most important changes per time frame
For 2022 the following sector-gas combinations have the highest absolute impact on national total KyotoGHG (AR6GWP100) emissions in 2022 (top 5):
- 1: 4, CH4 with -428.59 Gg CO2 / year (-4.9%)
- 2: M.AG.ELV, N2O with 299.80 Gg CO2 / year (7.3%)
- 3: 1.B.2, CH4 with 210.85 Gg CO2 / year (27.5%)
- 4: 3.A, CH4 with 145.19 Gg CO2 / year (2.4%)
- 5: 1.B.1, CH4 with -72.33 Gg CO2 / year (-82.0%)
For 1990-2022 the following sector-gas combinations have the highest absolute impact on national total KyotoGHG (AR6GWP100) emissions in 1990-2022 (top 5):
- 1: 1.B.2, CH4 with 23.55 Gg CO2 / year (1.9%)
- 2: 4, CH4 with -12.99 Gg CO2 / year (-0.3%)
- 3: M.AG.ELV, N2O with 9.19 Gg CO2 / year (0.2%)
- 4: 3.A, CH4 with -5.03 Gg CO2 / year (-0.1%)
- 5: 2, CO2 with 2.53 Gg CO2 / year (0.1%)
Changes in the main sectors for aggregate KyotoGHG (AR6GWP100) are
- 1: Total sectoral emissions in 2022 are 84120.26 Gg CO2 / year which is 73.7% of M.0.EL emissions. 2022 Emissions have changed by 0.0% (26.90 Gg CO2 / year). 1990-2022 Emissions have changed by 0.0% (19.08 Gg CO2 / year).
- 2: Total sectoral emissions in 2022 are 8768.55 Gg CO2 / year which is 7.7% of M.0.EL emissions. 2022 Emissions have changed by 0.8% (65.81 Gg CO2 / year). 1990-2022 Emissions have changed by 0.1% (3.28 Gg CO2 / year).
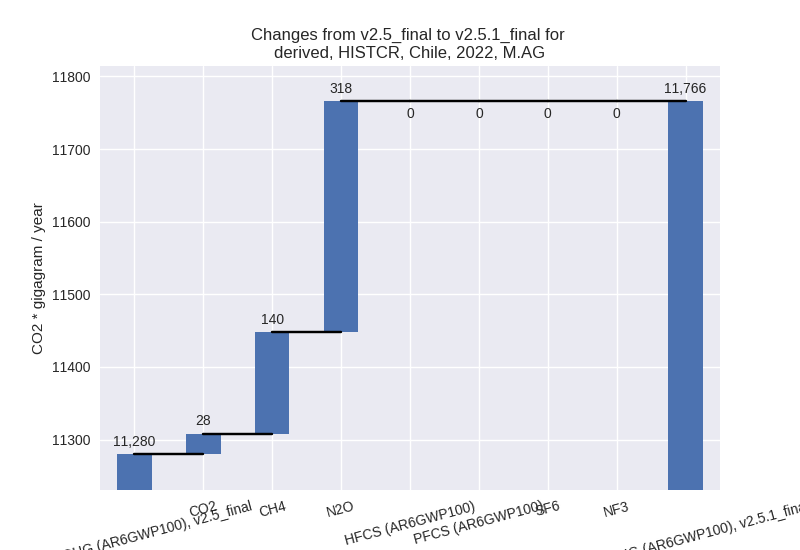
- M.AG: Total sectoral emissions in 2022 are 11765.73
Gg CO2 / year which is 10.3% of M.0.EL emissions. 2022 Emissions have
changed by 4.3% (485.97 Gg CO2 /
year). 1990-2022 Emissions have changed by 0.0% (5.72 Gg CO2 / year). For 2022 the
changes per gas
are:
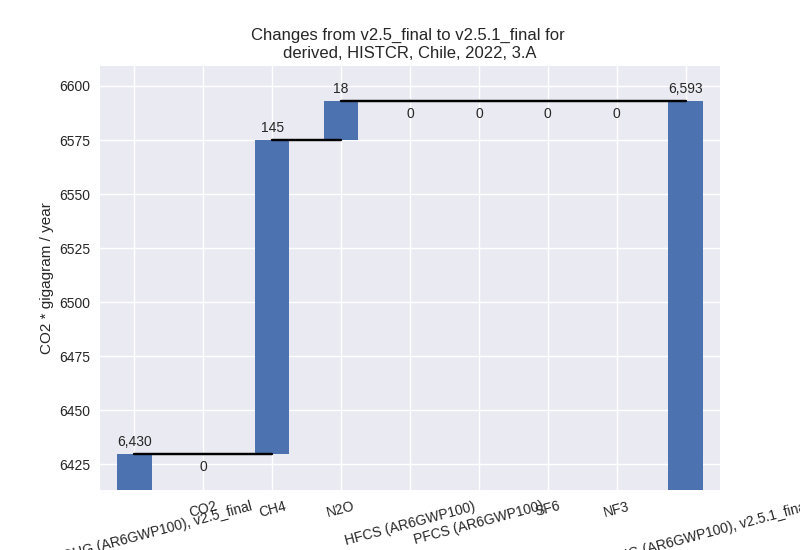
The changes come from the following subsectors:- 3.A: Total sectoral emissions in 2022 are 6592.92
Gg CO2 / year which is 56.0% of category M.AG emissions. 2022 Emissions
have changed by 2.5% (163.26 Gg CO2
/ year). 1990-2022 Emissions have changed by -0.1% (-4.24 Gg CO2 / year). For 2022 the
changes per gas
are:
There is no subsector information available in PRIMAP-hist. - M.AG.ELV: Total sectoral emissions in 2022 are
5172.81 Gg CO2 / year which is 44.0% of category M.AG emissions. 2022
Emissions have changed by 6.7%
(322.72 Gg CO2 / year). 1990-2022 Emissions have changed by 0.2% (9.96 Gg CO2 / year). For 2022 the
changes per gas
are:

There is no subsector information available in PRIMAP-hist.
- 3.A: Total sectoral emissions in 2022 are 6592.92
Gg CO2 / year which is 56.0% of category M.AG emissions. 2022 Emissions
have changed by 2.5% (163.26 Gg CO2
/ year). 1990-2022 Emissions have changed by -0.1% (-4.24 Gg CO2 / year). For 2022 the
changes per gas
are:
- 4: Total sectoral emissions in 2022 are 8688.28 Gg
CO2 / year which is 7.6% of M.0.EL emissions. 2022 Emissions have
changed by -4.7% (-430.42 Gg CO2 /
year). 1990-2022 Emissions have changed by -0.3% (-13.04 Gg CO2 / year). For 2022 the
changes per gas
are:

- 5: Total sectoral emissions in 2022 are 760.23 Gg
CO2 / year which is 0.7% of M.0.EL emissions. 2022 Emissions have
changed by -2.6% (-20.21 Gg CO2 /
year). 1990-2022 Emissions have changed by -0.1% (-0.61 Gg CO2 / year). For 2022 the
changes per gas
are:

third party scenario (HISTTP):
Most important changes per time frame
For 2022 the following sector-gas combinations have the highest absolute impact on national total KyotoGHG (AR6GWP100) emissions in 2022 (top 5):
- 1: 1.A, CO2 with 4126.97 Gg CO2 / year (5.2%)
- 2: 3.A, CH4 with 628.61 Gg CO2 / year (11.9%)
- 3: 1.B.1, CH4 with -383.48 Gg CO2 / year (-49.7%)
- 4: M.AG.ELV, N2O with 362.34 Gg CO2 / year (9.1%)
- 5: 4, CH4 with 281.16 Gg CO2 / year (1.9%)
For 1990-2022 the following sector-gas combinations have the highest absolute impact on national total KyotoGHG (AR6GWP100) emissions in 1990-2022 (top 5):
- 1: 1.A, CO2 with 617.25 Gg CO2 / year (1.0%)
- 2: 1.B.2, CH4 with -249.10 Gg CO2 / year (-9.8%)
- 3: 2, CO2 with -82.82 Gg CO2 / year (-4.1%)
- 4: M.AG.ELV, N2O with 44.71 Gg CO2 / year (1.0%)
- 5: M.AG.ELV, CO2 with 34.08 Gg CO2 / year (11.6%)
Changes in the main sectors for aggregate KyotoGHG (AR6GWP100) are
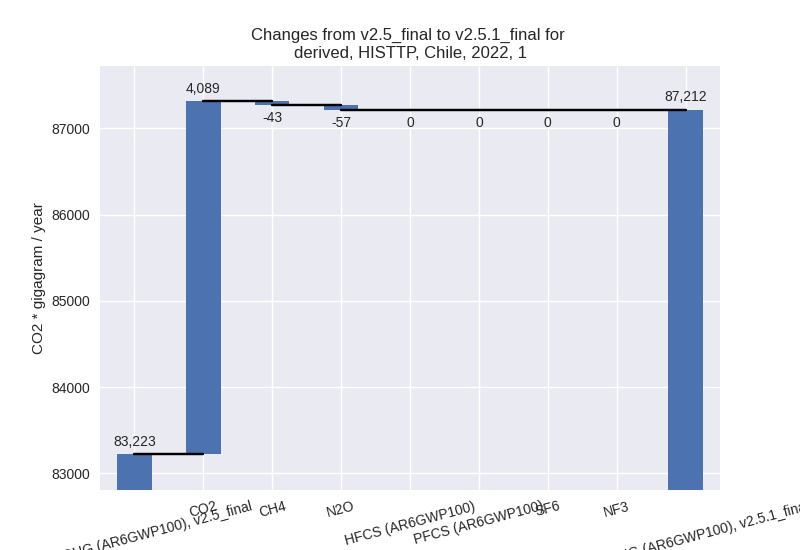
- 1: Total sectoral emissions in 2022 are 87212.34 Gg
CO2 / year which is 68.2% of M.0.EL emissions. 2022 Emissions have
changed by 4.8% (3989.20 Gg CO2 /
year). 1990-2022 Emissions have changed by 0.6% (415.26 Gg CO2 / year). For 2022 the
changes per gas
are:
The changes come from the following subsectors:- 1.A: Total sectoral emissions in 2022 are 85617.19
Gg CO2 / year which is 98.2% of category 1 emissions. 2022 Emissions
have changed by 5.1% (4159.25 Gg CO2
/ year). 1990-2022 Emissions have changed by 1.0% (620.43 Gg CO2 / year). For 2022 the
changes per gas
are:

There is no subsector information available in PRIMAP-hist. - 1.B.1: Total sectoral emissions in 2022 are 393.01
Gg CO2 / year which is 0.5% of category 1 emissions. 2022 Emissions have
changed by -50.7% (-404.71 Gg CO2 /
year). 1990-2022 Emissions have changed by 4.0% (44.66 Gg CO2 / year). For 2022 the
changes per gas
are:

For 1990-2022 the changes per gas are:
There is no subsector information available in PRIMAP-hist. - 1.B.2: Total sectoral emissions in 2022 are 1202.15
Gg CO2 / year which is 1.4% of category 1 emissions. 2022 Emissions have
changed by 24.3% (234.66 Gg CO2 /
year). 1990-2022 Emissions have changed by -8.6% (-249.82 Gg CO2 / year). For 2022
the changes per gas
are:
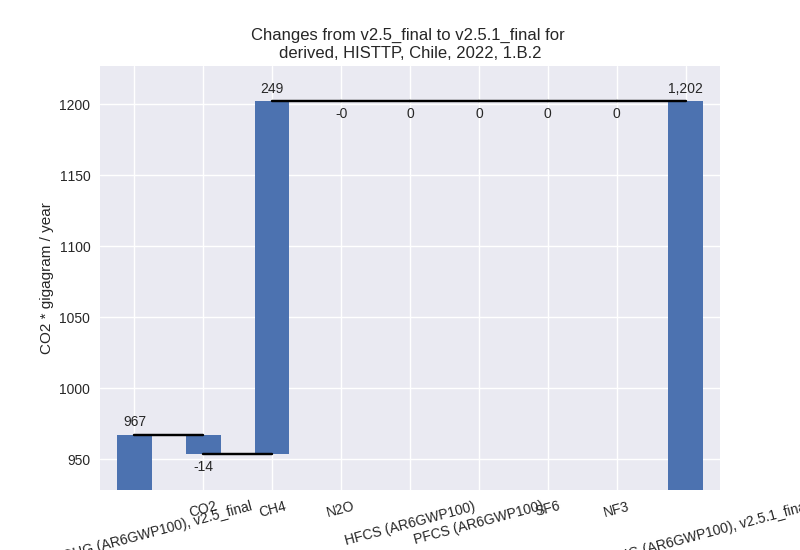
For 1990-2022 the changes per gas are: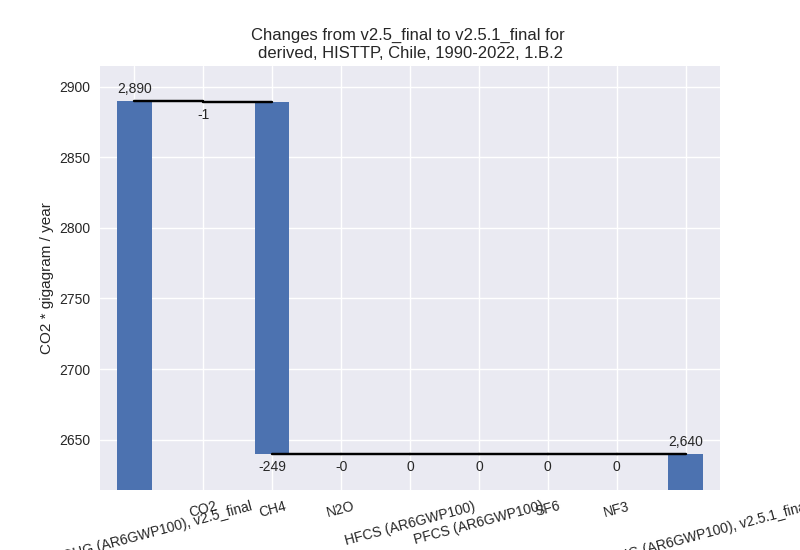
There is no subsector information available in PRIMAP-hist.
- 1.A: Total sectoral emissions in 2022 are 85617.19
Gg CO2 / year which is 98.2% of category 1 emissions. 2022 Emissions
have changed by 5.1% (4159.25 Gg CO2
/ year). 1990-2022 Emissions have changed by 1.0% (620.43 Gg CO2 / year). For 2022 the
changes per gas
are:
- 2: Total sectoral emissions in 2022 are 13366.37 Gg CO2 / year which is 10.4% of M.0.EL emissions. 2022 Emissions have changed by -0.2% (-25.83 Gg CO2 / year). 1990-2022 Emissions have changed by -1.9% (-106.97 Gg CO2 / year).
- M.AG: Total sectoral emissions in 2022 are 11178.18
Gg CO2 / year which is 8.7% of M.0.EL emissions. 2022 Emissions have
changed by 10.8% (1092.29 Gg CO2 /
year). 1990-2022 Emissions have changed by 0.7% (85.77 Gg CO2 / year). For 2022 the
changes per gas
are:

The changes come from the following subsectors:- 3.A: Total sectoral emissions in 2022 are 6258.42
Gg CO2 / year which is 56.0% of category M.AG emissions. 2022 Emissions
have changed by 11.3% (637.83 Gg CO2
/ year). 1990-2022 Emissions have changed by 0.1% (7.97 Gg CO2 / year). For 2022 the
changes per gas
are:
There is no subsector information available in PRIMAP-hist. - M.AG.ELV: Total sectoral emissions in 2022 are
4919.76 Gg CO2 / year which is 44.0% of category M.AG emissions. 2022
Emissions have changed by 10.2%
(454.45 Gg CO2 / year). 1990-2022 Emissions have changed by 1.6% (77.80 Gg CO2 / year). For 2022 the
changes per gas
are:
There is no subsector information available in PRIMAP-hist.
- 3.A: Total sectoral emissions in 2022 are 6258.42
Gg CO2 / year which is 56.0% of category M.AG emissions. 2022 Emissions
have changed by 11.3% (637.83 Gg CO2
/ year). 1990-2022 Emissions have changed by 0.1% (7.97 Gg CO2 / year). For 2022 the
changes per gas
are:
- 4: Total sectoral emissions in 2022 are 15391.26 Gg CO2 / year which is 12.0% of M.0.EL emissions. 2022 Emissions have changed by 1.9% (282.18 Gg CO2 / year). 1990-2022 Emissions have changed by 0.1% (8.55 Gg CO2 / year).
- 5: Total sectoral emissions in 2022 are 760.23 Gg
CO2 / year which is 0.6% of M.0.EL emissions. 2022 Emissions have
changed by -2.6% (-20.21 Gg CO2 /
year). 1990-2022 Emissions have changed by -0.1% (-0.61 Gg CO2 / year). For 2022 the
changes per gas
are:
