Changes in PRIMAP-hist v2.5.1_final compared to v2.5_final for China
2024-02-29
Johannes Gütschow
Change analysis for China for PRIMAP-hist v2.5.1_final compared to v2.5_final
Overview over emissions by sector and gas
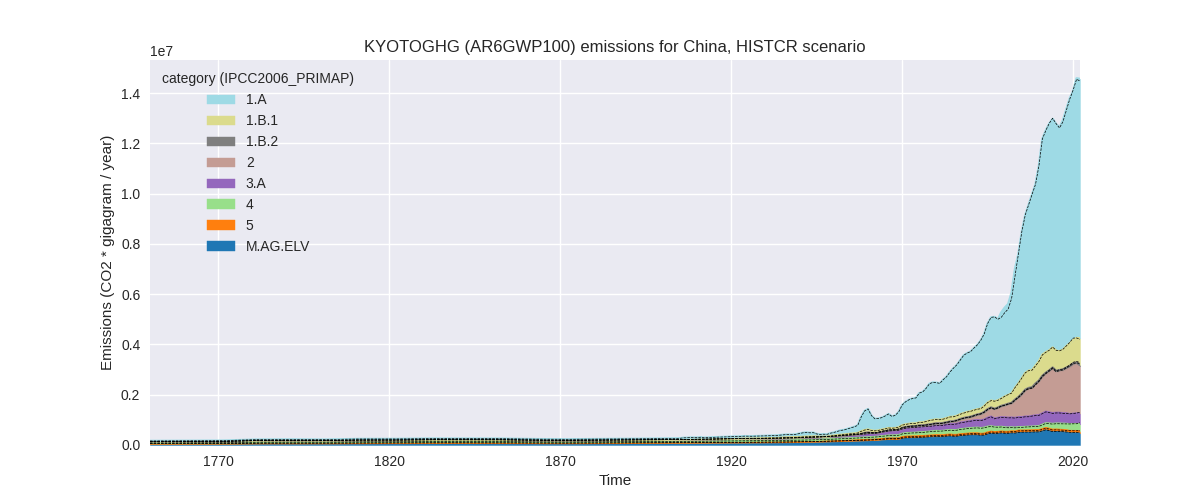
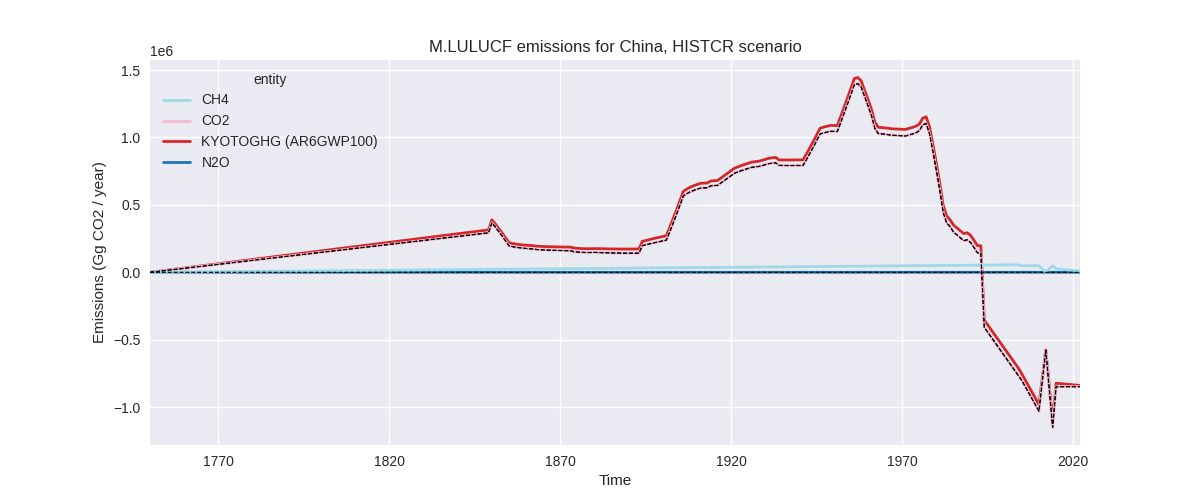
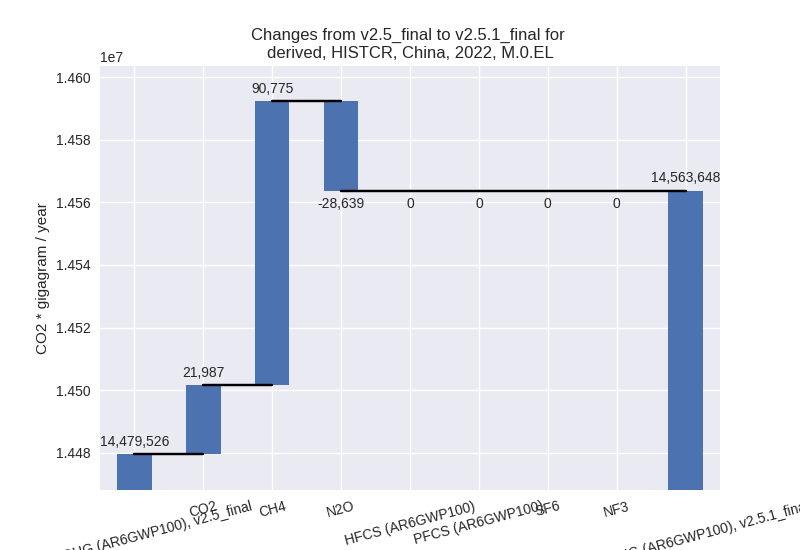
The following figures show the aggregate national total emissions excluding LULUCF AR6GWP100 for the country reported priority scenario. The dotted linesshow the v2.5_final data.

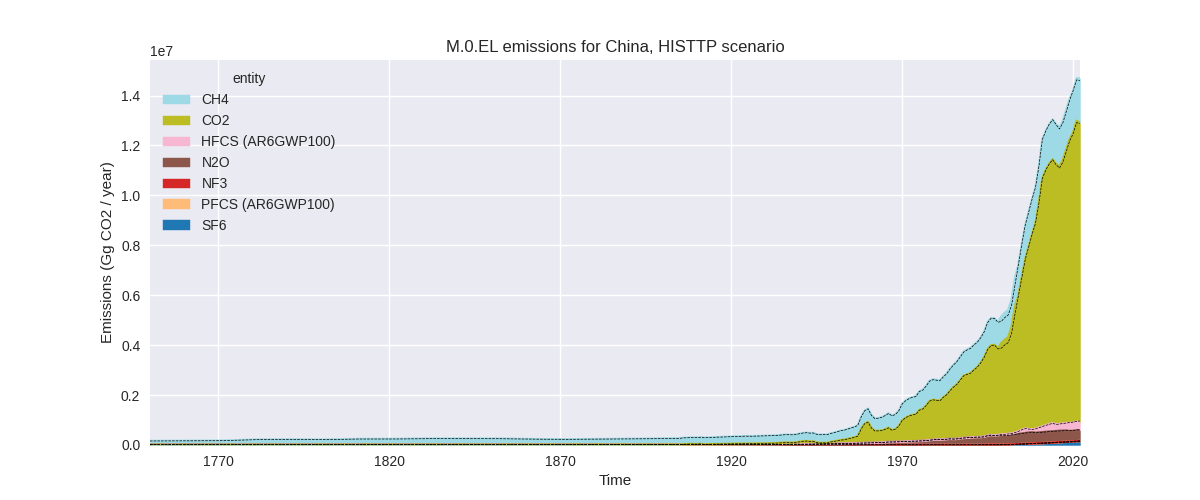
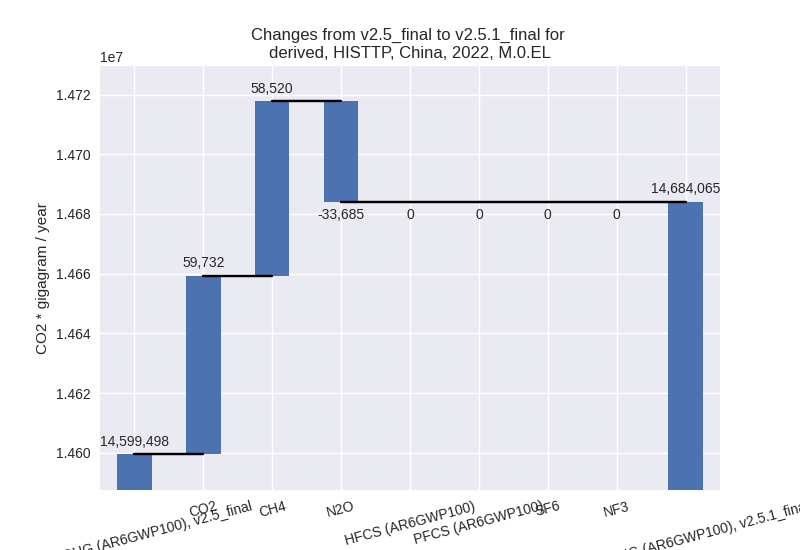
The following figures show the aggregate national total emissions excluding LULUCF AR6GWP100 for the third party priority scenario. The dotted linesshow the v2.5_final data.


Overview over changes
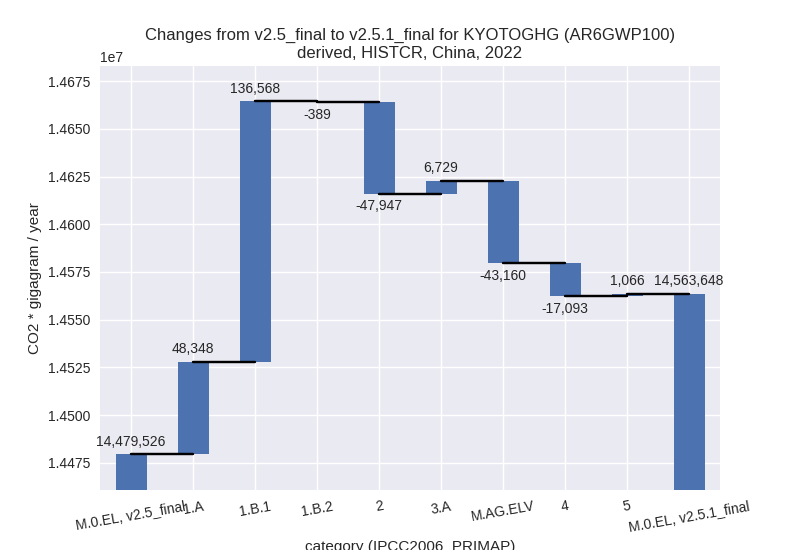
In the country reported priority scenario we have the following changes for aggregate Kyoto GHG and national total emissions excluding LULUCF (M.0.EL):
- Emissions in 2022 have changed by 0.6%% (84122.00 Gg CO2 / year)
- Emissions in 1990-2022 have changed by 0.4%% (35016.28 Gg CO2 / year)
In the third party priority scenario we have the following changes for aggregate Kyoto GHG and national total emissions excluding LULUCF (M.0.EL):
- Emissions in 2022 have changed by 0.6%% (84567.00 Gg CO2 / year)
- Emissions in 1990-2022 have changed by 0.5%% (42371.52 Gg CO2 / year)
Most important changes per scenario and time frame
In the country reported priority scenario the following sector-gas combinations have the highest absolute impact on national total KyotoGHG (AR6GWP100) emissions in 2022 (top 5):
- 1: 1.B.1, CH4 with 106804.07 Gg CO2 / year (18.7%)
- 2: 2, CO2 with -47355.20 Gg CO2 / year (-3.4%)
- 3: 1.A, CO2 with 42875.00 Gg CO2 / year (0.4%)
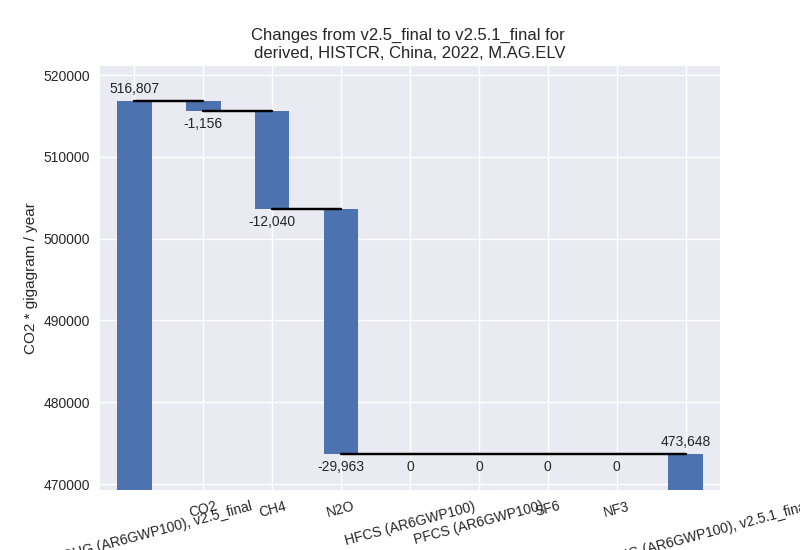
- 4: M.AG.ELV, N2O with -29963.43 Gg CO2 / year (-12.5%)
- 5: 1.B.1, CO2 with 29763.79 Gg CO2 / year (8.4%)
In the country reported priority scenario the following sector-gas combinations have the highest absolute impact on national total KyotoGHG (AR6GWP100) emissions in 1990-2022 (top 5):
- 1: 1.A, CO2 with 46672.79 Gg CO2 / year (0.8%)
- 2: 2, CO2 with -6077.15 Gg CO2 / year (-0.7%)
- 3: 1.B.1, CO2 with -4483.90 Gg CO2 / year (-3.4%)
- 4: M.AG.ELV, N2O with -2473.86 Gg CO2 / year (-1.0%)
- 5: M.AG.ELV, CO2 with 1464.12 Gg CO2 / year (7.2%)
In the third party priority scenario the following sector-gas combinations have the highest absolute impact on national total KyotoGHG (AR6GWP100) emissions in 2022 (top 5):
- 1: 1.B.1, CH4 with 69785.54 Gg CO2 / year (10.5%)
- 2: 1.A, CO2 with 53892.00 Gg CO2 / year (0.5%)
- 3: M.AG.ELV, N2O with -36909.94 Gg CO2 / year (-13.4%)
- 4: 1.B.1, CO2 with 29763.79 Gg CO2 / year (8.4%)
- 5: 2, CO2 with -22675.80 Gg CO2 / year (-1.8%)
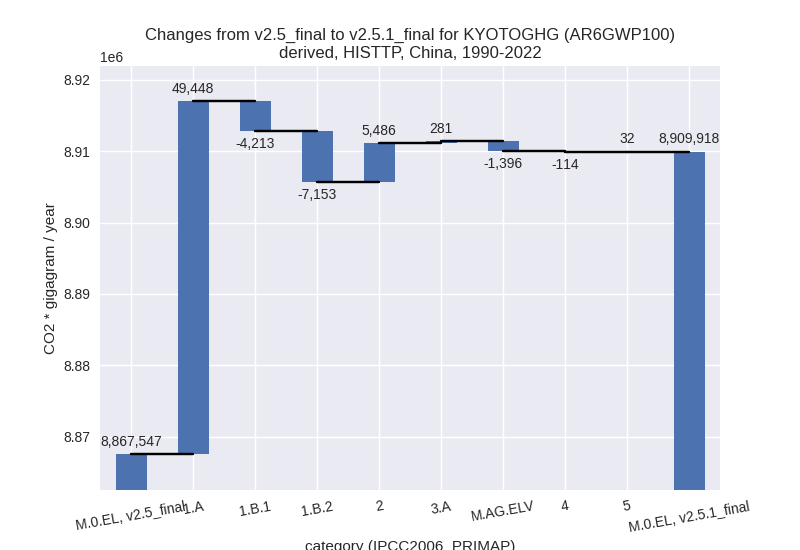
In the third party priority scenario the following sector-gas combinations have the highest absolute impact on national total KyotoGHG (AR6GWP100) emissions in 1990-2022 (top 5):
- 1: 1.A, CO2 with 48457.00 Gg CO2 / year (0.8%)
- 2: 1.B.2, CH4 with -7152.85 Gg CO2 / year (-11.1%)
- 3: 2, CO2 with 5432.17 Gg CO2 / year (0.7%)
- 4: 1.B.1, CO2 with -4483.90 Gg CO2 / year (-3.4%)
- 5: M.AG.ELV, N2O with -2694.14 Gg CO2 / year (-1.0%)
Notes on data changes
No country specific notes present for this changelog.
Changes by sector and gas
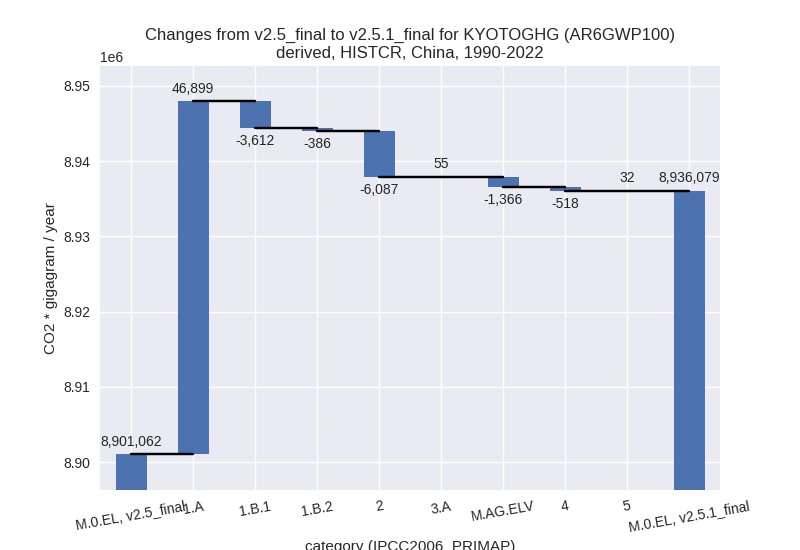
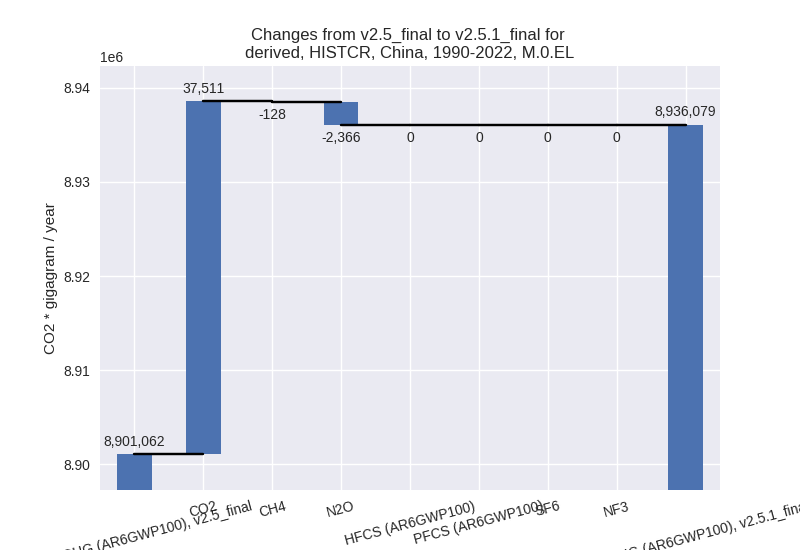
For each scenario and time frame the changes are displayed for all individual sectors and all individual gases. In the sector plot we use aggregate Kyoto GHGs in AR6GWP100. In the gas plot we usenational total emissions without LULUCF. ## country reported scenario
2022
1990-2022
third party scenario
2022

1990-2022

Detailed changes for the scenarios:
country reported scenario (HISTCR):
Most important changes per time frame
For 2022 the following sector-gas combinations have the highest absolute impact on national total KyotoGHG (AR6GWP100) emissions in 2022 (top 5):
- 1: 1.B.1, CH4 with 106804.07 Gg CO2 / year (18.7%)
- 2: 2, CO2 with -47355.20 Gg CO2 / year (-3.4%)
- 3: 1.A, CO2 with 42875.00 Gg CO2 / year (0.4%)
- 4: M.AG.ELV, N2O with -29963.43 Gg CO2 / year (-12.5%)
- 5: 1.B.1, CO2 with 29763.79 Gg CO2 / year (8.4%)
For 1990-2022 the following sector-gas combinations have the highest absolute impact on national total KyotoGHG (AR6GWP100) emissions in 1990-2022 (top 5):
- 1: 1.A, CO2 with 46672.79 Gg CO2 / year (0.8%)
- 2: 2, CO2 with -6077.15 Gg CO2 / year (-0.7%)
- 3: 1.B.1, CO2 with -4483.90 Gg CO2 / year (-3.4%)
- 4: M.AG.ELV, N2O with -2473.86 Gg CO2 / year (-1.0%)
- 5: M.AG.ELV, CO2 with 1464.12 Gg CO2 / year (7.2%)
Changes in the main sectors for aggregate KyotoGHG (AR6GWP100) are
- 1: Total sectoral emissions in 2022 are 11435012.00 Gg CO2 / year which is 78.5% of M.0.EL emissions. 2022 Emissions have changed by 1.6% (184527.00 Gg CO2 / year). 1990-2022 Emissions have changed by 0.6% (42900.35 Gg CO2 / year).
- 2: Total sectoral emissions in 2022 are 1879625.70
Gg CO2 / year which is 12.9% of M.0.EL emissions. 2022 Emissions have
changed by -2.5% (-47946.90 Gg CO2 /
year). 1990-2022 Emissions have changed by -0.6% (-6087.10 Gg CO2 / year). For 2022
the changes per gas
are:

- M.AG: Total sectoral emissions in 2022 are
898145.34 Gg CO2 / year which is 6.2% of M.0.EL emissions. 2022
Emissions have changed by -3.9%
(-36430.56 Gg CO2 / year). 1990-2022 Emissions have changed by -0.1% (-1311.27 Gg CO2 / year). For 2022
the changes per gas
are:
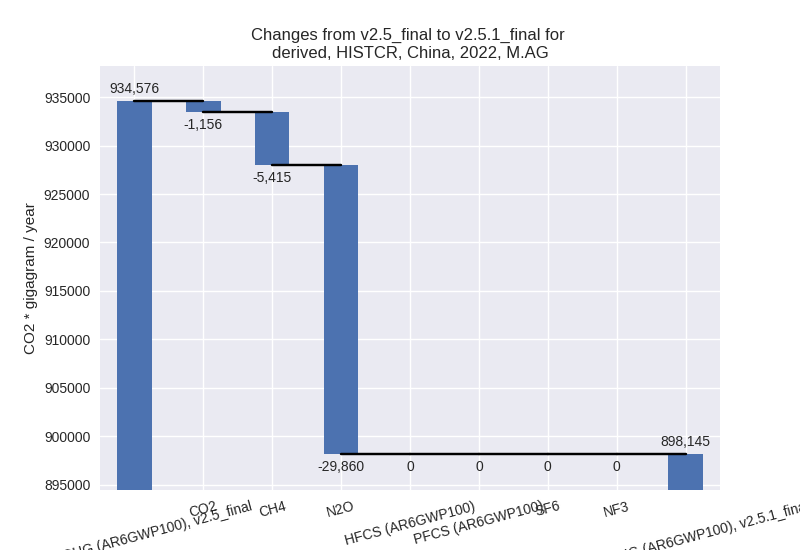
The changes come from the following subsectors:- 3.A: Total sectoral emissions in 2022 are 424497.83 Gg CO2 / year which is 47.3% of category M.AG emissions. 2022 Emissions have changed by 1.6% (6729.33 Gg CO2 / year). 1990-2022 Emissions have changed by 0.0% (54.77 Gg CO2 / year).
- M.AG.ELV: Total sectoral emissions in 2022 are
473647.52 Gg CO2 / year which is 52.7% of category M.AG emissions. 2022
Emissions have changed by -8.4%
(-43159.88 Gg CO2 / year). 1990-2022 Emissions have changed by -0.3% (-1366.04 Gg CO2 / year). For 2022
the changes per gas
are:
There is no subsector information available in PRIMAP-hist.
- 4: Total sectoral emissions in 2022 are 285205.70
Gg CO2 / year which is 2.0% of M.0.EL emissions. 2022 Emissions have
changed by -5.7% (-17093.12 Gg CO2 /
year). 1990-2022 Emissions have changed by -0.3% (-517.97 Gg CO2 / year). For 2022
the changes per gas
are:

- 5: Total sectoral emissions in 2022 are 65660.04 Gg CO2 / year which is 0.5% of M.0.EL emissions. 2022 Emissions have changed by 1.7% (1066.43 Gg CO2 / year). 1990-2022 Emissions have changed by 0.1% (32.32 Gg CO2 / year).
third party scenario (HISTTP):
Most important changes per time frame
For 2022 the following sector-gas combinations have the highest absolute impact on national total KyotoGHG (AR6GWP100) emissions in 2022 (top 5):
- 1: 1.B.1, CH4 with 69785.54 Gg CO2 / year (10.5%)
- 2: 1.A, CO2 with 53892.00 Gg CO2 / year (0.5%)
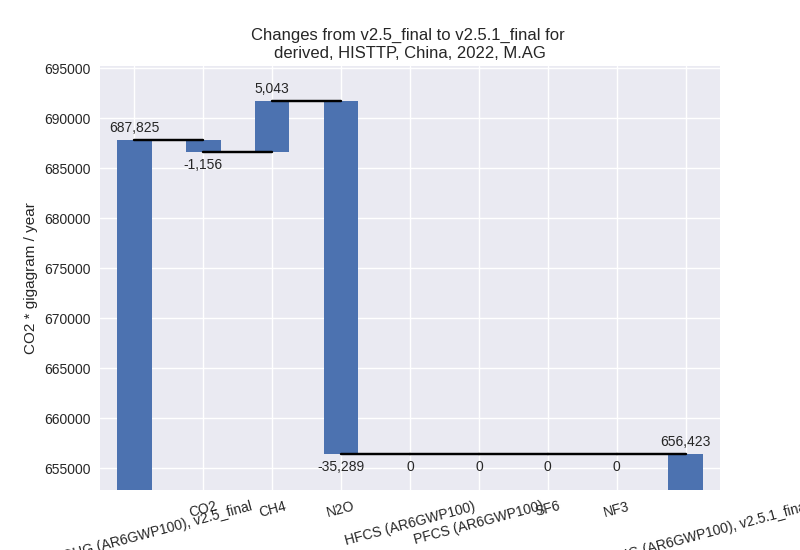
- 3: M.AG.ELV, N2O with -36909.94 Gg CO2 / year (-13.4%)
- 4: 1.B.1, CO2 with 29763.79 Gg CO2 / year (8.4%)
- 5: 2, CO2 with -22675.80 Gg CO2 / year (-1.8%)
For 1990-2022 the following sector-gas combinations have the highest absolute impact on national total KyotoGHG (AR6GWP100) emissions in 1990-2022 (top 5):
- 1: 1.A, CO2 with 48457.00 Gg CO2 / year (0.8%)
- 2: 1.B.2, CH4 with -7152.85 Gg CO2 / year (-11.1%)
- 3: 2, CO2 with 5432.17 Gg CO2 / year (0.7%)
- 4: 1.B.1, CO2 with -4483.90 Gg CO2 / year (-3.4%)
- 5: M.AG.ELV, N2O with -2694.14 Gg CO2 / year (-1.0%)
Changes in the main sectors for aggregate KyotoGHG (AR6GWP100) are
- 1: Total sectoral emissions in 2022 are 11698281.00 Gg CO2 / year which is 79.7% of M.0.EL emissions. 2022 Emissions have changed by 1.2% (143357.00 Gg CO2 / year). 1990-2022 Emissions have changed by 0.6% (38082.34 Gg CO2 / year).
- 2: Total sectoral emissions in 2022 are 1764291.00 Gg CO2 / year which is 12.0% of M.0.EL emissions. 2022 Emissions have changed by -1.4% (-24709.10 Gg CO2 / year). 1990-2022 Emissions have changed by 0.6% (5486.06 Gg CO2 / year).
- M.AG: Total sectoral emissions in 2022 are
656423.37 Gg CO2 / year which is 4.5% of M.0.EL emissions. 2022
Emissions have changed by -4.6%
(-31401.55 Gg CO2 / year). 1990-2022 Emissions have changed by -0.2% (-1115.76 Gg CO2 / year). For 2022
the changes per gas
are:
The changes come from the following subsectors:- 3.A: Total sectoral emissions in 2022 are 253818.22
Gg CO2 / year which is 38.7% of category M.AG emissions. 2022 Emissions
have changed by 5.1% (12202.55 Gg
CO2 / year). 1990-2022 Emissions have changed by 0.1% (280.64 Gg CO2 / year). For 2022 the
changes per gas
are:

There is no subsector information available in PRIMAP-hist. - M.AG.ELV: Total sectoral emissions in 2022 are
402605.14 Gg CO2 / year which is 61.3% of category M.AG emissions. 2022
Emissions have changed by -9.8%
(-43604.10 Gg CO2 / year). 1990-2022 Emissions have changed by -0.3% (-1396.40 Gg CO2 / year). For 2022
the changes per gas
are:

There is no subsector information available in PRIMAP-hist.
- 3.A: Total sectoral emissions in 2022 are 253818.22
Gg CO2 / year which is 38.7% of category M.AG emissions. 2022 Emissions
have changed by 5.1% (12202.55 Gg
CO2 / year). 1990-2022 Emissions have changed by 0.1% (280.64 Gg CO2 / year). For 2022 the
changes per gas
are:
- 4: Total sectoral emissions in 2022 are 499409.41 Gg CO2 / year which is 3.4% of M.0.EL emissions. 2022 Emissions have changed by -0.7% (-3745.88 Gg CO2 / year). 1990-2022 Emissions have changed by -0.0% (-113.51 Gg CO2 / year).
- 5: Total sectoral emissions in 2022 are 65660.04 Gg CO2 / year which is 0.4% of M.0.EL emissions. 2022 Emissions have changed by 1.7% (1066.43 Gg CO2 / year). 1990-2022 Emissions have changed by 0.1% (32.32 Gg CO2 / year).