Changes in PRIMAP-hist v2.5.1_final compared to v2.5_final for Côte d’Ivoire
2024-02-29
Johannes Gütschow
Change analysis for Côte d’Ivoire for PRIMAP-hist v2.5.1_final compared to v2.5_final
Overview over emissions by sector and gas
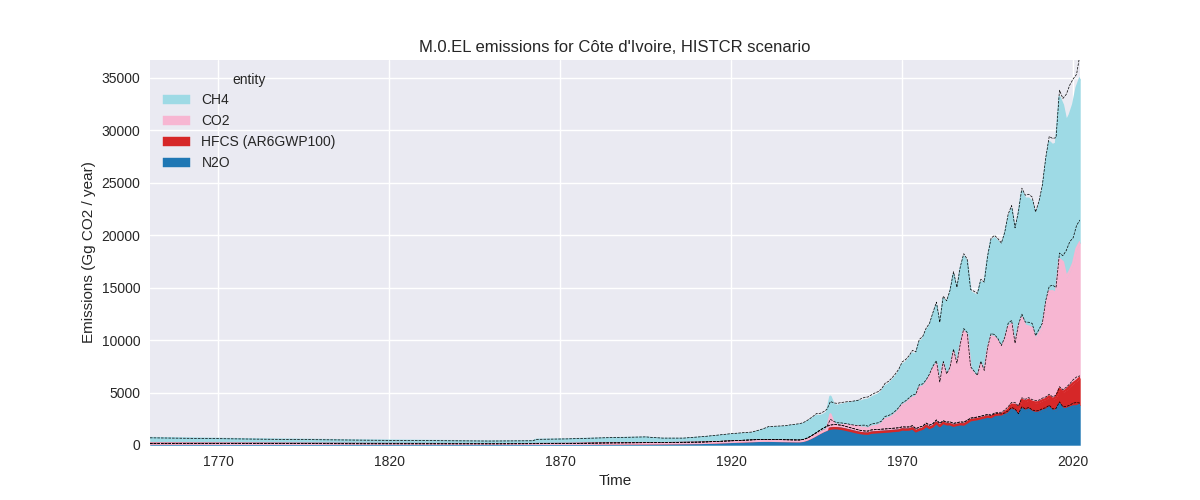
The following figures show the aggregate national total emissions excluding LULUCF AR6GWP100 for the country reported priority scenario. The dotted linesshow the v2.5_final data.


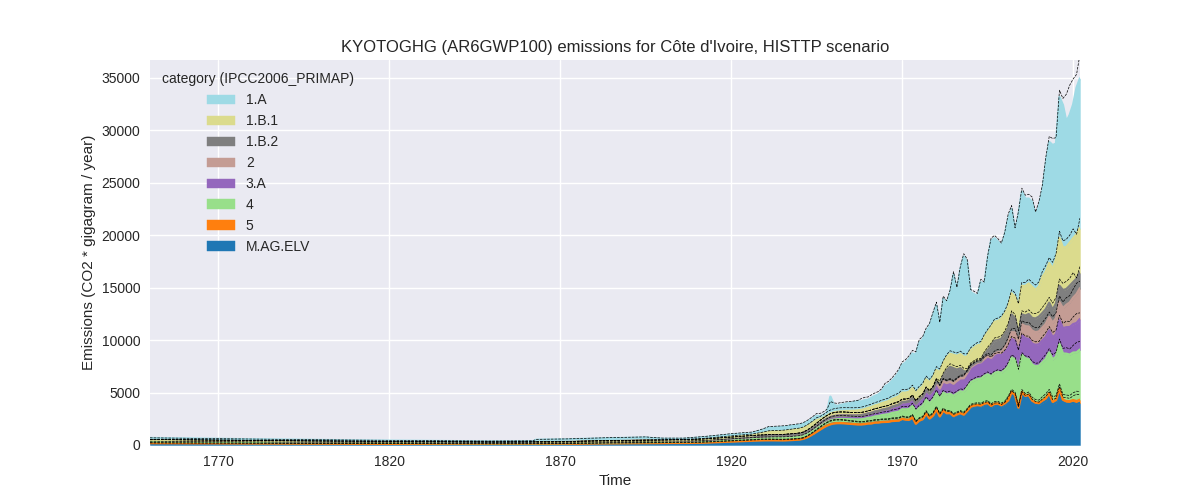
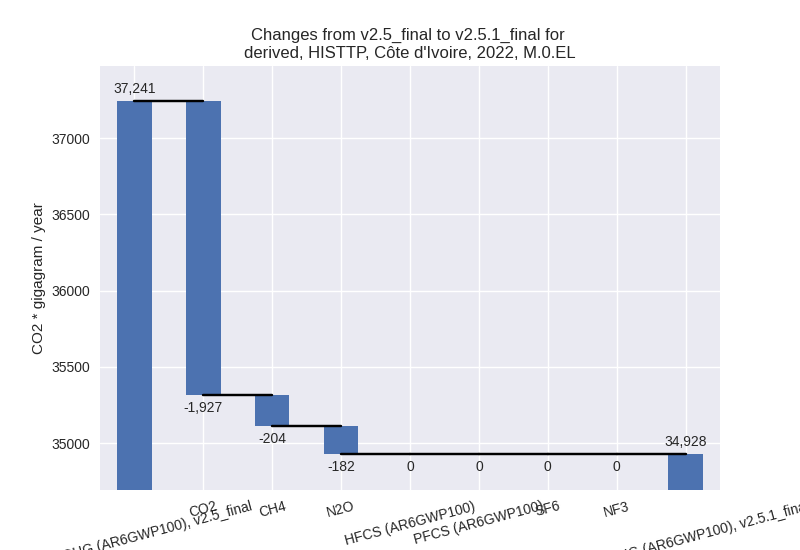
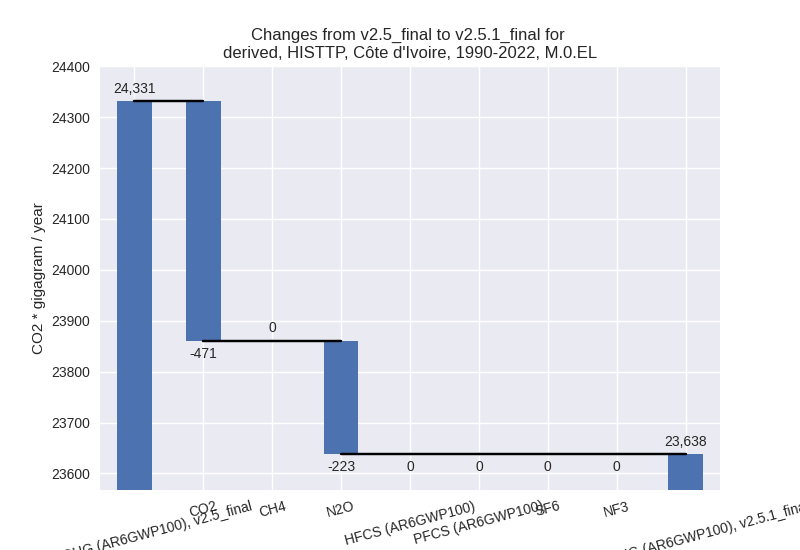
The following figures show the aggregate national total emissions excluding LULUCF AR6GWP100 for the third party priority scenario. The dotted linesshow the v2.5_final data.


Overview over changes
In the country reported priority scenario we have the following changes for aggregate Kyoto GHG and national total emissions excluding LULUCF (M.0.EL):
- Emissions in 2022 have changed by -6.2%% (-2313.30 Gg CO2 / year)
- Emissions in 1990-2022 have changed by -2.9%% (-693.63 Gg CO2 / year)
In the third party priority scenario we have the following changes for aggregate Kyoto GHG and national total emissions excluding LULUCF (M.0.EL):
- Emissions in 2022 have changed by -6.2%% (-2313.30 Gg CO2 / year)
- Emissions in 1990-2022 have changed by -2.9%% (-693.63 Gg CO2 / year)
Most important changes per scenario and time frame
In the country reported priority scenario the following sector-gas combinations have the highest absolute impact on national total KyotoGHG (AR6GWP100) emissions in 2022 (top 5):
- 1: 1.A, CO2 with -1378.65 Gg CO2 / year (-10.0%)
- 2: M.AG.ELV, CO2 with -415.43 Gg CO2 / year (-83.3%)
- 3: 1.B.1, CH4 with -363.36 Gg CO2 / year (-8.0%)
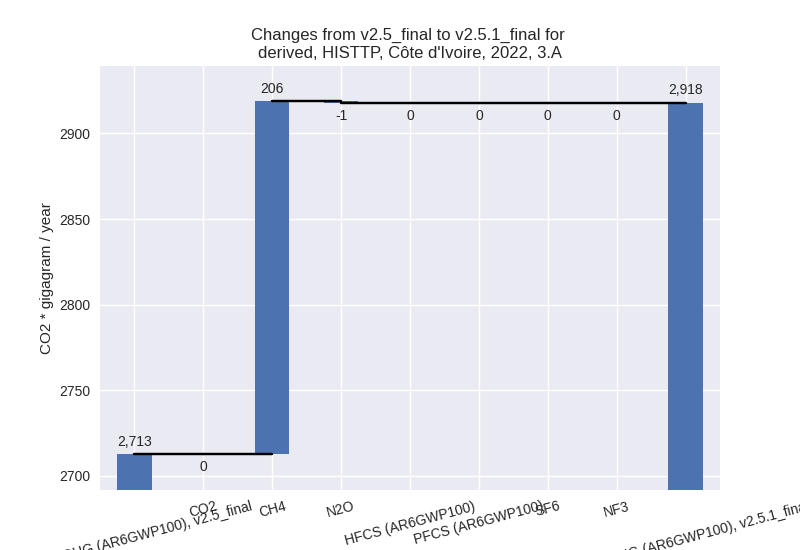
- 4: 3.A, CH4 with 206.30 Gg CO2 / year (7.8%)
- 5: M.AG.ELV, CH4 with -181.48 Gg CO2 / year (-14.3%)
In the country reported priority scenario the following sector-gas combinations have the highest absolute impact on national total KyotoGHG (AR6GWP100) emissions in 1990-2022 (top 5):
- 1: 1.A, CO2 with -253.13 Gg CO2 / year (-3.2%)
- 2: M.AG.ELV, N2O with -223.15 Gg CO2 / year (-8.3%)
- 3: M.AG.ELV, CO2 with -114.08 Gg CO2 / year (-64.3%)
- 4: 2, CO2 with -102.20 Gg CO2 / year (-35.4%)
- 5: M.AG.ELV, CH4 with -18.03 Gg CO2 / year (-1.2%)
In the third party priority scenario the following sector-gas combinations have the highest absolute impact on national total KyotoGHG (AR6GWP100) emissions in 2022 (top 5):
- 1: 1.A, CO2 with -1378.65 Gg CO2 / year (-10.0%)
- 2: M.AG.ELV, CO2 with -415.43 Gg CO2 / year (-83.3%)
- 3: 1.B.1, CH4 with -363.36 Gg CO2 / year (-8.0%)
- 4: 3.A, CH4 with 206.30 Gg CO2 / year (7.8%)
- 5: M.AG.ELV, CH4 with -181.48 Gg CO2 / year (-14.3%)
In the third party priority scenario the following sector-gas combinations have the highest absolute impact on national total KyotoGHG (AR6GWP100) emissions in 1990-2022 (top 5):
- 1: 1.A, CO2 with -253.13 Gg CO2 / year (-3.2%)
- 2: M.AG.ELV, N2O with -223.15 Gg CO2 / year (-8.3%)
- 3: M.AG.ELV, CO2 with -114.08 Gg CO2 / year (-64.3%)
- 4: 2, CO2 with -102.20 Gg CO2 / year (-35.4%)
- 5: M.AG.ELV, CH4 with -18.03 Gg CO2 / year (-1.2%)
Notes on data changes
Here we list notes explaining important emissions changes for the country. ’' means that the following text only applies to the TP time series, while means that it only applies to the CR scenario. Otherwise the note applies to both scenarios.
General note: We have no country reported data for Côte d’Ivoire, thus the CR and TP time-series are identical except for LULUCF.
- 1.A, CO2: CDIAC 2023 data shows an emissions decline in 2018 which is not present in EI 2023 thus PRIMAP-hist emissions are lower since 2018.
- M.AG.ELV, CO2: While EDGAR 7.0 data had increasing emissions after 2004, in EDGAR 8.0 emissions are comparatively constant with some fluctuations.
- M.AG.ELV, N2O: FAO 2023 data are lower than FAO 2022.
Changes by sector and gas
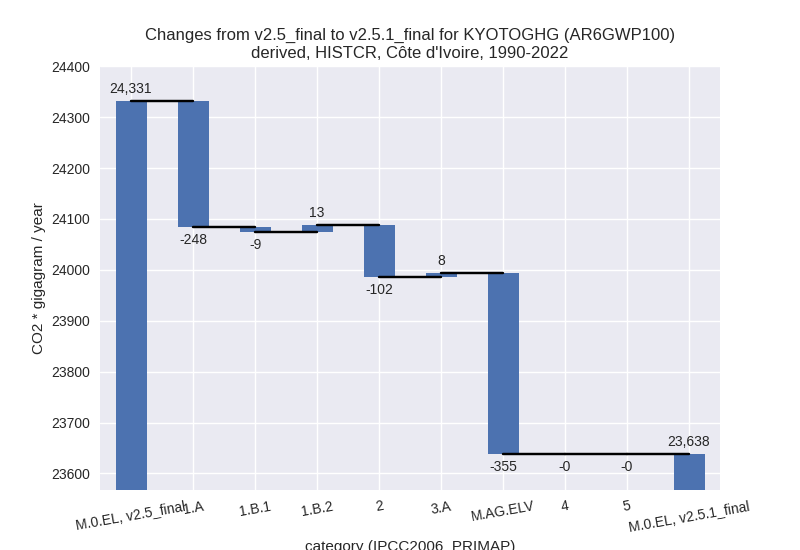
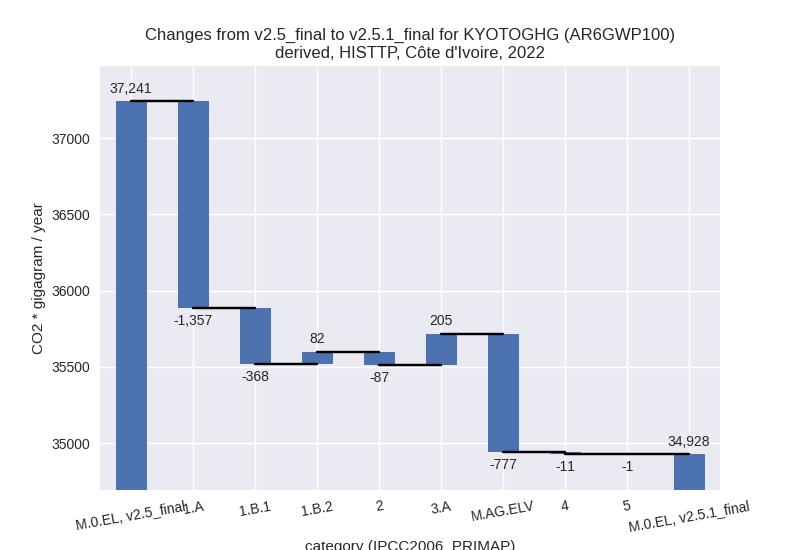
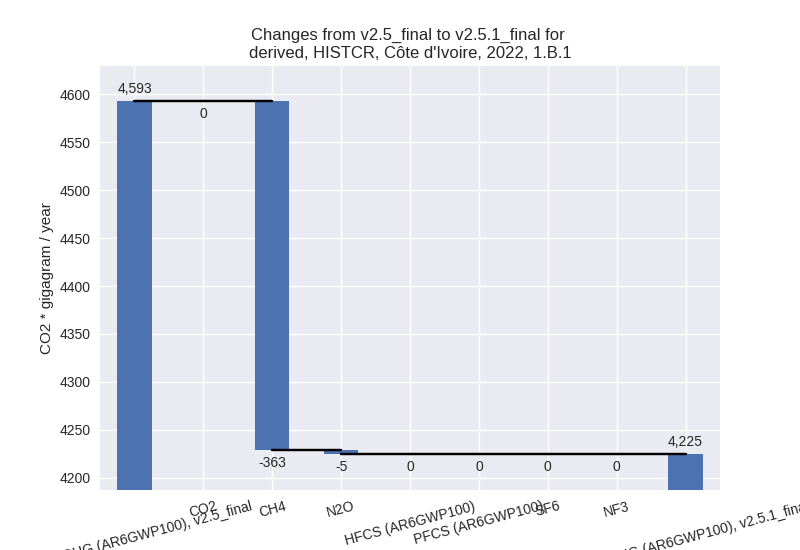
For each scenario and time frame the changes are displayed for all individual sectors and all individual gases. In the sector plot we use aggregate Kyoto GHGs in AR6GWP100. In the gas plot we usenational total emissions without LULUCF. ## country reported scenario
2022


1990-2022

third party scenario
2022
1990-2022

Detailed changes for the scenarios:
country reported scenario (HISTCR):
Most important changes per time frame
For 2022 the following sector-gas combinations have the highest absolute impact on national total KyotoGHG (AR6GWP100) emissions in 2022 (top 5):
- 1: 1.A, CO2 with -1378.65 Gg CO2 / year (-10.0%)
- 2: M.AG.ELV, CO2 with -415.43 Gg CO2 / year (-83.3%)
- 3: 1.B.1, CH4 with -363.36 Gg CO2 / year (-8.0%)
- 4: 3.A, CH4 with 206.30 Gg CO2 / year (7.8%)
- 5: M.AG.ELV, CH4 with -181.48 Gg CO2 / year (-14.3%)
For 1990-2022 the following sector-gas combinations have the highest absolute impact on national total KyotoGHG (AR6GWP100) emissions in 1990-2022 (top 5):
- 1: 1.A, CO2 with -253.13 Gg CO2 / year (-3.2%)
- 2: M.AG.ELV, N2O with -223.15 Gg CO2 / year (-8.3%)
- 3: M.AG.ELV, CO2 with -114.08 Gg CO2 / year (-64.3%)
- 4: 2, CO2 with -102.20 Gg CO2 / year (-35.4%)
- 5: M.AG.ELV, CH4 with -18.03 Gg CO2 / year (-1.2%)
Changes in the main sectors for aggregate KyotoGHG (AR6GWP100) are
- 1: Total sectoral emissions in 2022 are 19987.07 Gg
CO2 / year which is 57.2% of M.0.EL emissions. 2022 Emissions have
changed by -7.6% (-1642.64 Gg CO2 /
year). 1990-2022 Emissions have changed by -1.9% (-244.07 Gg CO2 / year). For 2022
the changes per gas
are:

The changes come from the following subsectors:- 1.A: Total sectoral emissions in 2022 are 14263.63
Gg CO2 / year which is 71.4% of category 1 emissions. 2022 Emissions
have changed by -8.7% (-1356.61 Gg
CO2 / year). 1990-2022 Emissions have changed by -2.7% (-247.85 Gg CO2 / year). For 2022
the changes per gas
are:

For 1990-2022 the changes per gas are: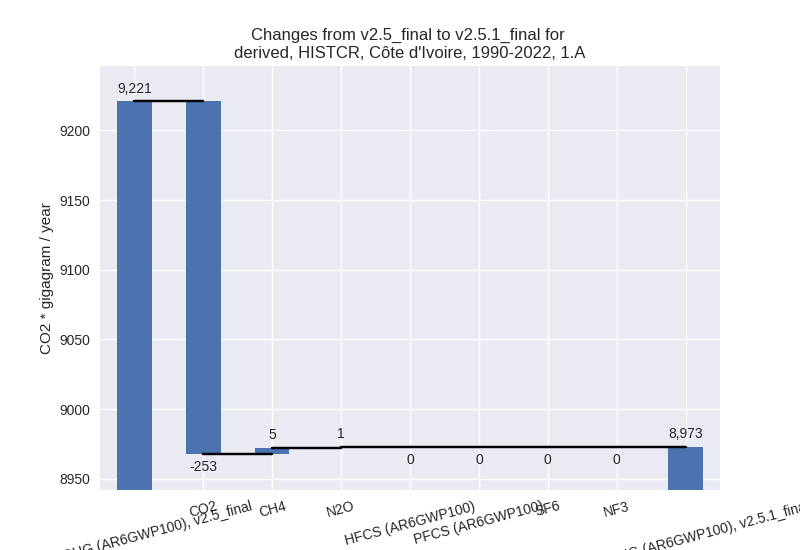
There is no subsector information available in PRIMAP-hist. - 1.B.1: Total sectoral emissions in 2022 are 4224.59
Gg CO2 / year which is 21.1% of category 1 emissions. 2022 Emissions
have changed by -8.0% (-368.18 Gg
CO2 / year). 1990-2022 Emissions have changed by -0.3% (-9.12 Gg CO2 / year). For 2022 the
changes per gas
are:
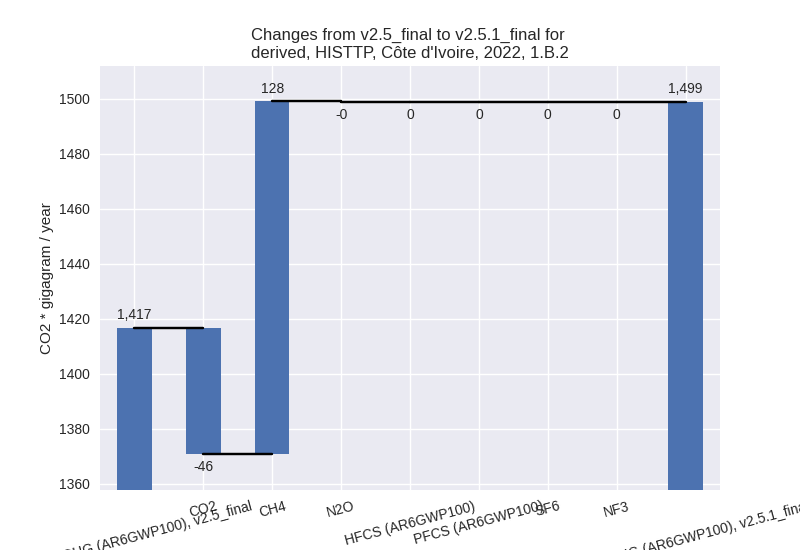
There is no subsector information available in PRIMAP-hist. - 1.B.2: Total sectoral emissions in 2022 are 1498.85
Gg CO2 / year which is 7.5% of category 1 emissions. 2022 Emissions have
changed by 5.8% (82.15 Gg CO2 /
year). 1990-2022 Emissions have changed by 1.2% (12.90 Gg CO2 / year). For 2022 the
changes per gas
are:

There is no subsector information available in PRIMAP-hist.
- 1.A: Total sectoral emissions in 2022 are 14263.63
Gg CO2 / year which is 71.4% of category 1 emissions. 2022 Emissions
have changed by -8.7% (-1356.61 Gg
CO2 / year). 1990-2022 Emissions have changed by -2.7% (-247.85 Gg CO2 / year). For 2022
the changes per gas
are:
- 2: Total sectoral emissions in 2022 are 2934.33 Gg
CO2 / year which is 8.4% of M.0.EL emissions. 2022 Emissions have
changed by -2.9% (-87.44 Gg CO2 /
year). 1990-2022 Emissions have changed by -8.9% (-102.20 Gg CO2 / year). For 2022
the changes per gas
are:

For 1990-2022 the changes per gas are:
- M.AG: Total sectoral emissions in 2022 are 6926.01
Gg CO2 / year which is 19.8% of M.0.EL emissions. 2022 Emissions have
changed by -7.6% (-571.61 Gg CO2 /
year). 1990-2022 Emissions have changed by -5.5% (-347.02 Gg CO2 / year). For 2022
the changes per gas
are:
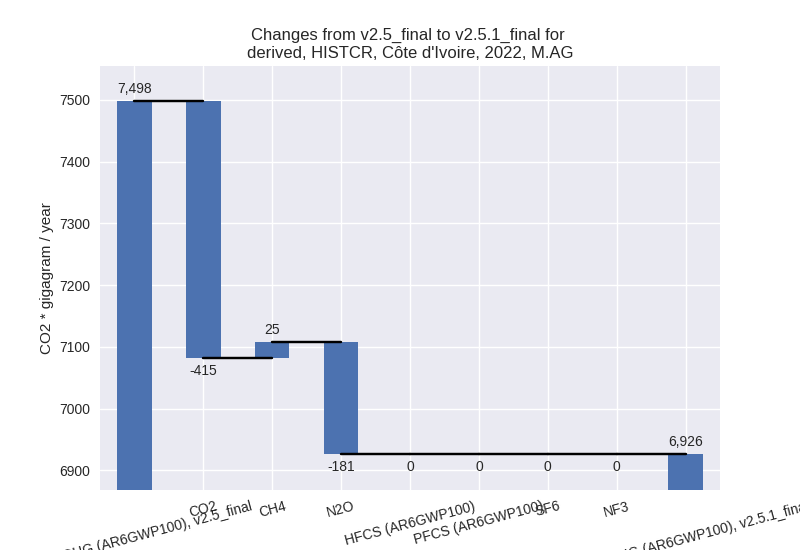
For 1990-2022 the changes per gas are:
The changes come from the following subsectors:- 3.A: Total sectoral emissions in 2022 are 2917.93
Gg CO2 / year which is 42.1% of category M.AG emissions. 2022 Emissions
have changed by 7.6% (205.41 Gg CO2
/ year). 1990-2022 Emissions have changed by 0.4% (8.24 Gg CO2 / year). For 2022 the
changes per gas
are:

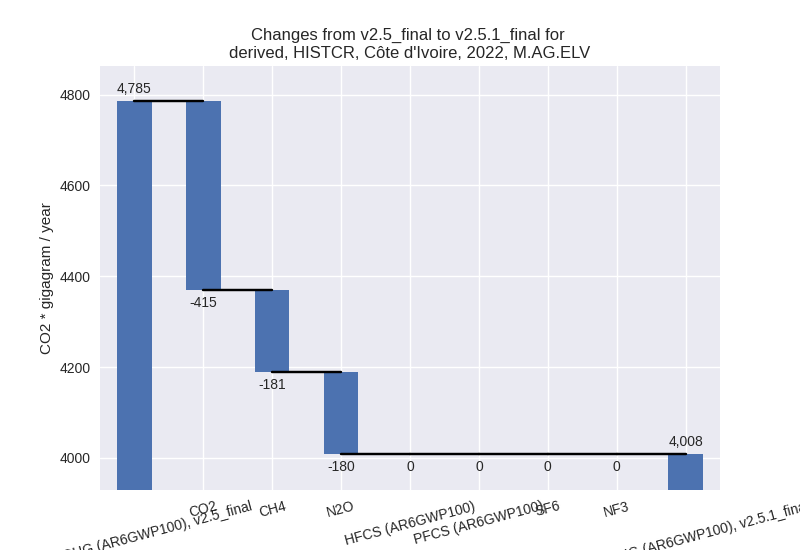
There is no subsector information available in PRIMAP-hist. - M.AG.ELV: Total sectoral emissions in 2022 are
4008.08 Gg CO2 / year which is 57.9% of category M.AG emissions. 2022
Emissions have changed by -16.2%
(-777.02 Gg CO2 / year). 1990-2022 Emissions have changed by -8.1% (-355.26 Gg CO2 / year). For 2022
the changes per gas
are:
For 1990-2022 the changes per gas are: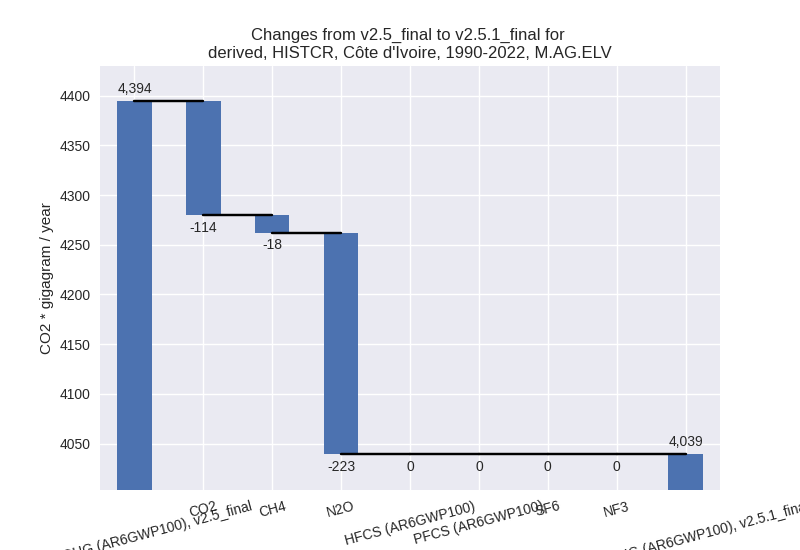
There is no subsector information available in PRIMAP-hist.
- 3.A: Total sectoral emissions in 2022 are 2917.93
Gg CO2 / year which is 42.1% of category M.AG emissions. 2022 Emissions
have changed by 7.6% (205.41 Gg CO2
/ year). 1990-2022 Emissions have changed by 0.4% (8.24 Gg CO2 / year). For 2022 the
changes per gas
are:
- 4: Total sectoral emissions in 2022 are 4780.70 Gg CO2 / year which is 13.7% of M.0.EL emissions. 2022 Emissions have changed by -0.2% (-10.83 Gg CO2 / year). 1990-2022 Emissions have changed by -0.0% (-0.33 Gg CO2 / year).
- 5: Total sectoral emissions in 2022 are 299.40 Gg CO2 / year which is 0.9% of M.0.EL emissions. 2022 Emissions have changed by -0.3% (-0.77 Gg CO2 / year). 1990-2022 Emissions have changed by -0.0% (-0.02 Gg CO2 / year).
third party scenario (HISTTP):
Most important changes per time frame
For 2022 the following sector-gas combinations have the highest absolute impact on national total KyotoGHG (AR6GWP100) emissions in 2022 (top 5):
- 1: 1.A, CO2 with -1378.65 Gg CO2 / year (-10.0%)
- 2: M.AG.ELV, CO2 with -415.43 Gg CO2 / year (-83.3%)
- 3: 1.B.1, CH4 with -363.36 Gg CO2 / year (-8.0%)
- 4: 3.A, CH4 with 206.30 Gg CO2 / year (7.8%)
- 5: M.AG.ELV, CH4 with -181.48 Gg CO2 / year (-14.3%)
For 1990-2022 the following sector-gas combinations have the highest absolute impact on national total KyotoGHG (AR6GWP100) emissions in 1990-2022 (top 5):
- 1: 1.A, CO2 with -253.13 Gg CO2 / year (-3.2%)
- 2: M.AG.ELV, N2O with -223.15 Gg CO2 / year (-8.3%)
- 3: M.AG.ELV, CO2 with -114.08 Gg CO2 / year (-64.3%)
- 4: 2, CO2 with -102.20 Gg CO2 / year (-35.4%)
- 5: M.AG.ELV, CH4 with -18.03 Gg CO2 / year (-1.2%)
Changes in the main sectors for aggregate KyotoGHG (AR6GWP100) are
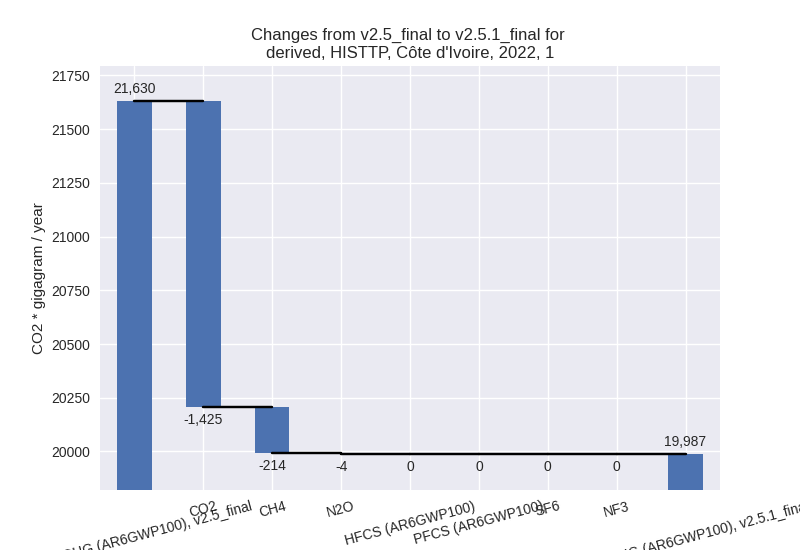
- 1: Total sectoral emissions in 2022 are 19987.07 Gg
CO2 / year which is 57.2% of M.0.EL emissions. 2022 Emissions have
changed by -7.6% (-1642.64 Gg CO2 /
year). 1990-2022 Emissions have changed by -1.9% (-244.07 Gg CO2 / year). For 2022
the changes per gas
are:
The changes come from the following subsectors:- 1.A: Total sectoral emissions in 2022 are 14263.63
Gg CO2 / year which is 71.4% of category 1 emissions. 2022 Emissions
have changed by -8.7% (-1356.61 Gg
CO2 / year). 1990-2022 Emissions have changed by -2.7% (-247.85 Gg CO2 / year). For 2022
the changes per gas
are:

For 1990-2022 the changes per gas are:
There is no subsector information available in PRIMAP-hist. - 1.B.1: Total sectoral emissions in 2022 are 4224.59
Gg CO2 / year which is 21.1% of category 1 emissions. 2022 Emissions
have changed by -8.0% (-368.18 Gg
CO2 / year). 1990-2022 Emissions have changed by -0.3% (-9.12 Gg CO2 / year). For 2022 the
changes per gas
are:

There is no subsector information available in PRIMAP-hist. - 1.B.2: Total sectoral emissions in 2022 are 1498.85
Gg CO2 / year which is 7.5% of category 1 emissions. 2022 Emissions have
changed by 5.8% (82.15 Gg CO2 /
year). 1990-2022 Emissions have changed by 1.2% (12.90 Gg CO2 / year). For 2022 the
changes per gas
are:
There is no subsector information available in PRIMAP-hist.
- 1.A: Total sectoral emissions in 2022 are 14263.63
Gg CO2 / year which is 71.4% of category 1 emissions. 2022 Emissions
have changed by -8.7% (-1356.61 Gg
CO2 / year). 1990-2022 Emissions have changed by -2.7% (-247.85 Gg CO2 / year). For 2022
the changes per gas
are:
- 2: Total sectoral emissions in 2022 are 2934.33 Gg
CO2 / year which is 8.4% of M.0.EL emissions. 2022 Emissions have
changed by -2.9% (-87.44 Gg CO2 /
year). 1990-2022 Emissions have changed by -8.9% (-102.20 Gg CO2 / year). For 2022
the changes per gas
are:

For 1990-2022 the changes per gas are:
- M.AG: Total sectoral emissions in 2022 are 6926.01
Gg CO2 / year which is 19.8% of M.0.EL emissions. 2022 Emissions have
changed by -7.6% (-571.61 Gg CO2 /
year). 1990-2022 Emissions have changed by -5.5% (-347.02 Gg CO2 / year). For 2022
the changes per gas
are:

For 1990-2022 the changes per gas are: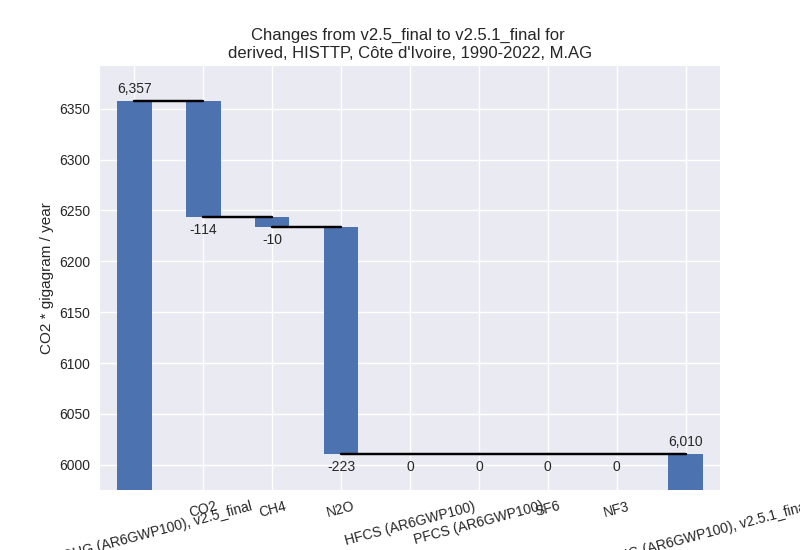
The changes come from the following subsectors:- 3.A: Total sectoral emissions in 2022 are 2917.93
Gg CO2 / year which is 42.1% of category M.AG emissions. 2022 Emissions
have changed by 7.6% (205.41 Gg CO2
/ year). 1990-2022 Emissions have changed by 0.4% (8.24 Gg CO2 / year). For 2022 the
changes per gas
are:
There is no subsector information available in PRIMAP-hist. - M.AG.ELV: Total sectoral emissions in 2022 are
4008.08 Gg CO2 / year which is 57.9% of category M.AG emissions. 2022
Emissions have changed by -16.2%
(-777.02 Gg CO2 / year). 1990-2022 Emissions have changed by -8.1% (-355.26 Gg CO2 / year). For 2022
the changes per gas
are:

For 1990-2022 the changes per gas are:
There is no subsector information available in PRIMAP-hist.
- 3.A: Total sectoral emissions in 2022 are 2917.93
Gg CO2 / year which is 42.1% of category M.AG emissions. 2022 Emissions
have changed by 7.6% (205.41 Gg CO2
/ year). 1990-2022 Emissions have changed by 0.4% (8.24 Gg CO2 / year). For 2022 the
changes per gas
are:
- 4: Total sectoral emissions in 2022 are 4780.70 Gg CO2 / year which is 13.7% of M.0.EL emissions. 2022 Emissions have changed by -0.2% (-10.83 Gg CO2 / year). 1990-2022 Emissions have changed by -0.0% (-0.33 Gg CO2 / year).
- 5: Total sectoral emissions in 2022 are 299.40 Gg CO2 / year which is 0.9% of M.0.EL emissions. 2022 Emissions have changed by -0.3% (-0.77 Gg CO2 / year). 1990-2022 Emissions have changed by -0.0% (-0.02 Gg CO2 / year).