Changes in PRIMAP-hist v2.5.1_final compared to v2.5_final for Colombia
2024-02-29
Johannes Gütschow
Change analysis for Colombia for PRIMAP-hist v2.5.1_final compared to v2.5_final
Overview over emissions by sector and gas
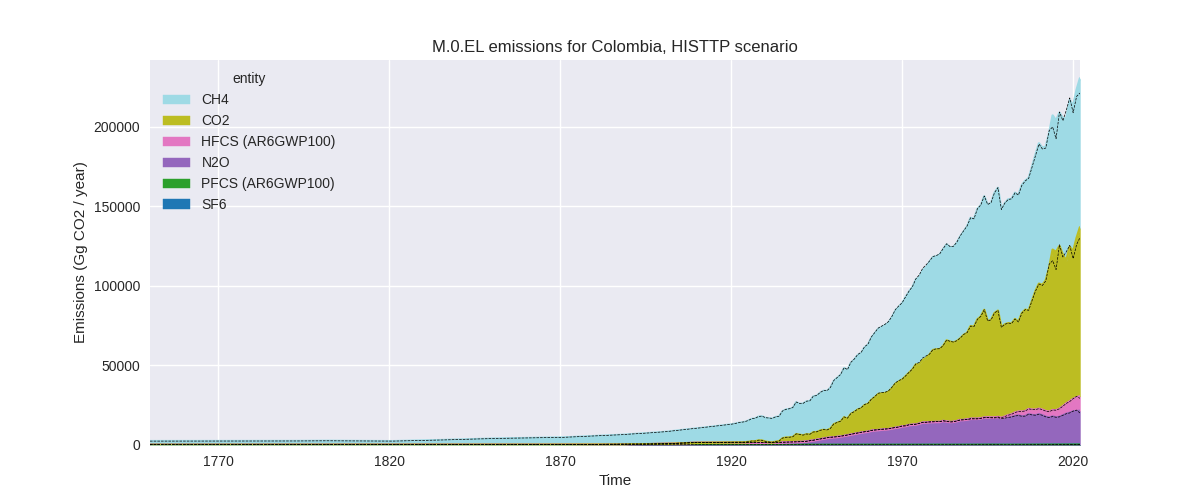
The following figures show the aggregate national total emissions excluding LULUCF AR6GWP100 for the country reported priority scenario. The dotted linesshow the v2.5_final data.


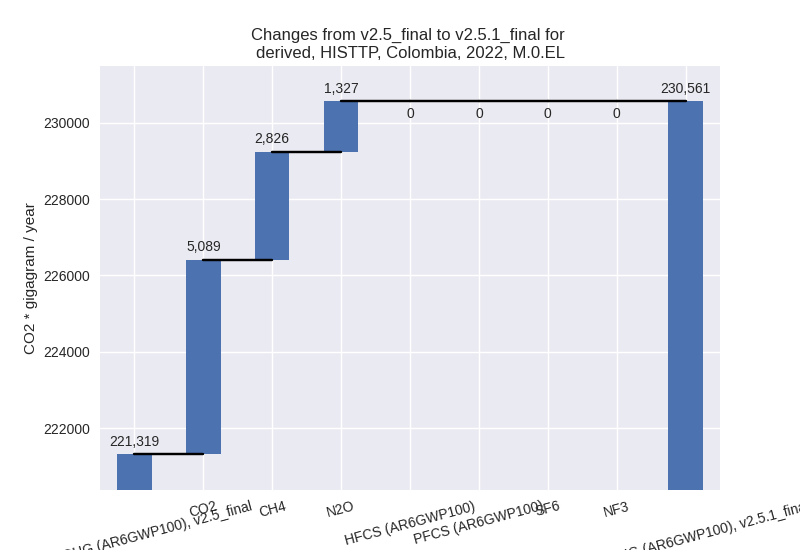
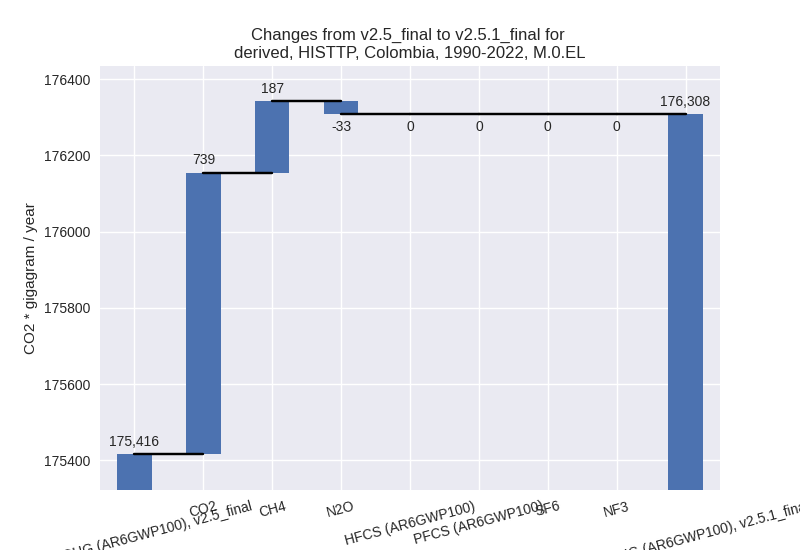
The following figures show the aggregate national total emissions excluding LULUCF AR6GWP100 for the third party priority scenario. The dotted linesshow the v2.5_final data.

Overview over changes
In the country reported priority scenario we have the following changes for aggregate Kyoto GHG and national total emissions excluding LULUCF (M.0.EL):
- Emissions in 2022 have changed by 6.8%% (13051.31 Gg CO2 / year)
- Emissions in 1990-2022 have changed by 0.8%% (1128.29 Gg CO2 / year)
In the third party priority scenario we have the following changes for aggregate Kyoto GHG and national total emissions excluding LULUCF (M.0.EL):
- Emissions in 2022 have changed by 4.2%% (9241.73 Gg CO2 / year)
- Emissions in 1990-2022 have changed by 0.5%% (892.44 Gg CO2 / year)
Most important changes per scenario and time frame
In the country reported priority scenario the following sector-gas combinations have the highest absolute impact on national total KyotoGHG (AR6GWP100) emissions in 2022 (top 5):
- 1: 1.A, CO2 with 11060.10 Gg CO2 / year (13.0%)
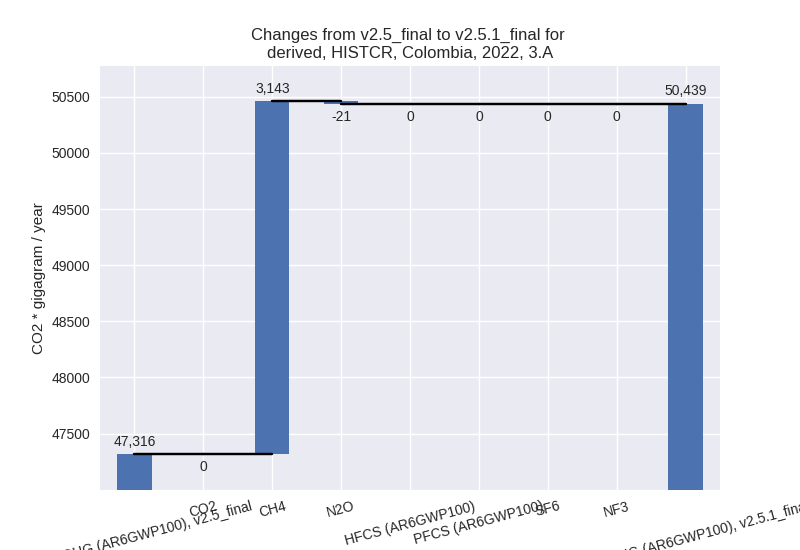
- 2: 3.A, CH4 with 3142.76 Gg CO2 / year (6.8%)
- 3: 1.B.1, CH4 with -1574.70 Gg CO2 / year (-42.9%)
- 4: 4, CH4 with -418.49 Gg CO2 / year (-2.0%)
- 5: 1.A, CH4 with 359.50 Gg CO2 / year (17.1%)
In the country reported priority scenario the following sector-gas combinations have the highest absolute impact on national total KyotoGHG (AR6GWP100) emissions in 1990-2022 (top 5):
- 1: 1.A, CO2 with 1101.04 Gg CO2 / year (1.8%)
- 2: 1.B.1, CH4 with -130.19 Gg CO2 / year (-5.3%)
- 3: 3.A, CH4 with 87.24 Gg CO2 / year (0.2%)
- 4: 1.A, CH4 with 34.33 Gg CO2 / year (1.5%)
- 5: 1.B.2, CH4 with 25.84 Gg CO2 / year (1.1%)
In the third party priority scenario the following sector-gas combinations have the highest absolute impact on national total KyotoGHG (AR6GWP100) emissions in 2022 (top 5):
- 1: 3.A, CH4 with 5864.71 Gg CO2 / year (13.0%)
- 2: 1.A, CO2 with 4656.99 Gg CO2 / year (5.1%)
- 3: 1.B.1, CH4 with -1438.74 Gg CO2 / year (-27.9%)
- 4: 1.B.2, CH4 with -1204.24 Gg CO2 / year (-12.3%)
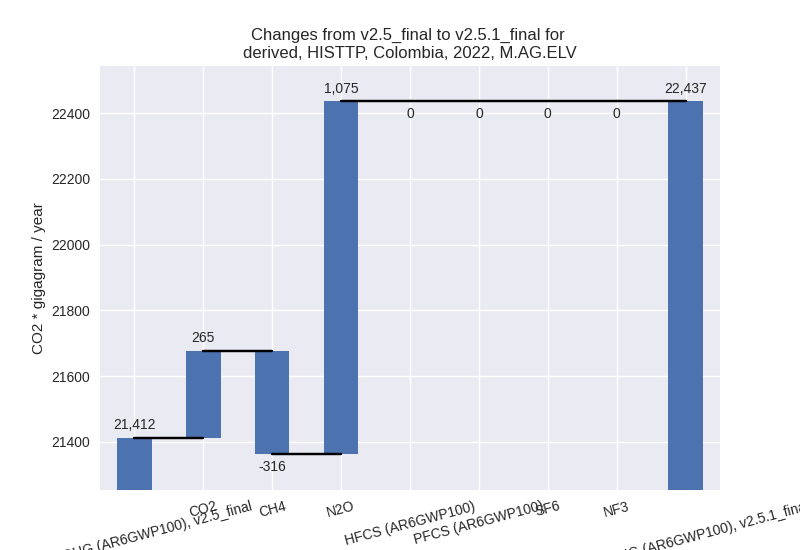
- 5: M.AG.ELV, N2O with 1074.71 Gg CO2 / year (6.3%)
In the third party priority scenario the following sector-gas combinations have the highest absolute impact on national total KyotoGHG (AR6GWP100) emissions in 1990-2022 (top 5):
- 1: 1.A, CO2 with 604.01 Gg CO2 / year (0.9%)
- 2: 1.B.1, CH4 with 398.91 Gg CO2 / year (9.5%)
- 3: 1.B.2, CH4 with -396.46 Gg CO2 / year (-5.0%)
- 4: 3.A, CH4 with 185.76 Gg CO2 / year (0.4%)
- 5: 1.B.1, CO2 with 152.18 Gg CO2 / year (25.5%)
Notes on data changes
Here we list notes explaining important emissions changes for the country. ’' means that the following text only applies to the TP time series, while means that it only applies to the CR scenario. Otherwise the note applies to both scenarios.
- 1.A, CO2: CDIAC 2023 growth rates for the last years differ from EI 2023 growth rates and lead to higher emissions in the last years.
- 3.A, CH4: EDGAR growth rates replace numerical extrapolation and lead to higher emissions as the numerical extrapolation also accounts for lower emissions pre-2015.
- 1.B.1, CH4: EDGAR 8.0 emissions are higher before 2020 and lower starting 2020. This leads to higher cumulative emissions and lower 2022 emissions in PRIMAP-hist.
- 1.B.1, CH4: EDGAR 8.0 emissions are higher before 2020 and lower starting 2020. This leads to higher cumulative emissions (TP scenario only) and lower 2022 emissions in PRIMAP-hist.
- 1.B.2, CH4: EDGAR 8.0 emissions differ from EDGAR 7.0 (mostly lower).
Changes by sector and gas
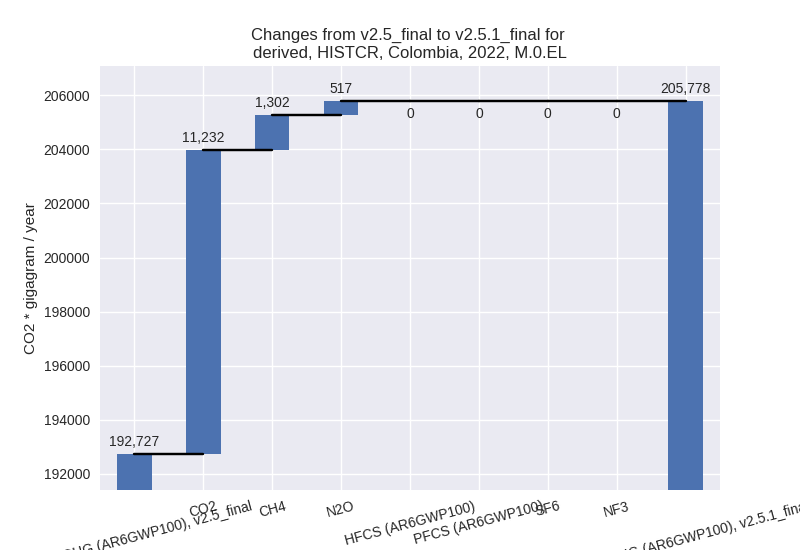
For each scenario and time frame the changes are displayed for all individual sectors and all individual gases. In the sector plot we use aggregate Kyoto GHGs in AR6GWP100. In the gas plot we usenational total emissions without LULUCF. ## country reported scenario
2022

1990-2022


third party scenario
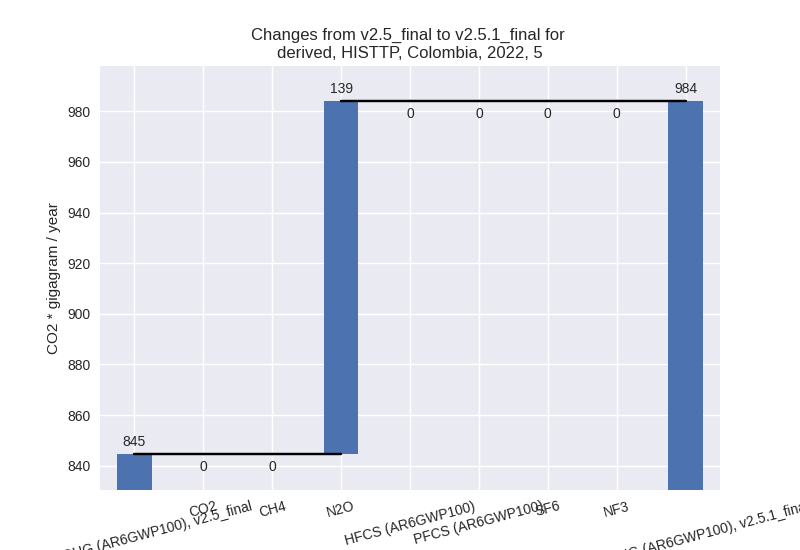
2022

1990-2022

Detailed changes for the scenarios:
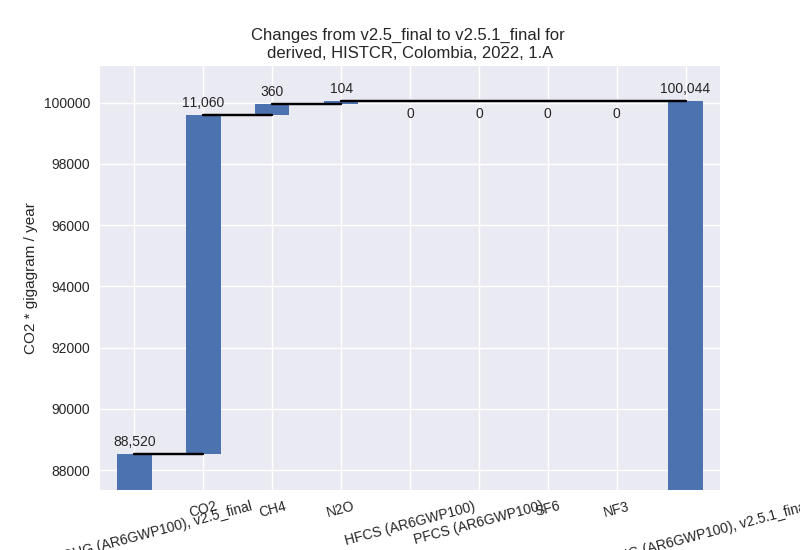
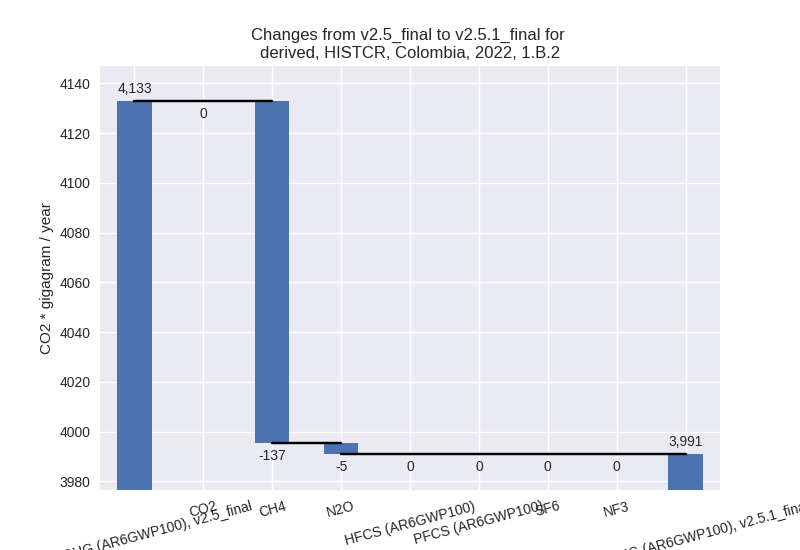
country reported scenario (HISTCR):
Most important changes per time frame
For 2022 the following sector-gas combinations have the highest absolute impact on national total KyotoGHG (AR6GWP100) emissions in 2022 (top 5):
- 1: 1.A, CO2 with 11060.10 Gg CO2 / year (13.0%)
- 2: 3.A, CH4 with 3142.76 Gg CO2 / year (6.8%)
- 3: 1.B.1, CH4 with -1574.70 Gg CO2 / year (-42.9%)
- 4: 4, CH4 with -418.49 Gg CO2 / year (-2.0%)
- 5: 1.A, CH4 with 359.50 Gg CO2 / year (17.1%)
For 1990-2022 the following sector-gas combinations have the highest absolute impact on national total KyotoGHG (AR6GWP100) emissions in 1990-2022 (top 5):
- 1: 1.A, CO2 with 1101.04 Gg CO2 / year (1.8%)
- 2: 1.B.1, CH4 with -130.19 Gg CO2 / year (-5.3%)
- 3: 3.A, CH4 with 87.24 Gg CO2 / year (0.2%)
- 4: 1.A, CH4 with 34.33 Gg CO2 / year (1.5%)
- 5: 1.B.2, CH4 with 25.84 Gg CO2 / year (1.1%)
Changes in the main sectors for aggregate KyotoGHG (AR6GWP100) are
- 1: Total sectoral emissions in 2022 are 106291.66
Gg CO2 / year which is 51.7% of M.0.EL emissions. 2022 Emissions have
changed by 10.1% (9772.73 Gg CO2 /
year). 1990-2022 Emissions have changed by 1.4% (1033.28 Gg CO2 / year). For 2022 the
changes per gas
are:

The changes come from the following subsectors:- 1.A: Total sectoral emissions in 2022 are 100043.51
Gg CO2 / year which is 94.1% of category 1 emissions. 2022 Emissions
have changed by 13.0% (11523.38 Gg
CO2 / year). 1990-2022 Emissions have changed by 1.7% (1143.49 Gg CO2 / year). For 2022 the
changes per gas
are:
There is no subsector information available in PRIMAP-hist. - 1.B.1: Total sectoral emissions in 2022 are 2257.24
Gg CO2 / year which is 2.1% of category 1 emissions. 2022 Emissions have
changed by -41.6% (-1608.80 Gg CO2 /
year). 1990-2022 Emissions have changed by -5.3% (-135.90 Gg CO2 / year). For 2022
the changes per gas
are:

For 1990-2022 the changes per gas are:
There is no subsector information available in PRIMAP-hist. - 1.B.2: Total sectoral emissions in 2022 are 3990.91
Gg CO2 / year which is 3.8% of category 1 emissions. 2022 Emissions have
changed by -3.4% (-141.85 Gg CO2 /
year). 1990-2022 Emissions have changed by 0.6% (25.69 Gg CO2 / year). For 2022 the
changes per gas
are:
There is no subsector information available in PRIMAP-hist.
- 1.A: Total sectoral emissions in 2022 are 100043.51
Gg CO2 / year which is 94.1% of category 1 emissions. 2022 Emissions
have changed by 13.0% (11523.38 Gg
CO2 / year). 1990-2022 Emissions have changed by 1.7% (1143.49 Gg CO2 / year). For 2022 the
changes per gas
are:
- 2: Total sectoral emissions in 2022 are 14054.39 Gg
CO2 / year which is 6.8% of M.0.EL emissions. 2022 Emissions have
changed by 3.1% (426.58 Gg CO2 /
year). 1990-2022 Emissions have changed by 0.4% (33.64 Gg CO2 / year). For 2022 the
changes per gas
are:

- M.AG: Total sectoral emissions in 2022 are 62570.98
Gg CO2 / year which is 30.4% of M.0.EL emissions. 2022 Emissions have
changed by 5.3% (3126.19 Gg CO2 /
year). 1990-2022 Emissions have changed by 0.1% (69.68 Gg CO2 / year). For 2022 the
changes per gas
are:

The changes come from the following subsectors:- 3.A: Total sectoral emissions in 2022 are 50438.57
Gg CO2 / year which is 80.6% of category M.AG emissions. 2022 Emissions
have changed by 6.6% (3122.17 Gg CO2
/ year). 1990-2022 Emissions have changed by 0.2% (85.06 Gg CO2 / year). For 2022 the
changes per gas
are:
There is no subsector information available in PRIMAP-hist. - M.AG.ELV: Total sectoral emissions in 2022 are 12132.41 Gg CO2 / year which is 19.4% of category M.AG emissions. 2022 Emissions have changed by 0.0% (4.01 Gg CO2 / year). 1990-2022 Emissions have changed by -0.2% (-15.38 Gg CO2 / year).
- 3.A: Total sectoral emissions in 2022 are 50438.57
Gg CO2 / year which is 80.6% of category M.AG emissions. 2022 Emissions
have changed by 6.6% (3122.17 Gg CO2
/ year). 1990-2022 Emissions have changed by 0.2% (85.06 Gg CO2 / year). For 2022 the
changes per gas
are:
- 4: Total sectoral emissions in 2022 are 21877.26 Gg CO2 / year which is 10.6% of M.0.EL emissions. 2022 Emissions have changed by -1.9% (-413.61 Gg CO2 / year). 1990-2022 Emissions have changed by -0.1% (-12.53 Gg CO2 / year).
- 5: Total sectoral emissions in 2022 are 983.97 Gg
CO2 / year which is 0.5% of M.0.EL emissions. 2022 Emissions have
changed by 16.5% (139.42 Gg CO2 /
year). 1990-2022 Emissions have changed by 0.7% (4.22 Gg CO2 / year). For 2022 the
changes per gas
are:

third party scenario (HISTTP):
Most important changes per time frame
For 2022 the following sector-gas combinations have the highest absolute impact on national total KyotoGHG (AR6GWP100) emissions in 2022 (top 5):
- 1: 3.A, CH4 with 5864.71 Gg CO2 / year (13.0%)
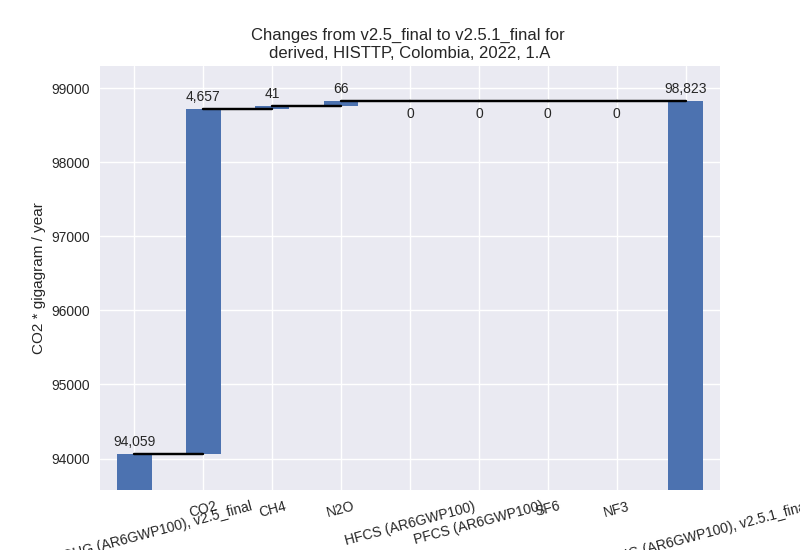
- 2: 1.A, CO2 with 4656.99 Gg CO2 / year (5.1%)
- 3: 1.B.1, CH4 with -1438.74 Gg CO2 / year (-27.9%)
- 4: 1.B.2, CH4 with -1204.24 Gg CO2 / year (-12.3%)
- 5: M.AG.ELV, N2O with 1074.71 Gg CO2 / year (6.3%)
For 1990-2022 the following sector-gas combinations have the highest absolute impact on national total KyotoGHG (AR6GWP100) emissions in 1990-2022 (top 5):
- 1: 1.A, CO2 with 604.01 Gg CO2 / year (0.9%)
- 2: 1.B.1, CH4 with 398.91 Gg CO2 / year (9.5%)
- 3: 1.B.2, CH4 with -396.46 Gg CO2 / year (-5.0%)
- 4: 3.A, CH4 with 185.76 Gg CO2 / year (0.4%)
- 5: 1.B.1, CO2 with 152.18 Gg CO2 / year (25.5%)
Changes in the main sectors for aggregate KyotoGHG (AR6GWP100) are
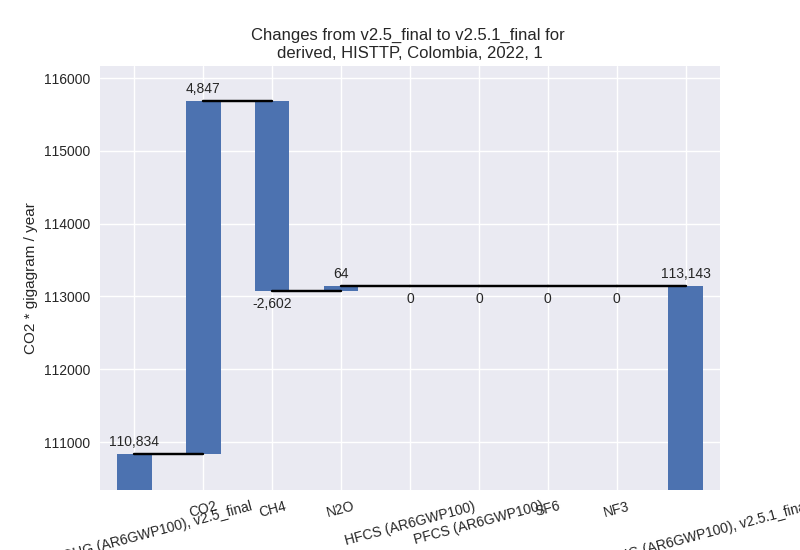
- 1: Total sectoral emissions in 2022 are 113142.83
Gg CO2 / year which is 49.1% of M.0.EL emissions. 2022 Emissions have
changed by 2.1% (2308.77 Gg CO2 /
year). 1990-2022 Emissions have changed by 1.0% (790.90 Gg CO2 / year). For 2022 the
changes per gas
are:
The changes come from the following subsectors:- 1.A: Total sectoral emissions in 2022 are 98822.57
Gg CO2 / year which is 87.3% of category 1 emissions. 2022 Emissions
have changed by 5.1% (4763.91 Gg CO2
/ year). 1990-2022 Emissions have changed by 0.9% (636.34 Gg CO2 / year). For 2022 the
changes per gas
are:
There is no subsector information available in PRIMAP-hist. - 1.B.1: Total sectoral emissions in 2022 are 5195.82
Gg CO2 / year which is 4.6% of category 1 emissions. 2022 Emissions have
changed by -19.4% (-1248.97 Gg CO2 /
year). 1990-2022 Emissions have changed by 11.5% (551.06 Gg CO2 / year). For 2022 the
changes per gas
are:
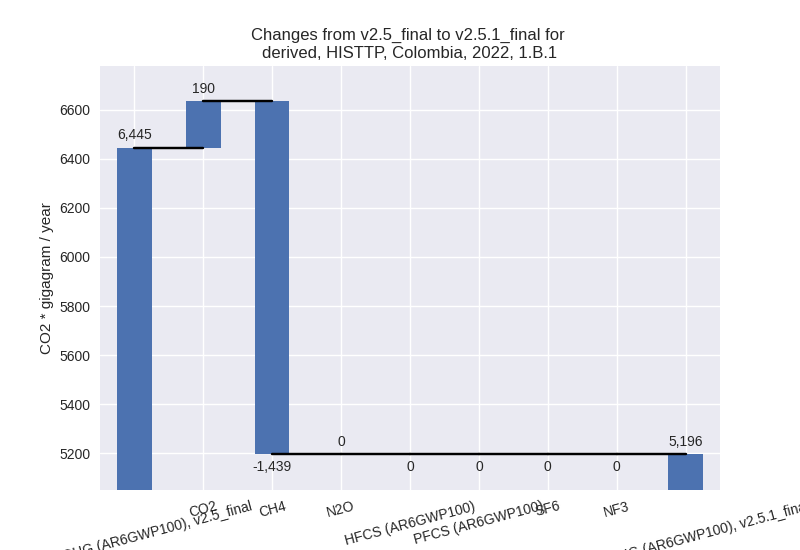
For 1990-2022 the changes per gas are: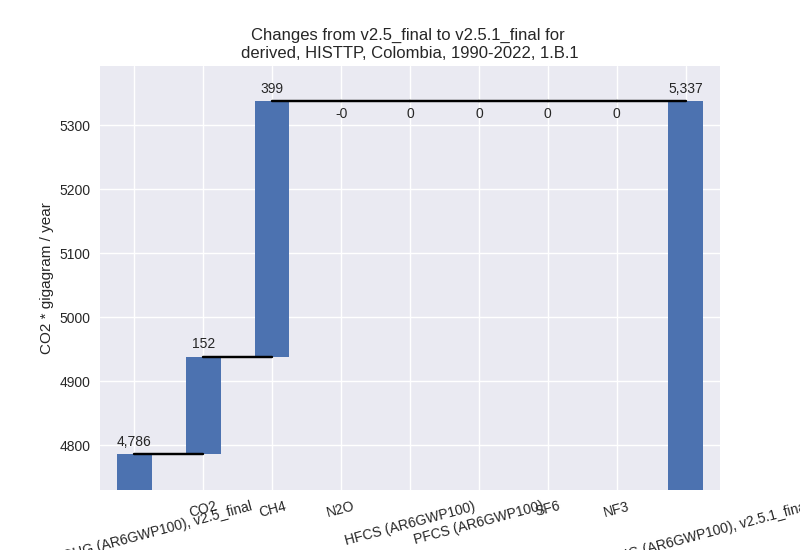
There is no subsector information available in PRIMAP-hist. - 1.B.2: Total sectoral emissions in 2022 are 9124.44
Gg CO2 / year which is 8.1% of category 1 emissions. 2022 Emissions have
changed by -11.7% (-1206.17 Gg CO2 /
year). 1990-2022 Emissions have changed by -4.5% (-396.50 Gg CO2 / year). For 2022
the changes per gas
are:

For 1990-2022 the changes per gas are: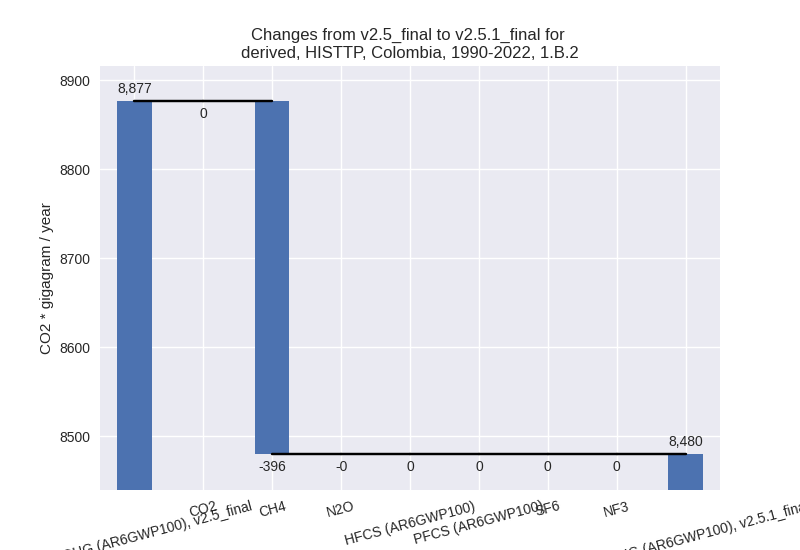
There is no subsector information available in PRIMAP-hist.
- 1.A: Total sectoral emissions in 2022 are 98822.57
Gg CO2 / year which is 87.3% of category 1 emissions. 2022 Emissions
have changed by 5.1% (4763.91 Gg CO2
/ year). 1990-2022 Emissions have changed by 0.9% (636.34 Gg CO2 / year). For 2022 the
changes per gas
are:
- 2: Total sectoral emissions in 2022 are 16501.10 Gg CO2 / year which is 7.2% of M.0.EL emissions. 2022 Emissions have changed by 0.3% (46.98 Gg CO2 / year). 1990-2022 Emissions have changed by -1.5% (-126.08 Gg CO2 / year).
- M.AG: Total sectoral emissions in 2022 are 73992.31
Gg CO2 / year which is 32.1% of M.0.EL emissions. 2022 Emissions have
changed by 10.2% (6873.41 Gg CO2 /
year). 1990-2022 Emissions have changed by 0.4% (227.24 Gg CO2 / year). For 2022 the
changes per gas
are:

The changes come from the following subsectors:- 3.A: Total sectoral emissions in 2022 are 51555.72
Gg CO2 / year which is 69.7% of category M.AG emissions. 2022 Emissions
have changed by 12.8% (5849.18 Gg
CO2 / year). 1990-2022 Emissions have changed by 0.4% (184.00 Gg CO2 / year). For 2022 the
changes per gas
are:

There is no subsector information available in PRIMAP-hist. - M.AG.ELV: Total sectoral emissions in 2022 are
22436.59 Gg CO2 / year which is 30.3% of category M.AG emissions. 2022
Emissions have changed by 4.8%
(1024.22 Gg CO2 / year). 1990-2022 Emissions have changed by 0.2% (43.24 Gg CO2 / year). For 2022 the
changes per gas
are:
There is no subsector information available in PRIMAP-hist.
- 3.A: Total sectoral emissions in 2022 are 51555.72
Gg CO2 / year which is 69.7% of category M.AG emissions. 2022 Emissions
have changed by 12.8% (5849.18 Gg
CO2 / year). 1990-2022 Emissions have changed by 0.4% (184.00 Gg CO2 / year). For 2022 the
changes per gas
are:
- 4: Total sectoral emissions in 2022 are 25940.71 Gg CO2 / year which is 11.3% of M.0.EL emissions. 2022 Emissions have changed by -0.5% (-126.85 Gg CO2 / year). 1990-2022 Emissions have changed by -0.0% (-3.84 Gg CO2 / year).
- 5: Total sectoral emissions in 2022 are 983.97 Gg
CO2 / year which is 0.4% of M.0.EL emissions. 2022 Emissions have
changed by 16.5% (139.42 Gg CO2 /
year). 1990-2022 Emissions have changed by 0.7% (4.22 Gg CO2 / year). For 2022 the
changes per gas
are: