Changes in PRIMAP-hist v2.5.1_final compared to v2.5_final for Comoros
2024-02-29
Johannes Gütschow
Change analysis for Comoros for PRIMAP-hist v2.5.1_final compared to v2.5_final
Overview over emissions by sector and gas
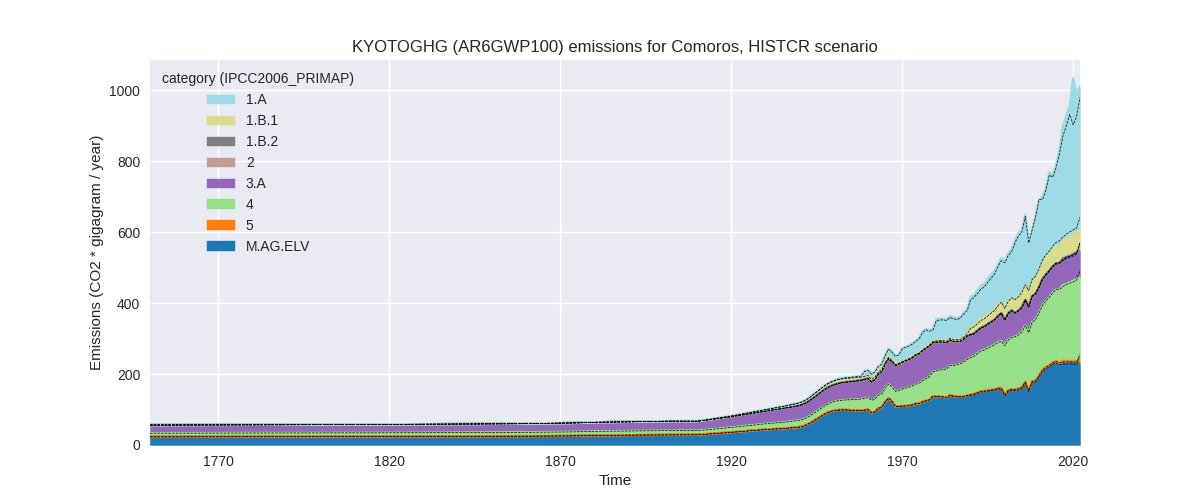
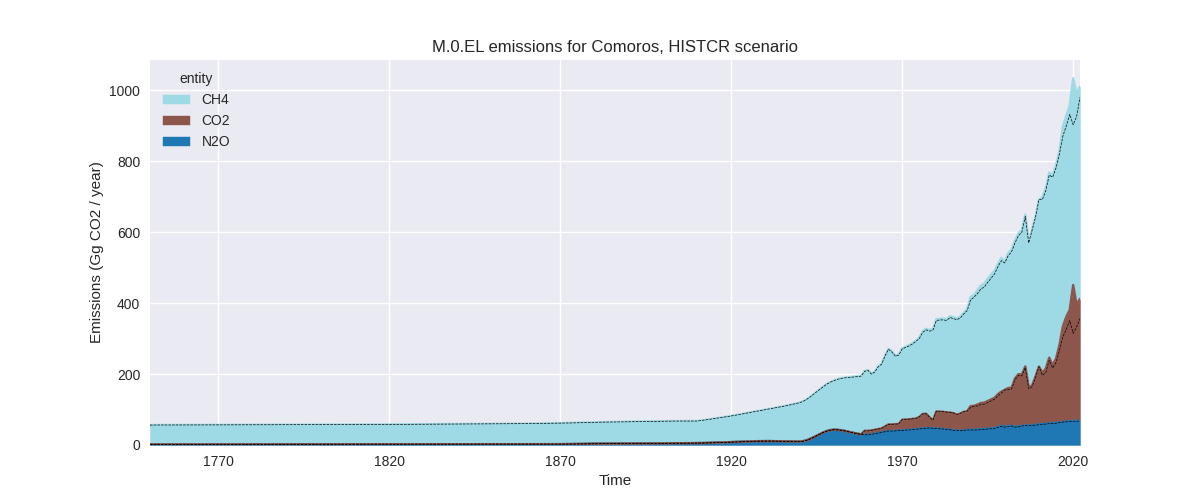
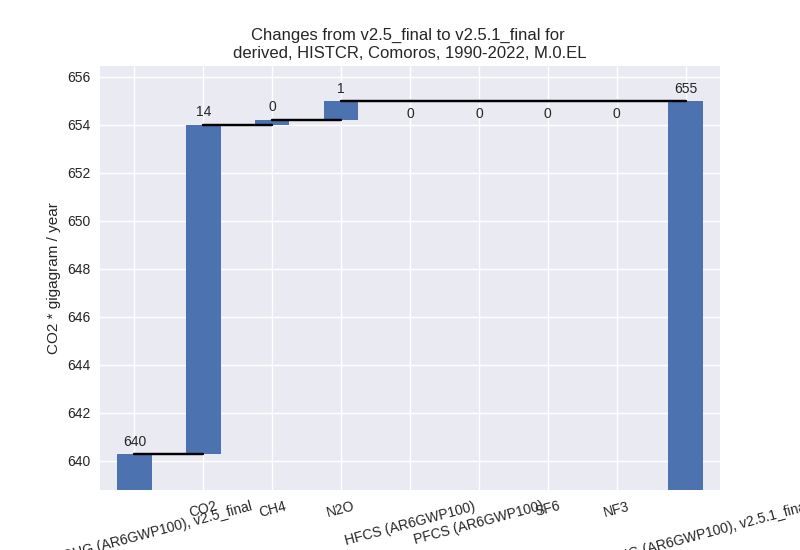
The following figures show the aggregate national total emissions excluding LULUCF AR6GWP100 for the country reported priority scenario. The dotted linesshow the v2.5_final data.
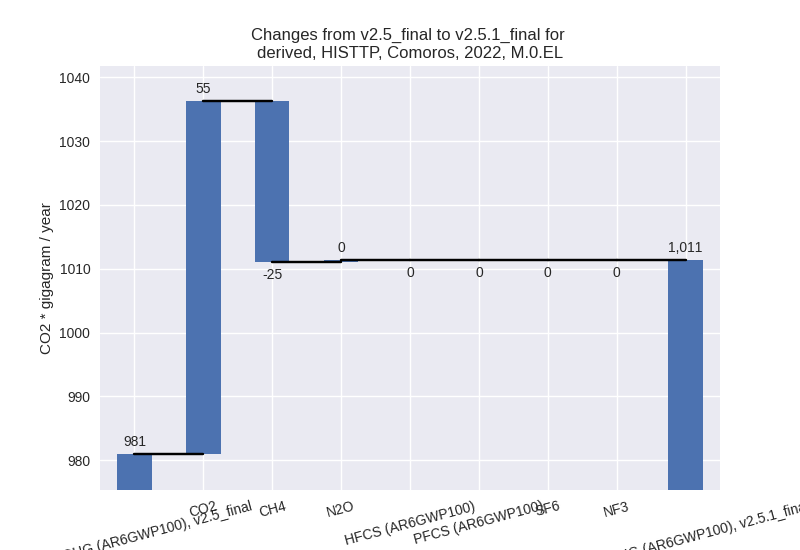
The following figures show the aggregate national total emissions excluding LULUCF AR6GWP100 for the third party priority scenario. The dotted linesshow the v2.5_final data.


Overview over changes
In the country reported priority scenario we have the following changes for aggregate Kyoto GHG and national total emissions excluding LULUCF (M.0.EL):
- Emissions in 2022 have changed by 3.1%% (30.37 Gg CO2 / year)
- Emissions in 1990-2022 have changed by 2.3%% (14.71 Gg CO2 / year)
In the third party priority scenario we have the following changes for aggregate Kyoto GHG and national total emissions excluding LULUCF (M.0.EL):
- Emissions in 2022 have changed by 3.1%% (30.37 Gg CO2 / year)
- Emissions in 1990-2022 have changed by 2.3%% (14.71 Gg CO2 / year)
Most important changes per scenario and time frame
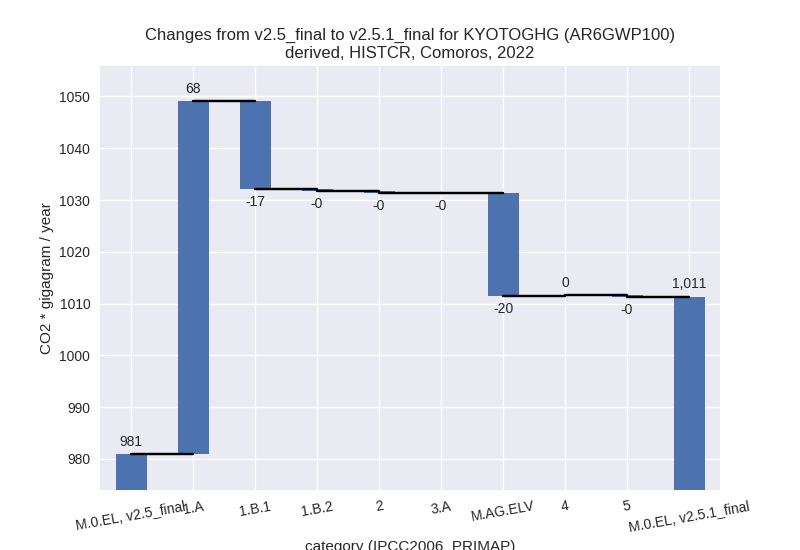
In the country reported priority scenario the following sector-gas combinations have the highest absolute impact on national total KyotoGHG (AR6GWP100) emissions in 2022 (top 5):
- 1: 1.A, CO2 with 55.69 Gg CO2 / year (19.5%)
- 2: M.AG.ELV, CH4 with -19.11 Gg CO2 / year (-9.3%)
- 3: 1.B.1, CH4 with -16.72 Gg CO2 / year (-23.3%)
- 4: 1.A, CH4 with 11.03 Gg CO2 / year (24.6%)
- 5: 1.A, N2O with 1.41 Gg CO2 / year (16.8%)
In the country reported priority scenario the following sector-gas combinations have the highest absolute impact on national total KyotoGHG (AR6GWP100) emissions in 1990-2022 (top 5):
- 1: 1.A, CO2 with 14.31 Gg CO2 / year (10.1%)
- 2: 1.A, CH4 with 5.76 Gg CO2 / year (20.6%)
- 3: 1.B.1, CH4 with -5.25 Gg CO2 / year (-12.2%)
- 4: 1.A, N2O with 0.61 Gg CO2 / year (13.2%)
- 5: 2, CO2 with -0.50 Gg CO2 / year (-22.4%)
In the third party priority scenario the following sector-gas combinations have the highest absolute impact on national total KyotoGHG (AR6GWP100) emissions in 2022 (top 5):
- 1: 1.A, CO2 with 55.69 Gg CO2 / year (19.5%)
- 2: M.AG.ELV, CH4 with -19.11 Gg CO2 / year (-9.3%)
- 3: 1.B.1, CH4 with -16.72 Gg CO2 / year (-23.3%)
- 4: 1.A, CH4 with 11.03 Gg CO2 / year (24.6%)
- 5: 1.A, N2O with 1.41 Gg CO2 / year (16.8%)
In the third party priority scenario the following sector-gas combinations have the highest absolute impact on national total KyotoGHG (AR6GWP100) emissions in 1990-2022 (top 5):
- 1: 1.A, CO2 with 14.31 Gg CO2 / year (10.1%)
- 2: 1.A, CH4 with 5.76 Gg CO2 / year (20.6%)
- 3: 1.B.1, CH4 with -5.25 Gg CO2 / year (-12.2%)
- 4: 1.A, N2O with 0.61 Gg CO2 / year (13.2%)
- 5: 2, CO2 with -0.50 Gg CO2 / year (-22.4%)
Notes on data changes
Here we list notes explaining important emissions changes for the country. ’' means that the following text only applies to the TP time series, while means that it only applies to the CR scenario. Otherwise the note applies to both scenarios.
General note: We have no country reported data for Comoros, thus the CR and TP time-series are identical except for LULUCF.
- 1.A, CO2: emission in CDIAC 2023 data are higher than in earlier versions. As Comoros is not included in the EI dataset EDGAR 7.0 data was used to extend CDIAC 2020 in PRIMAP-hist v2.5. EDGAR 7.0 shows a decline in emissions in 2020 which CDIAC 2023 does not show. Thus the increase in 2022 emissions is high. Data for 2021 and 2022 are estimated using numerical extrapolation.
- 1.A, CH4: Emissions are consistently higher as EDGAR 8.0 emissions are consistently higher than EDGAR 7.0
- M.AG.ELV, CH4: 2022 emissions are lower because new FAO and EDGAR data show a continuation of the recent emissions plateau while the numerical extrapolation still factored in the steep emissions rise between 2007 and 2015.
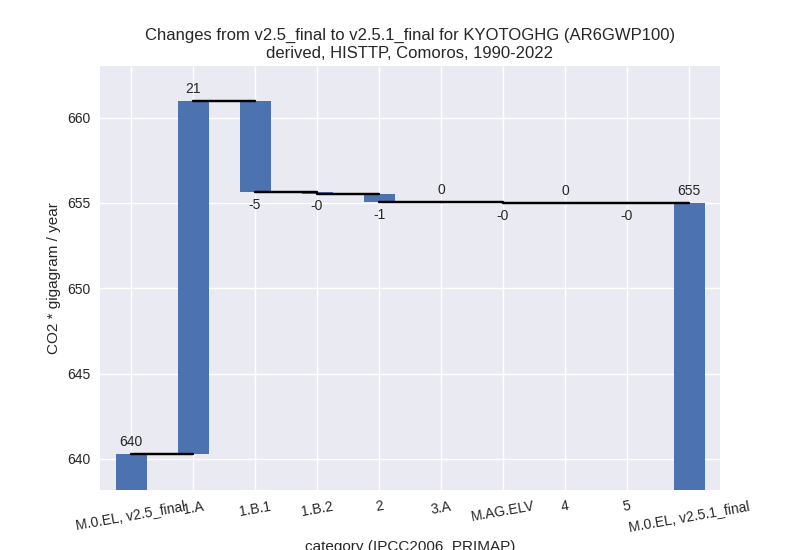
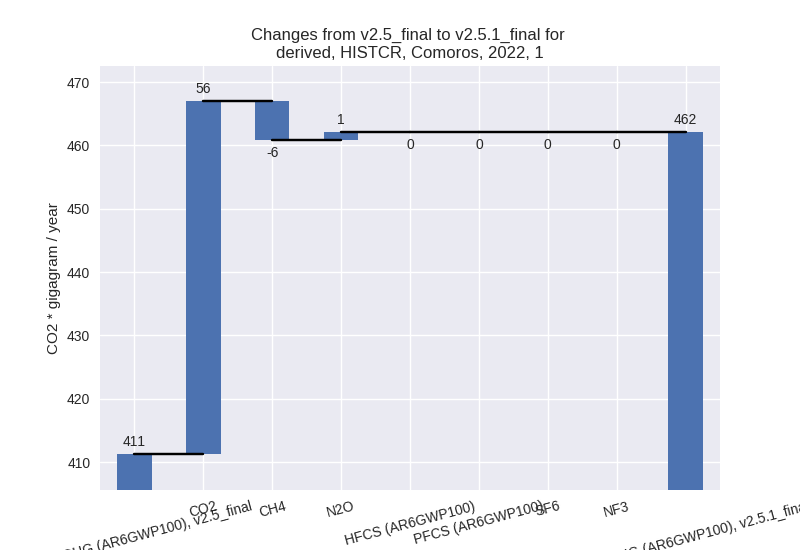
Changes by sector and gas
For each scenario and time frame the changes are displayed for all individual sectors and all individual gases. In the sector plot we use aggregate Kyoto GHGs in AR6GWP100. In the gas plot we usenational total emissions without LULUCF. ## country reported scenario
2022

1990-2022

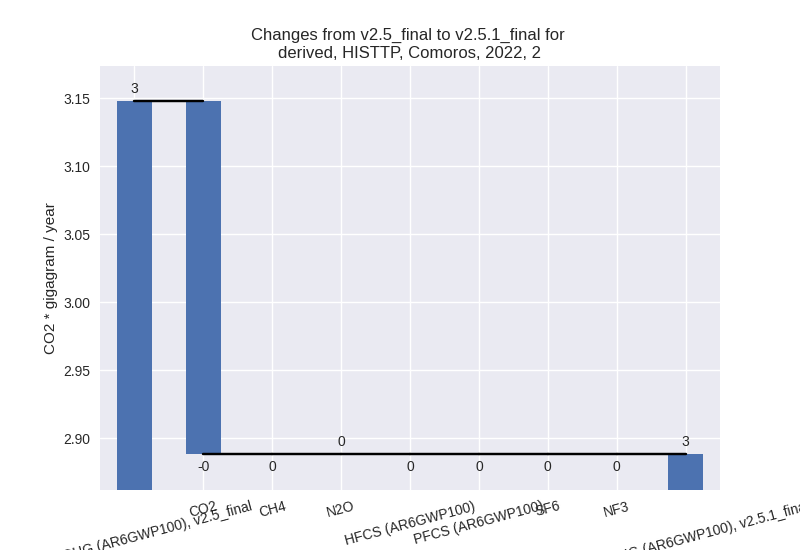
third party scenario
2022

1990-2022

Detailed changes for the scenarios:
country reported scenario (HISTCR):
Most important changes per time frame
For 2022 the following sector-gas combinations have the highest absolute impact on national total KyotoGHG (AR6GWP100) emissions in 2022 (top 5):
- 1: 1.A, CO2 with 55.69 Gg CO2 / year (19.5%)
- 2: M.AG.ELV, CH4 with -19.11 Gg CO2 / year (-9.3%)
- 3: 1.B.1, CH4 with -16.72 Gg CO2 / year (-23.3%)
- 4: 1.A, CH4 with 11.03 Gg CO2 / year (24.6%)
- 5: 1.A, N2O with 1.41 Gg CO2 / year (16.8%)
For 1990-2022 the following sector-gas combinations have the highest absolute impact on national total KyotoGHG (AR6GWP100) emissions in 1990-2022 (top 5):
- 1: 1.A, CO2 with 14.31 Gg CO2 / year (10.1%)
- 2: 1.A, CH4 with 5.76 Gg CO2 / year (20.6%)
- 3: 1.B.1, CH4 with -5.25 Gg CO2 / year (-12.2%)
- 4: 1.A, N2O with 0.61 Gg CO2 / year (13.2%)
- 5: 2, CO2 with -0.50 Gg CO2 / year (-22.4%)
Changes in the main sectors for aggregate KyotoGHG (AR6GWP100) are
- 1: Total sectoral emissions in 2022 are 462.04 Gg
CO2 / year which is 45.7% of M.0.EL emissions. 2022 Emissions have
changed by 12.3% (50.78 Gg CO2 /
year). 1990-2022 Emissions have changed by 7.0% (15.28 Gg CO2 / year). For 2022 the
changes per gas
are:
For 1990-2022 the changes per gas are:
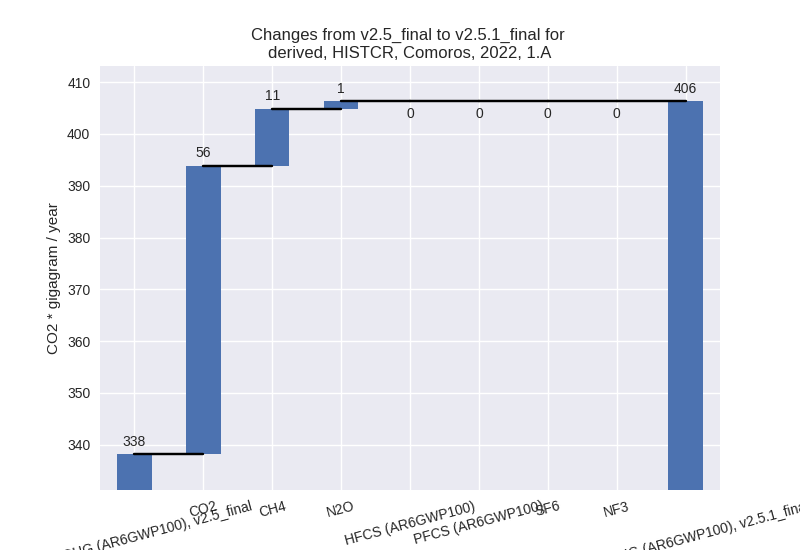
The changes come from the following subsectors:- 1.A: Total sectoral emissions in 2022 are 406.31 Gg
CO2 / year which is 87.9% of category 1 emissions. 2022 Emissions have
changed by 20.2% (68.14 Gg CO2 /
year). 1990-2022 Emissions have changed by 11.9% (20.69 Gg CO2 / year). For 2022 the
changes per gas
are:
For 1990-2022 the changes per gas are: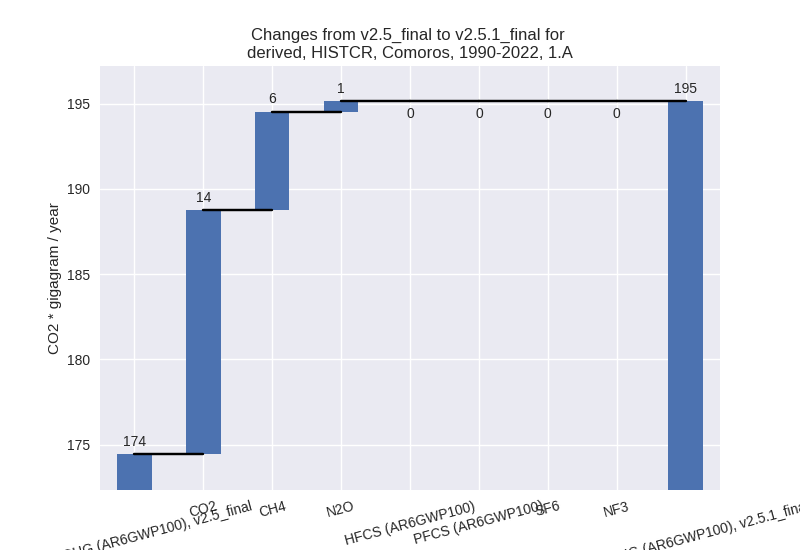
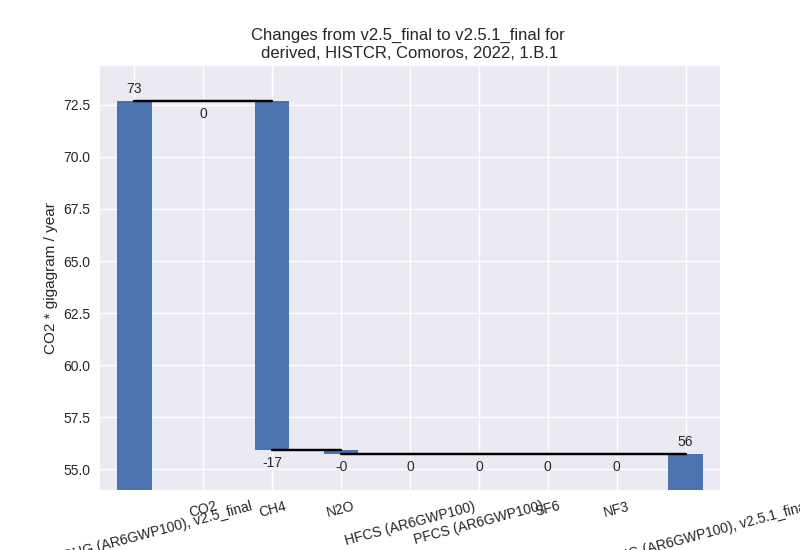
There is no subsector information available in PRIMAP-hist. - 1.B.1: Total sectoral emissions in 2022 are 55.73
Gg CO2 / year which is 12.1% of category 1 emissions. 2022 Emissions
have changed by -23.3% (-16.94 Gg
CO2 / year). 1990-2022 Emissions have changed by -12.2% (-5.32 Gg CO2 / year). For 2022 the
changes per gas
are:
For 1990-2022 the changes per gas are:
There is no subsector information available in PRIMAP-hist. - 1.B.2: Total sectoral emissions in 2022 are 0.00 Gg
CO2 / year which is 0.0% of category 1 emissions. 2022 Emissions have
changed by -99.6% (-0.42 Gg CO2 /
year). 1990-2022 Emissions have changed by -98.6% (-0.09 Gg CO2 / year). For 2022 the
changes per gas
are:

For 1990-2022 the changes per gas are: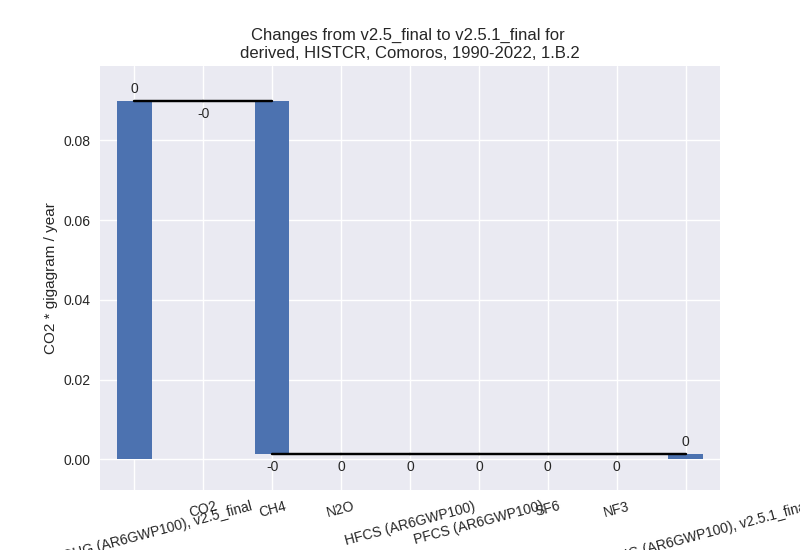
There is no subsector information available in PRIMAP-hist.
- 1.A: Total sectoral emissions in 2022 are 406.31 Gg
CO2 / year which is 87.9% of category 1 emissions. 2022 Emissions have
changed by 20.2% (68.14 Gg CO2 /
year). 1990-2022 Emissions have changed by 11.9% (20.69 Gg CO2 / year). For 2022 the
changes per gas
are:
- 2: Total sectoral emissions in 2022 are 2.89 Gg CO2
/ year which is 0.3% of M.0.EL emissions. 2022 Emissions have changed by
-8.2% (-0.26 Gg CO2 / year).
1990-2022 Emissions have changed by -22.4% (-0.50 Gg CO2 / year). For 2022 the
changes per gas
are:

For 1990-2022 the changes per gas are:
- M.AG: Total sectoral emissions in 2022 are 303.23
Gg CO2 / year which is 30.0% of M.0.EL emissions. 2022 Emissions have
changed by -6.2% (-19.89 Gg CO2 /
year). 1990-2022 Emissions have changed by -0.0% (-0.06 Gg CO2 / year). For 2022 the
changes per gas
are:

The changes come from the following subsectors:- 3.A: Total sectoral emissions in 2022 are 73.32 Gg CO2 / year which is 24.2% of category M.AG emissions. 2022 Emissions have changed by -0.2% (-0.15 Gg CO2 / year). 1990-2022 Emissions have changed by 0.0% (0.00 Gg CO2 / year).
- M.AG.ELV: Total sectoral emissions in 2022 are
229.91 Gg CO2 / year which is 75.8% of category M.AG emissions. 2022
Emissions have changed by -7.9%
(-19.73 Gg CO2 / year). 1990-2022 Emissions have changed by -0.0% (-0.06 Gg CO2 / year). For 2022 the
changes per gas
are:

There is no subsector information available in PRIMAP-hist.
- 4: Total sectoral emissions in 2022 are 236.65 Gg CO2 / year which is 23.4% of M.0.EL emissions. 2022 Emissions have changed by 0.0% (0.06 Gg CO2 / year). 1990-2022 Emissions have changed by 0.0% (0.00 Gg CO2 / year).
- 5: Total sectoral emissions in 2022 are 6.49 Gg CO2
/ year which is 0.6% of M.0.EL emissions. 2022 Emissions have changed by
-4.6% (-0.32 Gg CO2 / year).
1990-2022 Emissions have changed by -0.3% (-0.01 Gg CO2 / year). For 2022 the
changes per gas
are:

third party scenario (HISTTP):
Most important changes per time frame
For 2022 the following sector-gas combinations have the highest absolute impact on national total KyotoGHG (AR6GWP100) emissions in 2022 (top 5):
- 1: 1.A, CO2 with 55.69 Gg CO2 / year (19.5%)
- 2: M.AG.ELV, CH4 with -19.11 Gg CO2 / year (-9.3%)
- 3: 1.B.1, CH4 with -16.72 Gg CO2 / year (-23.3%)
- 4: 1.A, CH4 with 11.03 Gg CO2 / year (24.6%)
- 5: 1.A, N2O with 1.41 Gg CO2 / year (16.8%)
For 1990-2022 the following sector-gas combinations have the highest absolute impact on national total KyotoGHG (AR6GWP100) emissions in 1990-2022 (top 5):
- 1: 1.A, CO2 with 14.31 Gg CO2 / year (10.1%)
- 2: 1.A, CH4 with 5.76 Gg CO2 / year (20.6%)
- 3: 1.B.1, CH4 with -5.25 Gg CO2 / year (-12.2%)
- 4: 1.A, N2O with 0.61 Gg CO2 / year (13.2%)
- 5: 2, CO2 with -0.50 Gg CO2 / year (-22.4%)
Changes in the main sectors for aggregate KyotoGHG (AR6GWP100) are
- 1: Total sectoral emissions in 2022 are 462.04 Gg
CO2 / year which is 45.7% of M.0.EL emissions. 2022 Emissions have
changed by 12.3% (50.78 Gg CO2 /
year). 1990-2022 Emissions have changed by 7.0% (15.28 Gg CO2 / year). For 2022 the
changes per gas
are:

For 1990-2022 the changes per gas are:
The changes come from the following subsectors:- 1.A: Total sectoral emissions in 2022 are 406.31 Gg
CO2 / year which is 87.9% of category 1 emissions. 2022 Emissions have
changed by 20.2% (68.14 Gg CO2 /
year). 1990-2022 Emissions have changed by 11.9% (20.69 Gg CO2 / year). For 2022 the
changes per gas
are:

For 1990-2022 the changes per gas are:
There is no subsector information available in PRIMAP-hist. - 1.B.1: Total sectoral emissions in 2022 are 55.73
Gg CO2 / year which is 12.1% of category 1 emissions. 2022 Emissions
have changed by -23.3% (-16.94 Gg
CO2 / year). 1990-2022 Emissions have changed by -12.2% (-5.32 Gg CO2 / year). For 2022 the
changes per gas
are:

For 1990-2022 the changes per gas are:
There is no subsector information available in PRIMAP-hist. - 1.B.2: Total sectoral emissions in 2022 are 0.00 Gg
CO2 / year which is 0.0% of category 1 emissions. 2022 Emissions have
changed by -99.6% (-0.42 Gg CO2 /
year). 1990-2022 Emissions have changed by -98.6% (-0.09 Gg CO2 / year). For 2022 the
changes per gas
are:

For 1990-2022 the changes per gas are:
There is no subsector information available in PRIMAP-hist.
- 1.A: Total sectoral emissions in 2022 are 406.31 Gg
CO2 / year which is 87.9% of category 1 emissions. 2022 Emissions have
changed by 20.2% (68.14 Gg CO2 /
year). 1990-2022 Emissions have changed by 11.9% (20.69 Gg CO2 / year). For 2022 the
changes per gas
are:
- 2: Total sectoral emissions in 2022 are 2.89 Gg CO2
/ year which is 0.3% of M.0.EL emissions. 2022 Emissions have changed by
-8.2% (-0.26 Gg CO2 / year).
1990-2022 Emissions have changed by -22.4% (-0.50 Gg CO2 / year). For 2022 the
changes per gas
are:
For 1990-2022 the changes per gas are: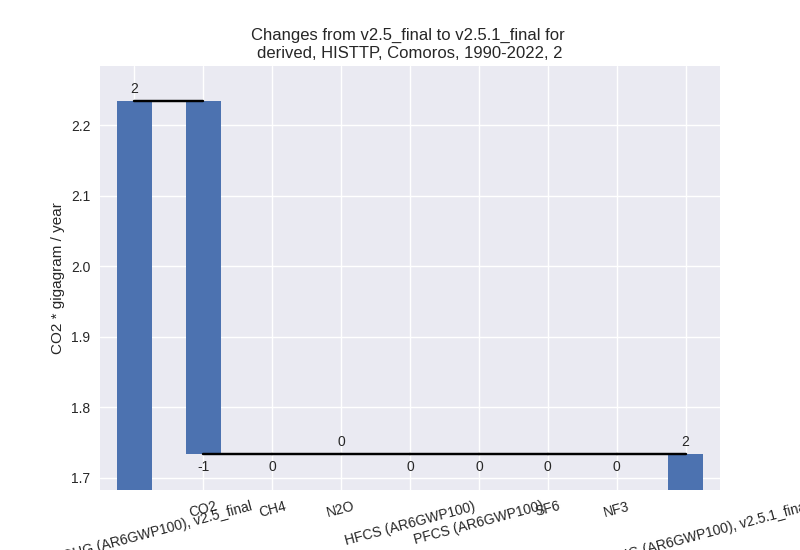
- M.AG: Total sectoral emissions in 2022 are 303.23
Gg CO2 / year which is 30.0% of M.0.EL emissions. 2022 Emissions have
changed by -6.2% (-19.89 Gg CO2 /
year). 1990-2022 Emissions have changed by -0.0% (-0.06 Gg CO2 / year). For 2022 the
changes per gas
are:

The changes come from the following subsectors:- 3.A: Total sectoral emissions in 2022 are 73.32 Gg CO2 / year which is 24.2% of category M.AG emissions. 2022 Emissions have changed by -0.2% (-0.15 Gg CO2 / year). 1990-2022 Emissions have changed by 0.0% (0.00 Gg CO2 / year).
- M.AG.ELV: Total sectoral emissions in 2022 are
229.91 Gg CO2 / year which is 75.8% of category M.AG emissions. 2022
Emissions have changed by -7.9%
(-19.73 Gg CO2 / year). 1990-2022 Emissions have changed by -0.0% (-0.06 Gg CO2 / year). For 2022 the
changes per gas
are:

There is no subsector information available in PRIMAP-hist.
- 4: Total sectoral emissions in 2022 are 236.65 Gg CO2 / year which is 23.4% of M.0.EL emissions. 2022 Emissions have changed by 0.0% (0.06 Gg CO2 / year). 1990-2022 Emissions have changed by 0.0% (0.00 Gg CO2 / year).
- 5: Total sectoral emissions in 2022 are 6.49 Gg CO2
/ year which is 0.6% of M.0.EL emissions. 2022 Emissions have changed by
-4.6% (-0.32 Gg CO2 / year).
1990-2022 Emissions have changed by -0.3% (-0.01 Gg CO2 / year). For 2022 the
changes per gas
are:
