Changes in PRIMAP-hist v2.5.1_final compared to v2.5_final for Germany
2024-02-29
Johannes Gütschow
Change analysis for Germany for PRIMAP-hist v2.5.1_final compared to v2.5_final
Overview over emissions by sector and gas
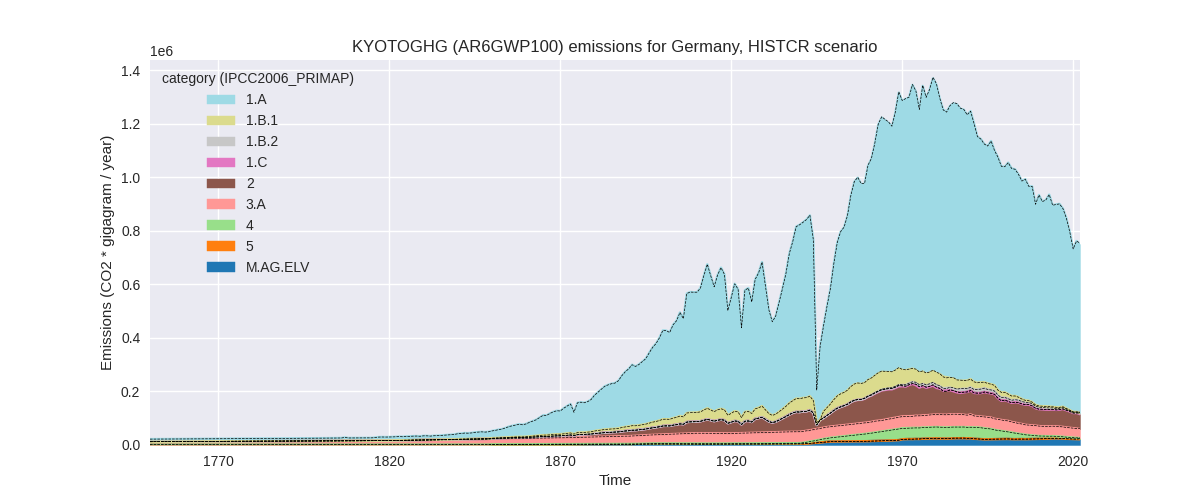
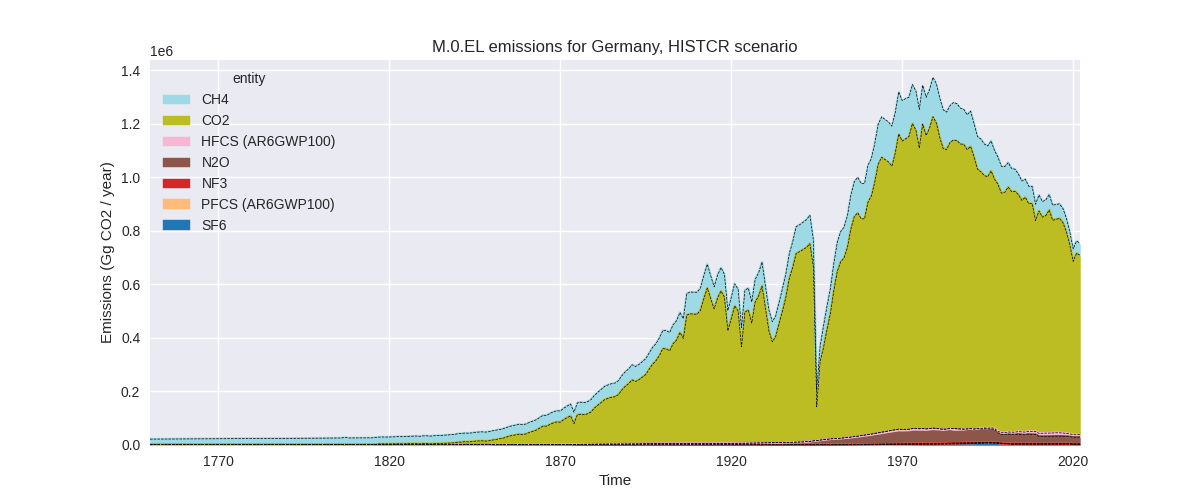
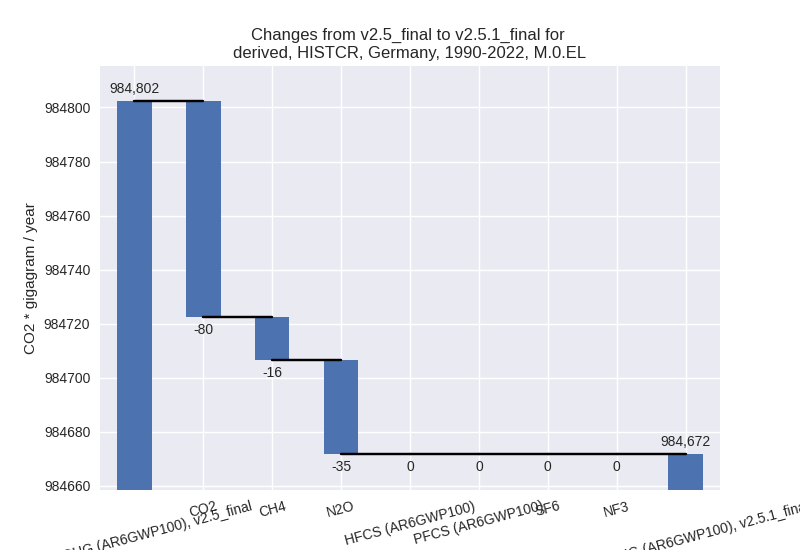
The following figures show the aggregate national total emissions excluding LULUCF AR6GWP100 for the country reported priority scenario. The dotted linesshow the v2.5_final data.
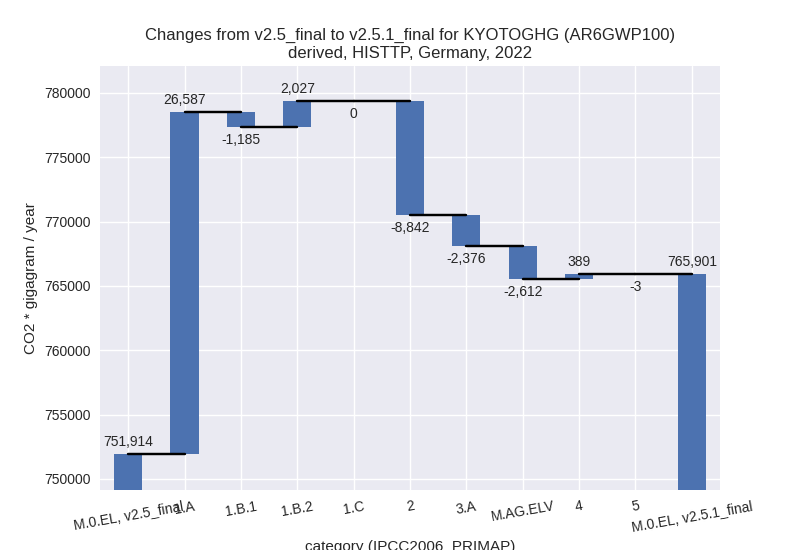
The following figures show the aggregate national total emissions excluding LULUCF AR6GWP100 for the third party priority scenario. The dotted linesshow the v2.5_final data.


Overview over changes
In the country reported priority scenario we have the following changes for aggregate Kyoto GHG and national total emissions excluding LULUCF (M.0.EL):
- Emissions in 2022 have changed by -0.6%% (-4309.15 Gg CO2 / year)
- Emissions in 1990-2022 have changed by -0.0%% (-130.58 Gg CO2 / year)
In the third party priority scenario we have the following changes for aggregate Kyoto GHG and national total emissions excluding LULUCF (M.0.EL):
- Emissions in 2022 have changed by 1.9%% (13986.12 Gg CO2 / year)
- Emissions in 1990-2022 have changed by 0.6%% (6184.64 Gg CO2 / year)
Most important changes per scenario and time frame
In the country reported priority scenario the following sector-gas combinations have the highest absolute impact on national total KyotoGHG (AR6GWP100) emissions in 2022 (top 5):
- 1: 2, CO2 with -2160.49 Gg CO2 / year (-4.9%)
- 2: 3.A, CH4 with -1631.19 Gg CO2 / year (-4.8%)
- 3: M.AG.ELV, N2O with -1381.35 Gg CO2 / year (-7.2%)
- 4: 4, CH4 with 1323.23 Gg CO2 / year (57.2%)
- 5: M.AG.ELV, CO2 with -508.30 Gg CO2 / year (-17.7%)
In the country reported priority scenario the following sector-gas combinations have the highest absolute impact on national total KyotoGHG (AR6GWP100) emissions in 1990-2022 (top 5):
- 1: 2, CO2 with -65.47 Gg CO2 / year (-0.1%)
- 2: 3.A, CH4 with -49.43 Gg CO2 / year (-0.1%)
- 3: M.AG.ELV, N2O with -41.86 Gg CO2 / year (-0.2%)
- 4: 4, CH4 with 40.10 Gg CO2 / year (0.2%)
- 5: M.AG.ELV, CO2 with -15.40 Gg CO2 / year (-0.6%)
In the third party priority scenario the following sector-gas combinations have the highest absolute impact on national total KyotoGHG (AR6GWP100) emissions in 2022 (top 5):
- 1: 1.A, CO2 with 26023.72 Gg CO2 / year (4.4%)
- 2: 2, CO2 with -9347.29 Gg CO2 / year (-21.7%)
- 3: 3.A, CH4 with -2189.23 Gg CO2 / year (-6.2%)
- 4: M.AG.ELV, CO2 with -2134.06 Gg CO2 / year (-78.2%)
- 5: 1.B.2, CH4 with 2093.12 Gg CO2 / year (44.6%)
In the third party priority scenario the following sector-gas combinations have the highest absolute impact on national total KyotoGHG (AR6GWP100) emissions in 1990-2022 (top 5):
- 1: 1.B.2, CO2 with 11233.66 Gg CO2 / year (430.1%)
- 2: 2, CO2 with -8550.12 Gg CO2 / year (-18.9%)
- 3: 1.A, CO2 with 3150.19 Gg CO2 / year (0.4%)
- 4: M.AG.ELV, N2O with 1499.92 Gg CO2 / year (6.3%)
- 5: M.AG.ELV, CO2 with -1297.79 Gg CO2 / year (-60.1%)
Notes on data changes
No country specific notes present for this changelog.
Changes by sector and gas
For each scenario and time frame the changes are displayed for all individual sectors and all individual gases. In the sector plot we use aggregate Kyoto GHGs in AR6GWP100. In the gas plot we usenational total emissions without LULUCF. ## country reported scenario
2022


1990-2022
third party scenario
2022

1990-2022


Detailed changes for the scenarios:
country reported scenario (HISTCR):
Most important changes per time frame
For 2022 the following sector-gas combinations have the highest absolute impact on national total KyotoGHG (AR6GWP100) emissions in 2022 (top 5):
- 1: 2, CO2 with -2160.49 Gg CO2 / year (-4.9%)
- 2: 3.A, CH4 with -1631.19 Gg CO2 / year (-4.8%)
- 3: M.AG.ELV, N2O with -1381.35 Gg CO2 / year (-7.2%)
- 4: 4, CH4 with 1323.23 Gg CO2 / year (57.2%)
- 5: M.AG.ELV, CO2 with -508.30 Gg CO2 / year (-17.7%)
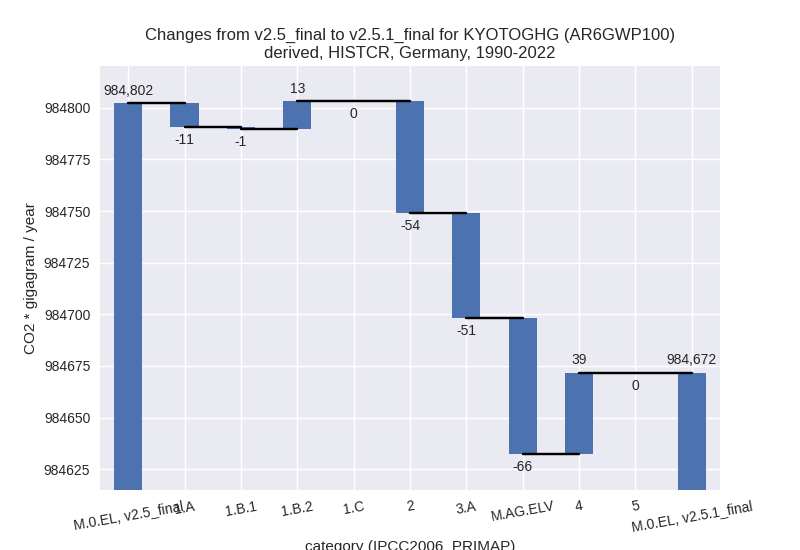
For 1990-2022 the following sector-gas combinations have the highest absolute impact on national total KyotoGHG (AR6GWP100) emissions in 1990-2022 (top 5):
- 1: 2, CO2 with -65.47 Gg CO2 / year (-0.1%)
- 2: 3.A, CH4 with -49.43 Gg CO2 / year (-0.1%)
- 3: M.AG.ELV, N2O with -41.86 Gg CO2 / year (-0.2%)
- 4: 4, CH4 with 40.10 Gg CO2 / year (0.2%)
- 5: M.AG.ELV, CO2 with -15.40 Gg CO2 / year (-0.6%)
Changes in the main sectors for aggregate KyotoGHG (AR6GWP100) are
- 1: Total sectoral emissions in 2022 are 634783.21 Gg CO2 / year which is 84.6% of M.0.EL emissions. 2022 Emissions have changed by 0.0% (27.92 Gg CO2 / year). 1990-2022 Emissions have changed by 0.0% (0.85 Gg CO2 / year).
- 2: Total sectoral emissions in 2022 are 55416.27 Gg
CO2 / year which is 7.4% of M.0.EL emissions. 2022 Emissions have
changed by -3.1% (-1786.28 Gg CO2 /
year). 1990-2022 Emissions have changed by -0.1% (-54.13 Gg CO2 / year). For 2022 the
changes per gas
are:

- M.AG: Total sectoral emissions in 2022 are 55554.85
Gg CO2 / year which is 7.4% of M.0.EL emissions. 2022 Emissions have
changed by -6.5% (-3853.26 Gg CO2 /
year). 1990-2022 Emissions have changed by -0.2% (-116.77 Gg CO2 / year). For 2022
the changes per gas
are:

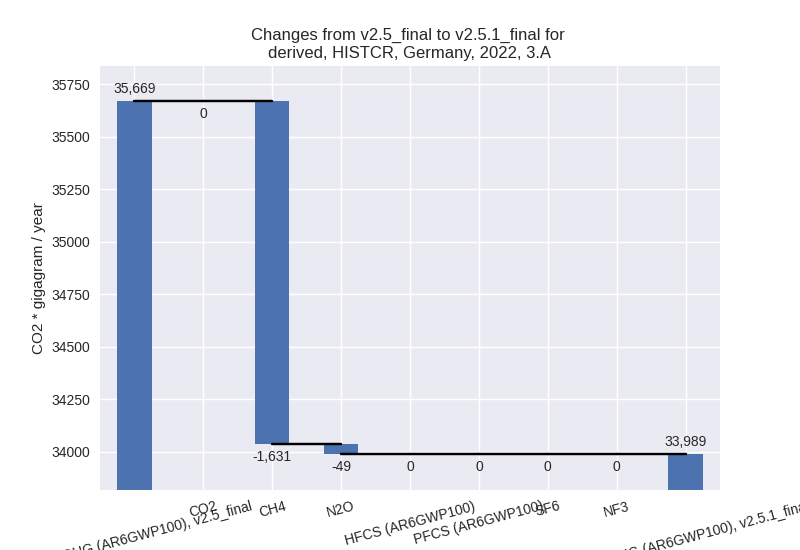
The changes come from the following subsectors:- 3.A: Total sectoral emissions in 2022 are 33989.40
Gg CO2 / year which is 61.2% of category M.AG emissions. 2022 Emissions
have changed by -4.7% (-1680.01 Gg
CO2 / year). 1990-2022 Emissions have changed by -0.1% (-50.91 Gg CO2 / year). For 2022 the
changes per gas
are:
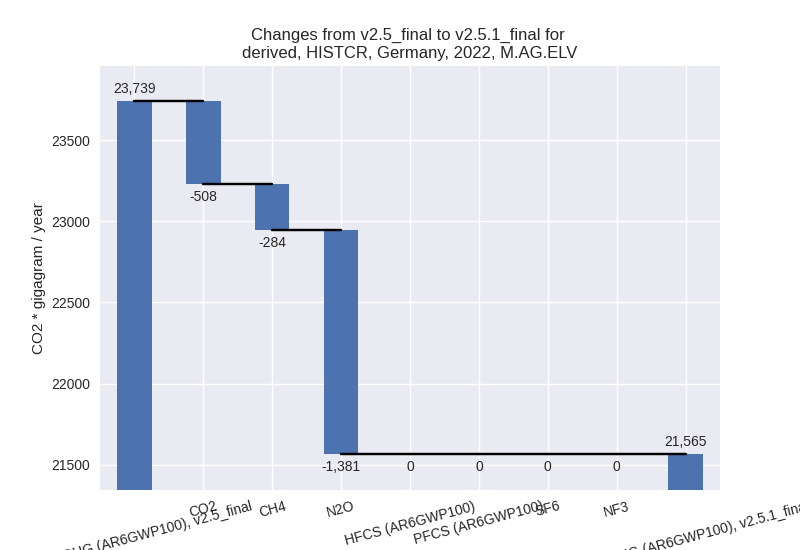
There is no subsector information available in PRIMAP-hist. - M.AG.ELV: Total sectoral emissions in 2022 are
21565.45 Gg CO2 / year which is 38.8% of category M.AG emissions. 2022
Emissions have changed by -9.2%
(-2173.25 Gg CO2 / year). 1990-2022 Emissions have changed by -0.3% (-65.86 Gg CO2 / year). For 2022 the
changes per gas
are:
There is no subsector information available in PRIMAP-hist.
- 3.A: Total sectoral emissions in 2022 are 33989.40
Gg CO2 / year which is 61.2% of category M.AG emissions. 2022 Emissions
have changed by -4.7% (-1680.01 Gg
CO2 / year). 1990-2022 Emissions have changed by -0.1% (-50.91 Gg CO2 / year). For 2022 the
changes per gas
are:
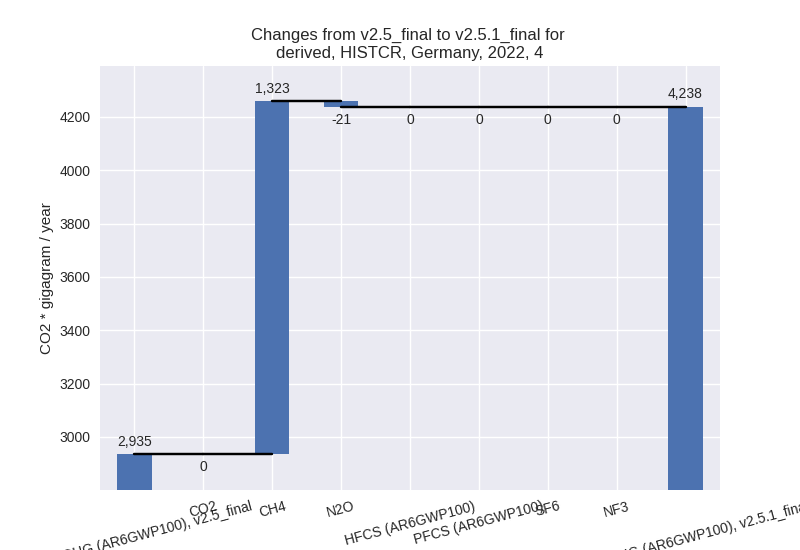
- 4: Total sectoral emissions in 2022 are 4237.87 Gg
CO2 / year which is 0.6% of M.0.EL emissions. 2022 Emissions have
changed by 44.4% (1302.47 Gg CO2 /
year). 1990-2022 Emissions have changed by 0.2% (39.47 Gg CO2 / year). For 2022 the
changes per gas
are:
- 5: No data
third party scenario (HISTTP):
Most important changes per time frame
For 2022 the following sector-gas combinations have the highest absolute impact on national total KyotoGHG (AR6GWP100) emissions in 2022 (top 5):
- 1: 1.A, CO2 with 26023.72 Gg CO2 / year (4.4%)
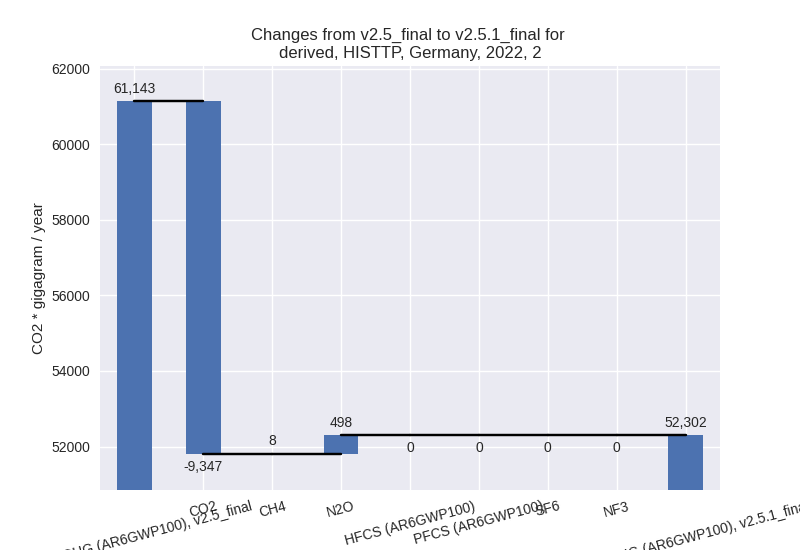
- 2: 2, CO2 with -9347.29 Gg CO2 / year (-21.7%)
- 3: 3.A, CH4 with -2189.23 Gg CO2 / year (-6.2%)
- 4: M.AG.ELV, CO2 with -2134.06 Gg CO2 / year (-78.2%)
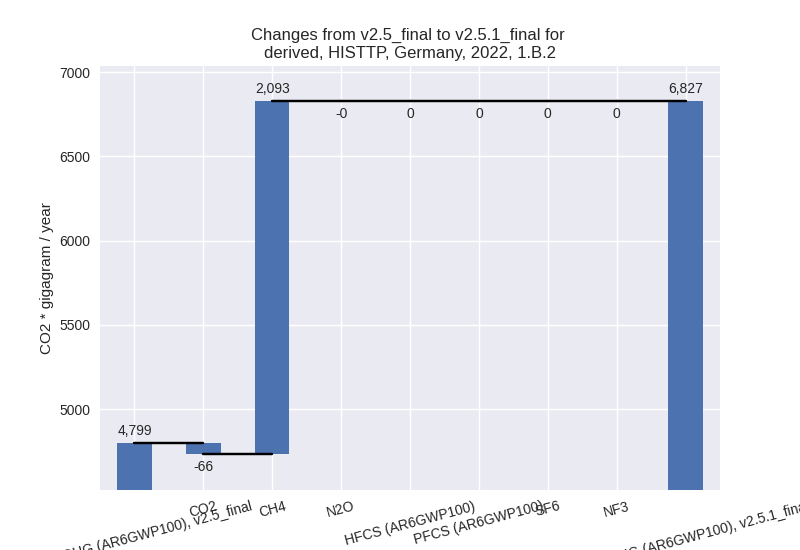
- 5: 1.B.2, CH4 with 2093.12 Gg CO2 / year (44.6%)
For 1990-2022 the following sector-gas combinations have the highest absolute impact on national total KyotoGHG (AR6GWP100) emissions in 1990-2022 (top 5):
- 1: 1.B.2, CO2 with 11233.66 Gg CO2 / year (430.1%)
- 2: 2, CO2 with -8550.12 Gg CO2 / year (-18.9%)
- 3: 1.A, CO2 with 3150.19 Gg CO2 / year (0.4%)
- 4: M.AG.ELV, N2O with 1499.92 Gg CO2 / year (6.3%)
- 5: M.AG.ELV, CO2 with -1297.79 Gg CO2 / year (-60.1%)
Changes in the main sectors for aggregate KyotoGHG (AR6GWP100) are
- 1: Total sectoral emissions in 2022 are 636845.19
Gg CO2 / year which is 83.1% of M.0.EL emissions. 2022 Emissions have
changed by 4.5% (27429.70 Gg CO2 /
year). 1990-2022 Emissions have changed by 1.7% (13824.11 Gg CO2 / year). For 2022
the changes per gas
are:

The changes come from the following subsectors:- 1.A: Total sectoral emissions in 2022 are 623025.68
Gg CO2 / year which is 97.8% of category 1 emissions. 2022 Emissions
have changed by 4.5% (26587.44 Gg
CO2 / year). 1990-2022 Emissions have changed by 0.4% (3196.50 Gg CO2 / year). For 2022 the
changes per gas
are:

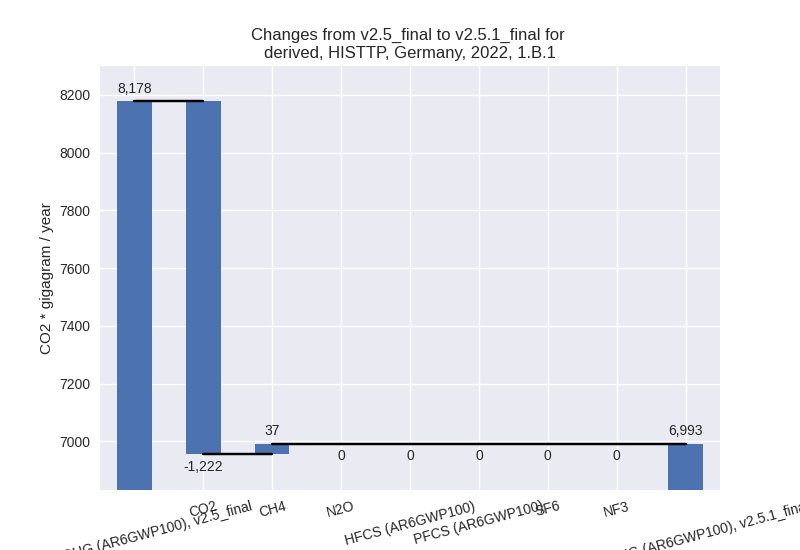
There is no subsector information available in PRIMAP-hist. - 1.B.1: Total sectoral emissions in 2022 are 6992.83
Gg CO2 / year which is 1.1% of category 1 emissions. 2022 Emissions have
changed by -14.5% (-1185.21 Gg CO2 /
year). 1990-2022 Emissions have changed by 1.5% (230.86 Gg CO2 / year). For 2022 the
changes per gas
are:
There is no subsector information available in PRIMAP-hist. - 1.B.2: Total sectoral emissions in 2022 are 6826.68
Gg CO2 / year which is 1.1% of category 1 emissions. 2022 Emissions have
changed by 42.2% (2027.46 Gg CO2 /
year). 1990-2022 Emissions have changed by 96.4% (10396.76 Gg CO2 / year). For 2022
the changes per gas
are:
For 1990-2022 the changes per gas are:
There is no subsector information available in PRIMAP-hist.
- 1.A: Total sectoral emissions in 2022 are 623025.68
Gg CO2 / year which is 97.8% of category 1 emissions. 2022 Emissions
have changed by 4.5% (26587.44 Gg
CO2 / year). 1990-2022 Emissions have changed by 0.4% (3196.50 Gg CO2 / year). For 2022 the
changes per gas
are:
- 2: Total sectoral emissions in 2022 are 52301.64 Gg
CO2 / year which is 6.8% of M.0.EL emissions. 2022 Emissions have
changed by -14.5% (-8841.73 Gg CO2 /
year). 1990-2022 Emissions have changed by -10.9% (-7765.14 Gg CO2 / year). For 2022
the changes per gas
are:
For 1990-2022 the changes per gas are:
- M.AG: Total sectoral emissions in 2022 are 56458.73
Gg CO2 / year which is 7.4% of M.0.EL emissions. 2022 Emissions have
changed by -8.1% (-4987.74 Gg CO2 /
year). 1990-2022 Emissions have changed by 0.2% (113.97 Gg CO2 / year). For 2022 the
changes per gas
are:
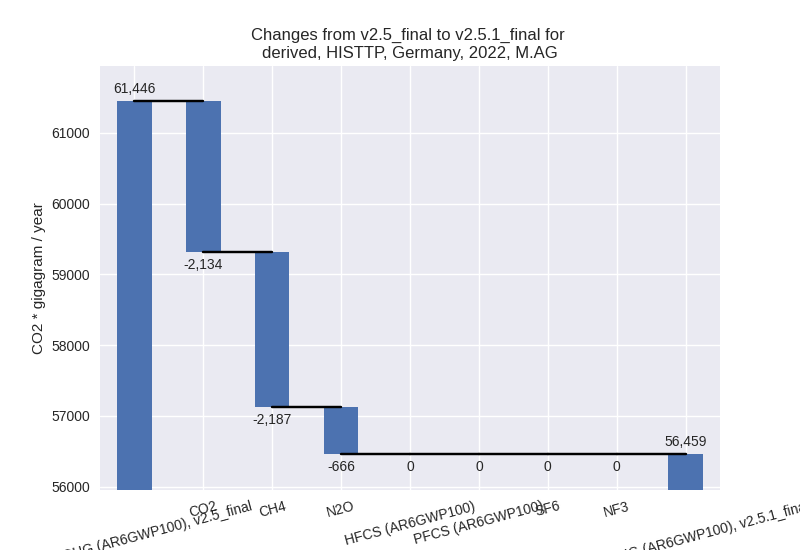
The changes come from the following subsectors:- 3.A: Total sectoral emissions in 2022 are 35602.99
Gg CO2 / year which is 63.1% of category M.AG emissions. 2022 Emissions
have changed by -6.3% (-2375.71 Gg
CO2 / year). 1990-2022 Emissions have changed by -0.2% (-88.43 Gg CO2 / year). For 2022 the
changes per gas
are:

There is no subsector information available in PRIMAP-hist. - M.AG.ELV: Total sectoral emissions in 2022 are
20855.74 Gg CO2 / year which is 36.9% of category M.AG emissions. 2022
Emissions have changed by -11.1%
(-2612.04 Gg CO2 / year). 1990-2022 Emissions have changed by 0.8% (202.40 Gg CO2 / year). For 2022 the
changes per gas
are:

There is no subsector information available in PRIMAP-hist.
- 3.A: Total sectoral emissions in 2022 are 35602.99
Gg CO2 / year which is 63.1% of category M.AG emissions. 2022 Emissions
have changed by -6.3% (-2375.71 Gg
CO2 / year). 1990-2022 Emissions have changed by -0.2% (-88.43 Gg CO2 / year). For 2022 the
changes per gas
are:
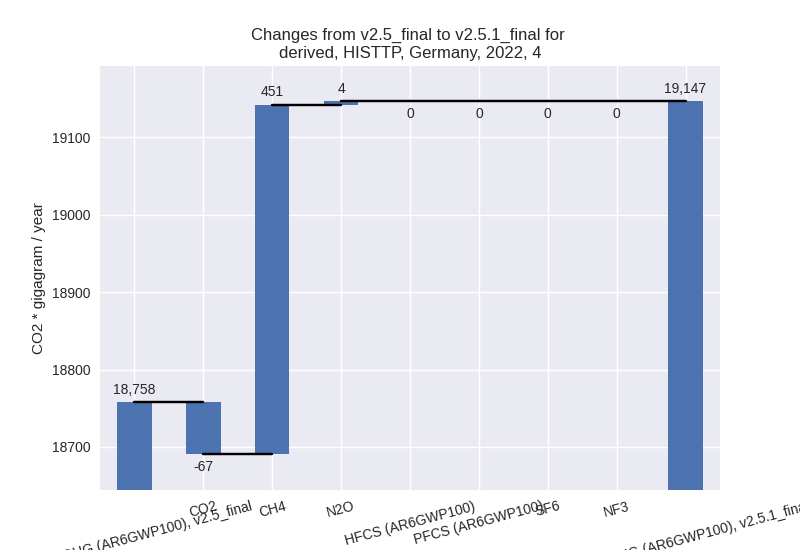
- 4: Total sectoral emissions in 2022 are 19146.63 Gg
CO2 / year which is 2.5% of M.0.EL emissions. 2022 Emissions have
changed by 2.1% (388.59 Gg CO2 /
year). 1990-2022 Emissions have changed by 0.0% (11.78 Gg CO2 / year). For 2022 the
changes per gas
are:
- 5: Total sectoral emissions in 2022 are 1148.38 Gg CO2 / year which is 0.1% of M.0.EL emissions. 2022 Emissions have changed by -0.2% (-2.69 Gg CO2 / year). 1990-2022 Emissions have changed by -0.0% (-0.08 Gg CO2 / year).