Changes in PRIMAP-hist v2.5.1_final compared to v2.5_final for EARTH
2024-02-29
Johannes Gütschow
Change analysis for EARTH for PRIMAP-hist v2.5.1_final compared to v2.5_final
Overview over emissions by sector and gas
The following figures show the aggregate national total emissions excluding LULUCF AR6GWP100 for the country reported priority scenario. The dotted linesshow the v2.5_final data.
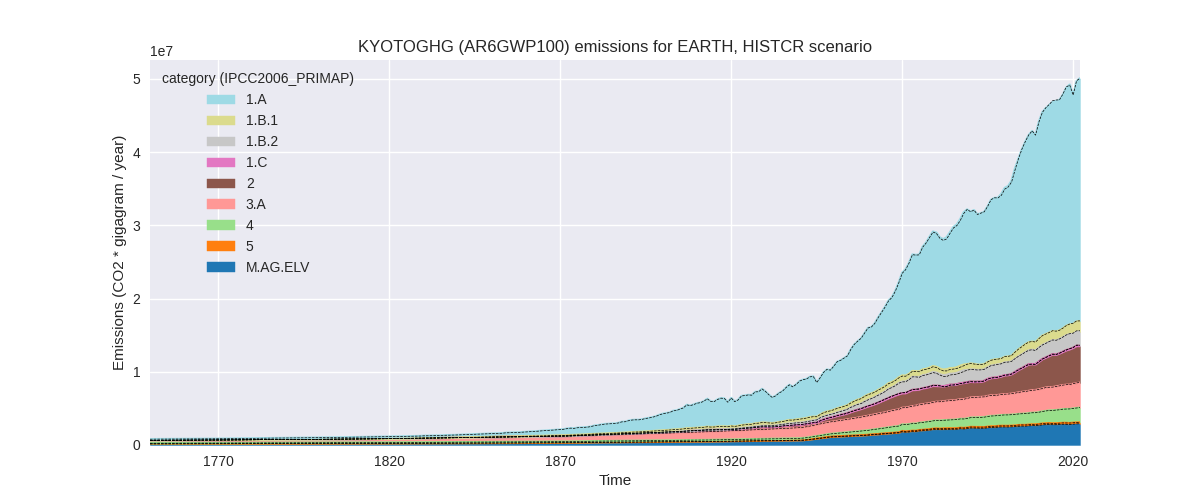
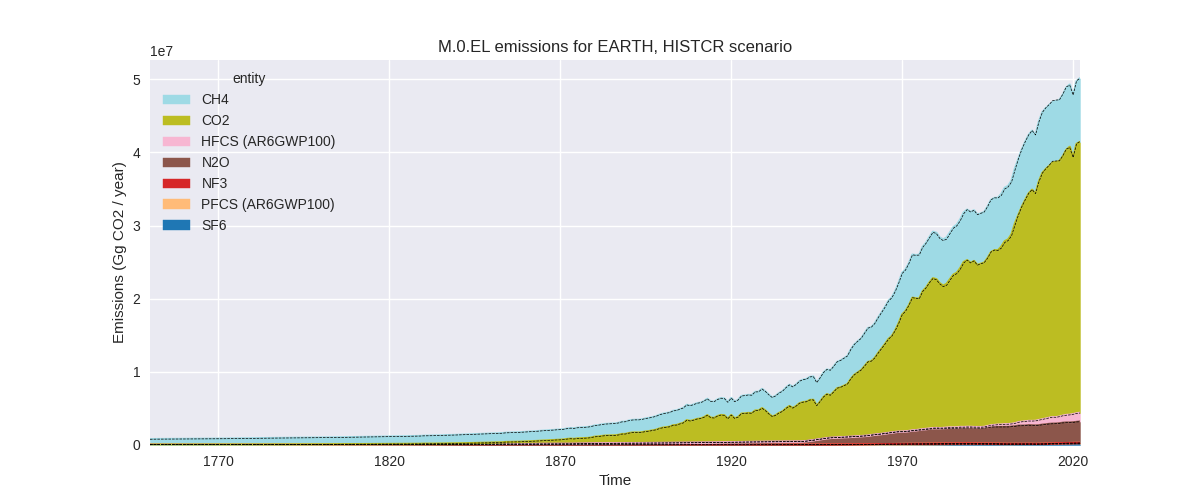
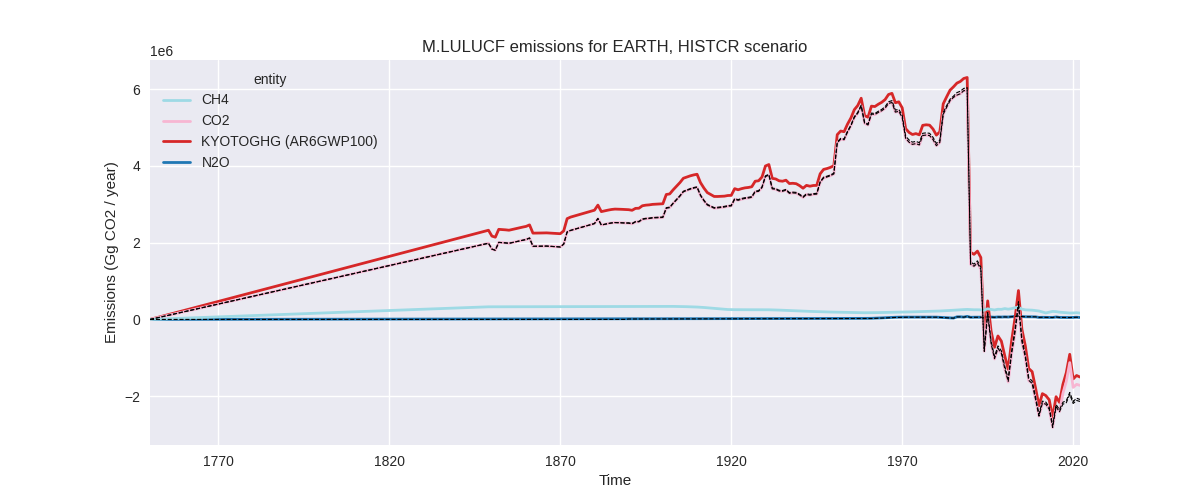
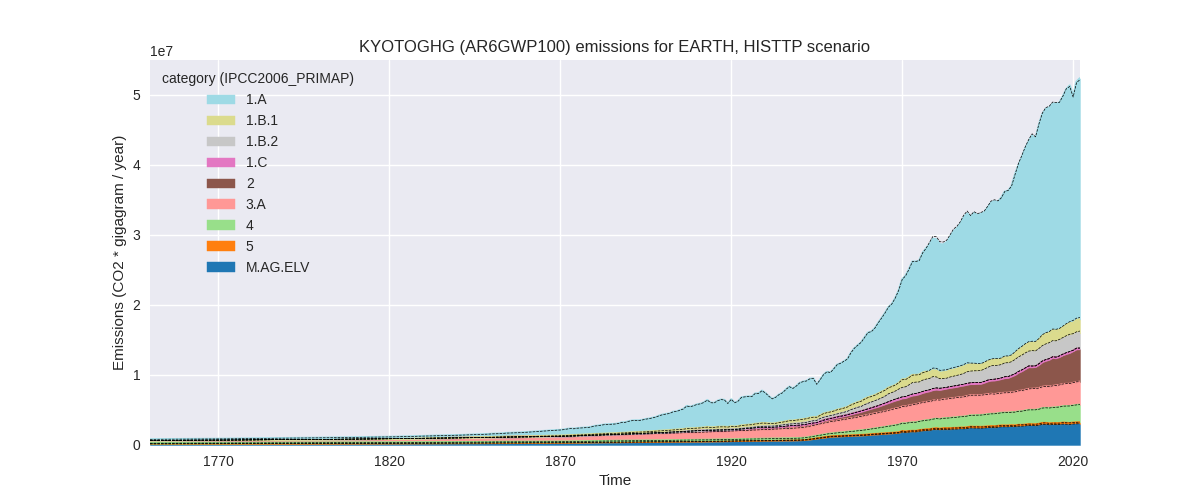
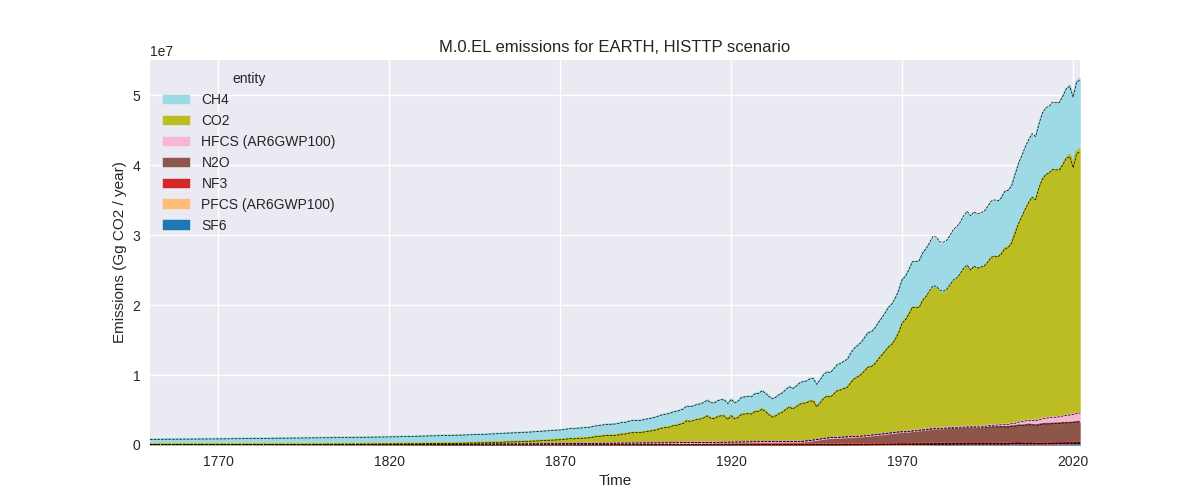
The following figures show the aggregate national total emissions excluding LULUCF AR6GWP100 for the third party priority scenario. The dotted linesshow the v2.5_final data.
Overview over changes
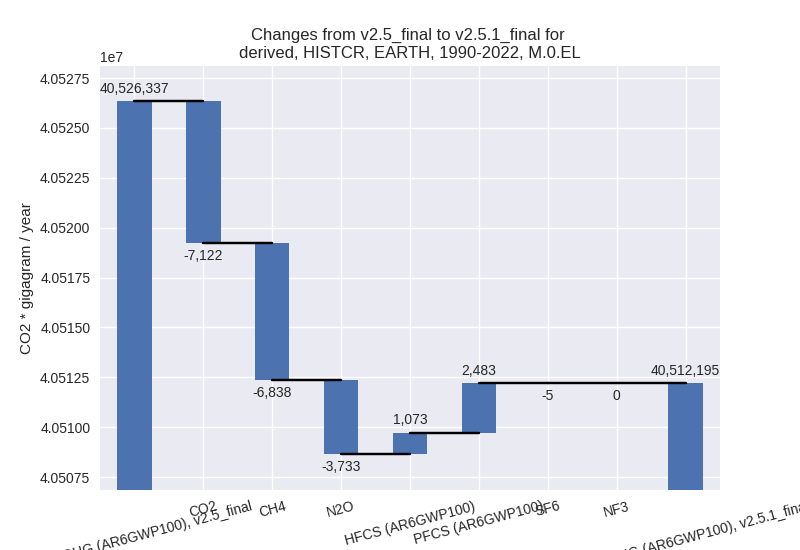
In the country reported priority scenario we have the following changes for aggregate Kyoto GHG and national total emissions excluding LULUCF (M.0.EL):
- Emissions in 2022 have changed by -0.0%% (-8768.00 Gg CO2 / year)
- Emissions in 1990-2022 have changed by -0.0%% (-14142.03 Gg CO2 / year)
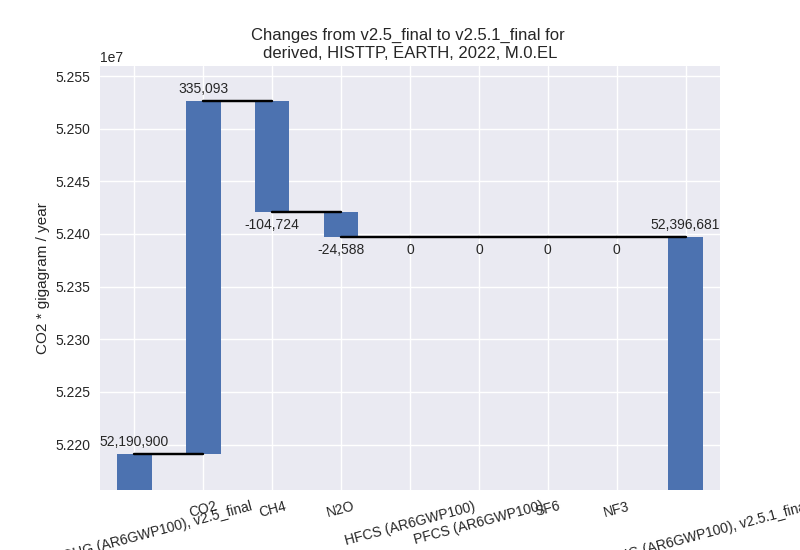
In the third party priority scenario we have the following changes for aggregate Kyoto GHG and national total emissions excluding LULUCF (M.0.EL):
- Emissions in 2022 have changed by 0.4%% (205781.00 Gg CO2 / year)
- Emissions in 1990-2022 have changed by -0.3%% (-140157.70 Gg CO2 / year)
Most important changes per scenario and time frame
In the country reported priority scenario the following sector-gas combinations have the highest absolute impact on national total KyotoGHG (AR6GWP100) emissions in 2022 (top 5):
- 1: 1.B.1, CH4 with 111453.36 Gg CO2 / year (11.9%)
- 2: 2, CO2 with -96719.30 Gg CO2 / year (-2.8%)
- 3: 1.B.2, CH4 with -37255.12 Gg CO2 / year (-2.4%)
- 4: 1.B.2, CO2 with -19499.95 Gg CO2 / year (-4.3%)
- 5: 2, PFCS (AR6GWP100) with 18842.47 Gg CO2 / year (17.9%)
In the country reported priority scenario the following sector-gas combinations have the highest absolute impact on national total KyotoGHG (AR6GWP100) emissions in 1990-2022 (top 5):
- 1: 1.A, CO2 with 26494.85 Gg CO2 / year (0.1%)
- 2: 2, CO2 with -17050.61 Gg CO2 / year (-0.7%)
- 3: 1.B.2, CH4 with -11326.70 Gg CO2 / year (-0.8%)
- 4: 1.B.1, CO2 with -8131.39 Gg CO2 / year (-4.9%)
- 5: M.AG.ELV, CO2 with -7804.86 Gg CO2 / year (-6.7%)
In the third party priority scenario the following sector-gas combinations have the highest absolute impact on national total KyotoGHG (AR6GWP100) emissions in 2022 (top 5):
- 1: 1.A, CO2 with 447549.00 Gg CO2 / year (1.3%)
- 2: 1.B.2, CH4 with -181487.77 Gg CO2 / year (-8.5%)
- 3: 2, CO2 with -116260.80 Gg CO2 / year (-3.9%)
- 4: 1.B.1, CH4 with 53991.35 Gg CO2 / year (3.9%)
- 5: M.AG.ELV, N2O with -42905.58 Gg CO2 / year (-2.1%)
In the third party priority scenario the following sector-gas combinations have the highest absolute impact on national total KyotoGHG (AR6GWP100) emissions in 1990-2022 (top 5):
- 1: 2, CO2 with -111081.05 Gg CO2 / year (-5.4%)
- 2: 1.B.2, CH4 with -102775.94 Gg CO2 / year (-5.6%)
- 3: 1.A, CO2 with 88944.64 Gg CO2 / year (0.3%)
- 4: M.AG.ELV, N2O with -22276.36 Gg CO2 / year (-1.3%)
- 5: 1.B.1, CH4 with 19534.94 Gg CO2 / year (1.9%)
Notes on data changes
No country specific notes present for this changelog.
Changes by sector and gas
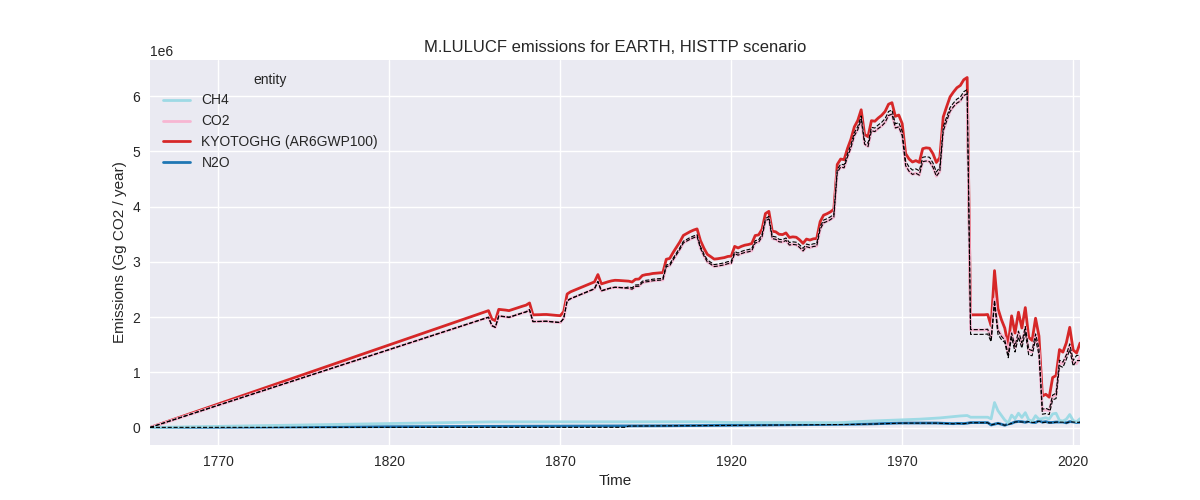
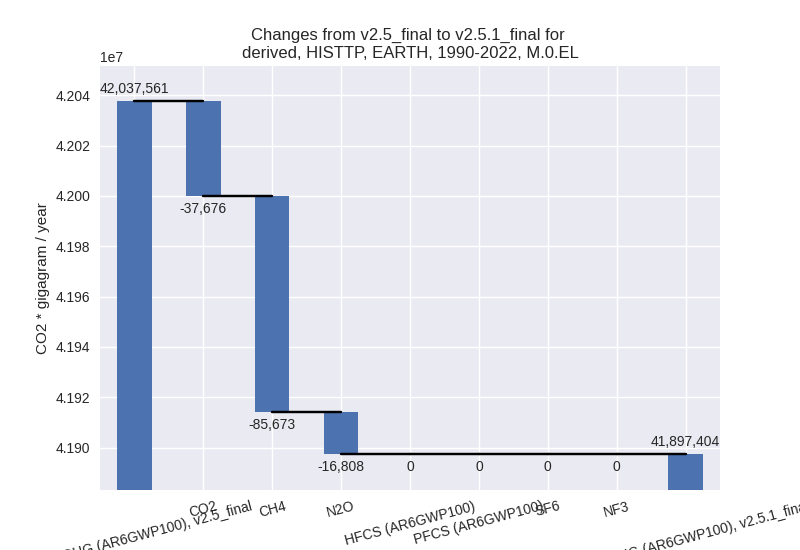
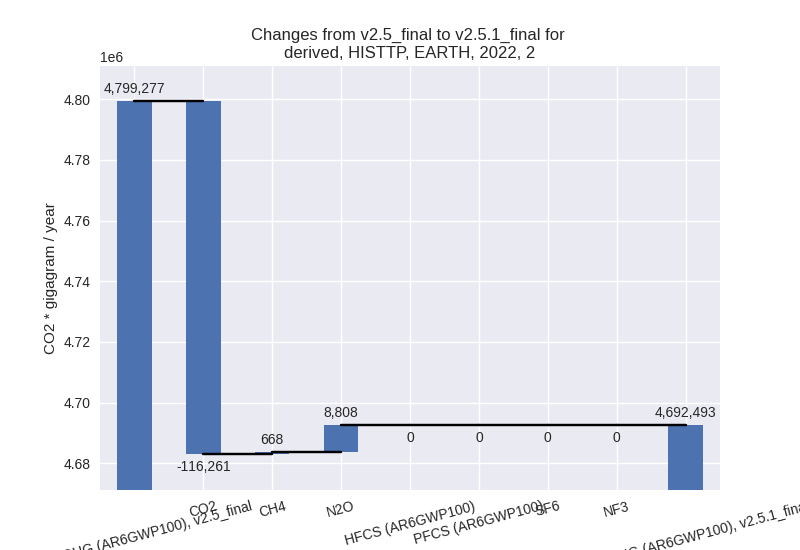
For each scenario and time frame the changes are displayed for all individual sectors and all individual gases. In the sector plot we use aggregate Kyoto GHGs in AR6GWP100. In the gas plot we usenational total emissions without LULUCF. ## country reported scenario
2022

1990-2022
third party scenario
2022

1990-2022
Detailed changes for the scenarios:
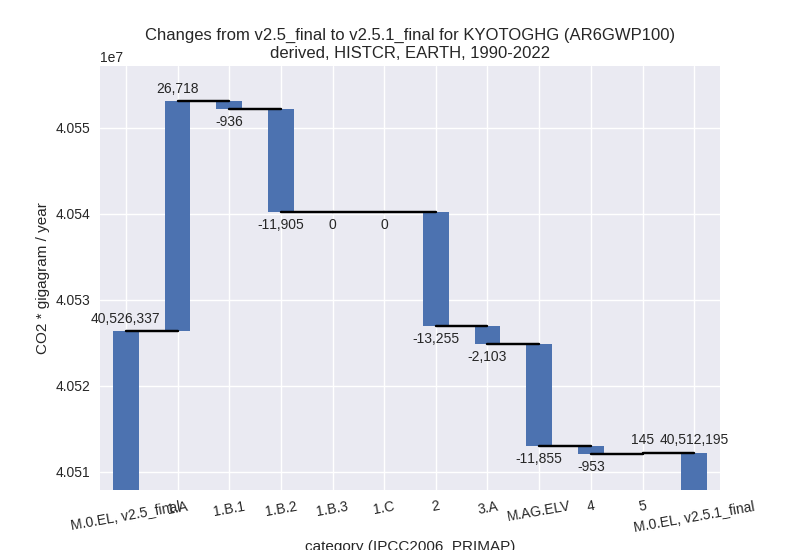
country reported scenario (HISTCR):
Most important changes per time frame
For 2022 the following sector-gas combinations have the highest absolute impact on national total KyotoGHG (AR6GWP100) emissions in 2022 (top 5):
- 1: 1.B.1, CH4 with 111453.36 Gg CO2 / year (11.9%)
- 2: 2, CO2 with -96719.30 Gg CO2 / year (-2.8%)
- 3: 1.B.2, CH4 with -37255.12 Gg CO2 / year (-2.4%)
- 4: 1.B.2, CO2 with -19499.95 Gg CO2 / year (-4.3%)
- 5: 2, PFCS (AR6GWP100) with 18842.47 Gg CO2 / year (17.9%)
For 1990-2022 the following sector-gas combinations have the highest absolute impact on national total KyotoGHG (AR6GWP100) emissions in 1990-2022 (top 5):
- 1: 1.A, CO2 with 26494.85 Gg CO2 / year (0.1%)
- 2: 2, CO2 with -17050.61 Gg CO2 / year (-0.7%)
- 3: 1.B.2, CH4 with -11326.70 Gg CO2 / year (-0.8%)
- 4: 1.B.1, CO2 with -8131.39 Gg CO2 / year (-4.9%)
- 5: M.AG.ELV, CO2 with -7804.86 Gg CO2 / year (-6.7%)
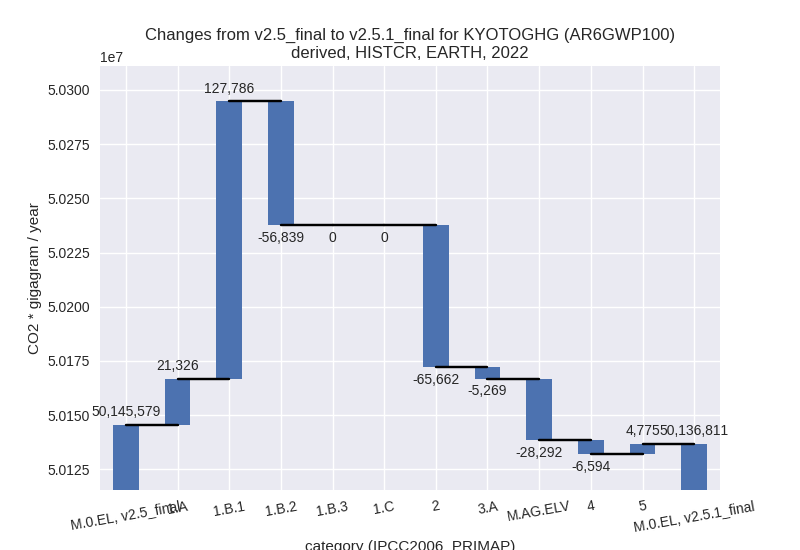
Changes in the main sectors for aggregate KyotoGHG (AR6GWP100) are
- 1: Total sectoral emissions in 2022 are 36616842.00 Gg CO2 / year which is 73.0% of M.0.EL emissions. 2022 Emissions have changed by 0.3% (92274.00 Gg CO2 / year). 1990-2022 Emissions have changed by 0.0% (13877.12 Gg CO2 / year).
- 2: Total sectoral emissions in 2022 are 5016755.90 Gg CO2 / year which is 10.0% of M.0.EL emissions. 2022 Emissions have changed by -1.3% (-65661.60 Gg CO2 / year). 1990-2022 Emissions have changed by -0.4% (-13254.76 Gg CO2 / year).
- M.AG: Total sectoral emissions in 2022 are 6290078.90 Gg CO2 / year which is 12.5% of M.0.EL emissions. 2022 Emissions have changed by -0.5% (-33560.60 Gg CO2 / year). 1990-2022 Emissions have changed by -0.2% (-13957.23 Gg CO2 / year).
- 4: Total sectoral emissions in 2022 are 2013306.50 Gg CO2 / year which is 4.0% of M.0.EL emissions. 2022 Emissions have changed by -0.3% (-6594.10 Gg CO2 / year). 1990-2022 Emissions have changed by -0.1% (-952.62 Gg CO2 / year).
- 5: Total sectoral emissions in 2022 are 199827.78
Gg CO2 / year which is 0.4% of M.0.EL emissions. 2022 Emissions have
changed by 2.4% (4774.67 Gg CO2 /
year). 1990-2022 Emissions have changed by 0.1% (145.40 Gg CO2 / year). For 2022 the
changes per gas
are:

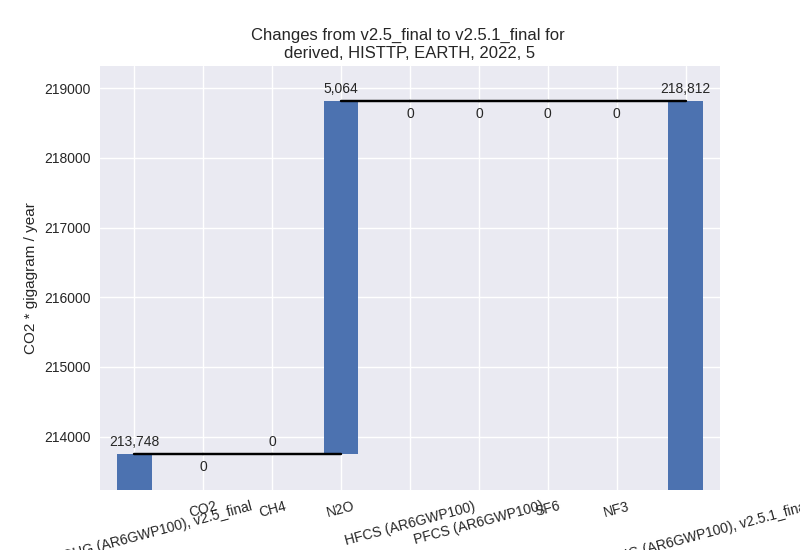
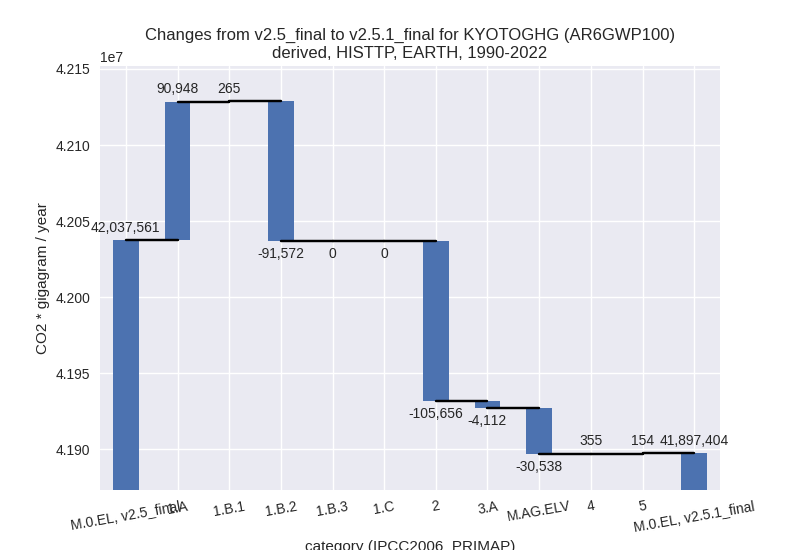
third party scenario (HISTTP):
Most important changes per time frame
For 2022 the following sector-gas combinations have the highest absolute impact on national total KyotoGHG (AR6GWP100) emissions in 2022 (top 5):
- 1: 1.A, CO2 with 447549.00 Gg CO2 / year (1.3%)
- 2: 1.B.2, CH4 with -181487.77 Gg CO2 / year (-8.5%)
- 3: 2, CO2 with -116260.80 Gg CO2 / year (-3.9%)
- 4: 1.B.1, CH4 with 53991.35 Gg CO2 / year (3.9%)
- 5: M.AG.ELV, N2O with -42905.58 Gg CO2 / year (-2.1%)
For 1990-2022 the following sector-gas combinations have the highest absolute impact on national total KyotoGHG (AR6GWP100) emissions in 1990-2022 (top 5):
- 1: 2, CO2 with -111081.05 Gg CO2 / year (-5.4%)
- 2: 1.B.2, CH4 with -102775.94 Gg CO2 / year (-5.6%)
- 3: 1.A, CO2 with 88944.64 Gg CO2 / year (0.3%)
- 4: M.AG.ELV, N2O with -22276.36 Gg CO2 / year (-1.3%)
- 5: 1.B.1, CH4 with 19534.94 Gg CO2 / year (1.9%)
Changes in the main sectors for aggregate KyotoGHG (AR6GWP100) are
- 1: Total sectoral emissions in 2022 are 38684578.00 Gg CO2 / year which is 73.8% of M.0.EL emissions. 2022 Emissions have changed by 0.9% (332745.00 Gg CO2 / year). 1990-2022 Emissions have changed by -0.0% (-360.15 Gg CO2 / year).
- 2: Total sectoral emissions in 2022 are 4692492.60
Gg CO2 / year which is 9.0% of M.0.EL emissions. 2022 Emissions have
changed by -2.2% (-106784.80 Gg CO2
/ year). 1990-2022 Emissions have changed by -3.4% (-105656.39 Gg CO2 / year). For 2022
the changes per gas
are:
For 1990-2022 the changes per gas are:
- M.AG: Total sectoral emissions in 2022 are 6275763.10 Gg CO2 / year which is 12.0% of M.0.EL emissions. 2022 Emissions have changed by -0.6% (-36940.00 Gg CO2 / year). 1990-2022 Emissions have changed by -0.6% (-34650.61 Gg CO2 / year).
- 4: Total sectoral emissions in 2022 are 2525035.50 Gg CO2 / year which is 4.8% of M.0.EL emissions. 2022 Emissions have changed by 0.5% (11697.30 Gg CO2 / year). 1990-2022 Emissions have changed by 0.0% (355.28 Gg CO2 / year).
- 5: Total sectoral emissions in 2022 are 218812.22
Gg CO2 / year which is 0.4% of M.0.EL emissions. 2022 Emissions have
changed by 2.4% (5064.03 Gg CO2 /
year). 1990-2022 Emissions have changed by 0.1% (154.17 Gg CO2 / year). For 2022 the
changes per gas
are: