Changes in PRIMAP-hist v2.5.1_final compared to v2.5_final for Ecuador
2024-02-29
Johannes Gütschow
Change analysis for Ecuador for PRIMAP-hist v2.5.1_final compared to v2.5_final
Overview over emissions by sector and gas
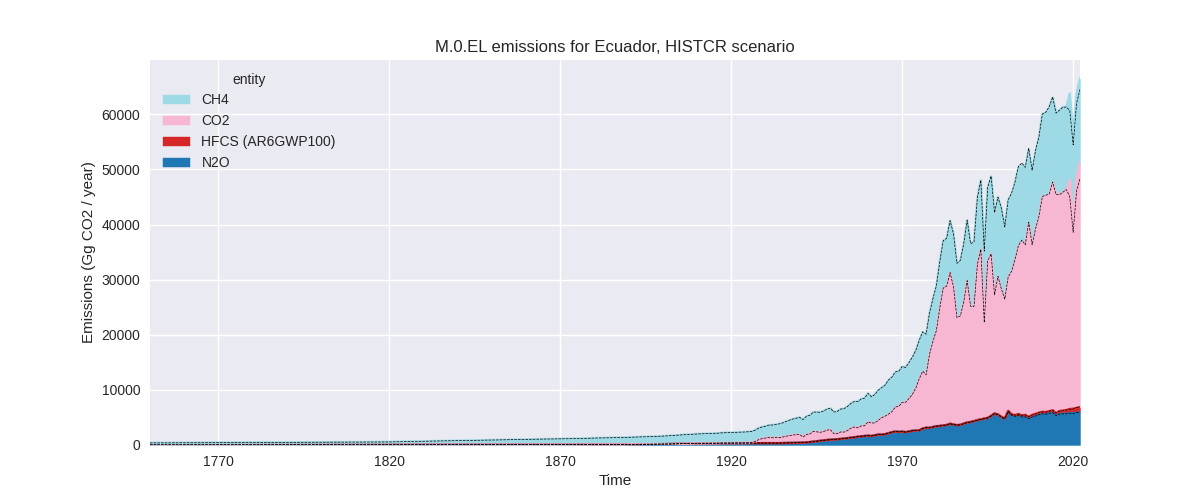
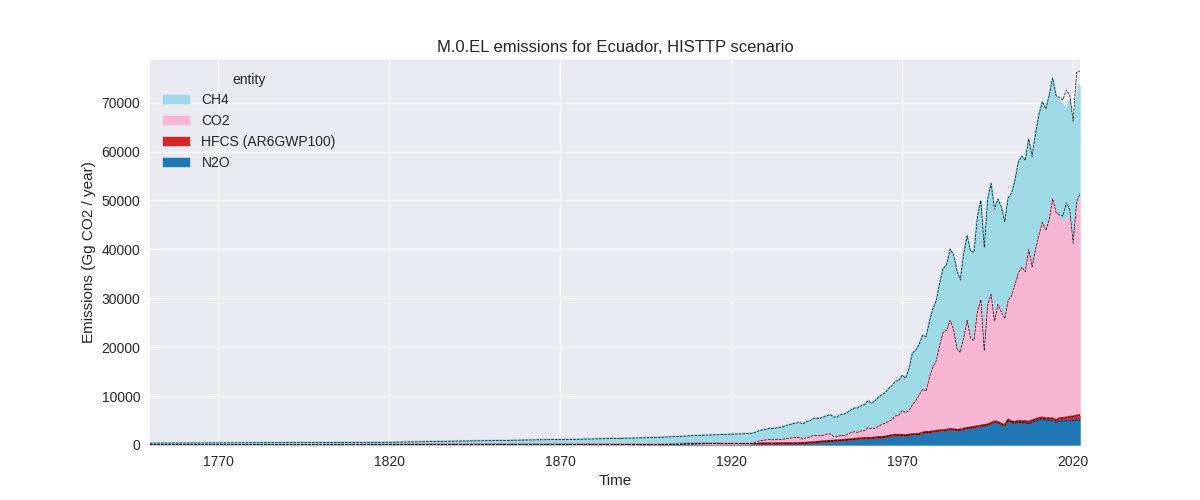
The following figures show the aggregate national total emissions excluding LULUCF AR6GWP100 for the country reported priority scenario. The dotted linesshow the v2.5_final data.

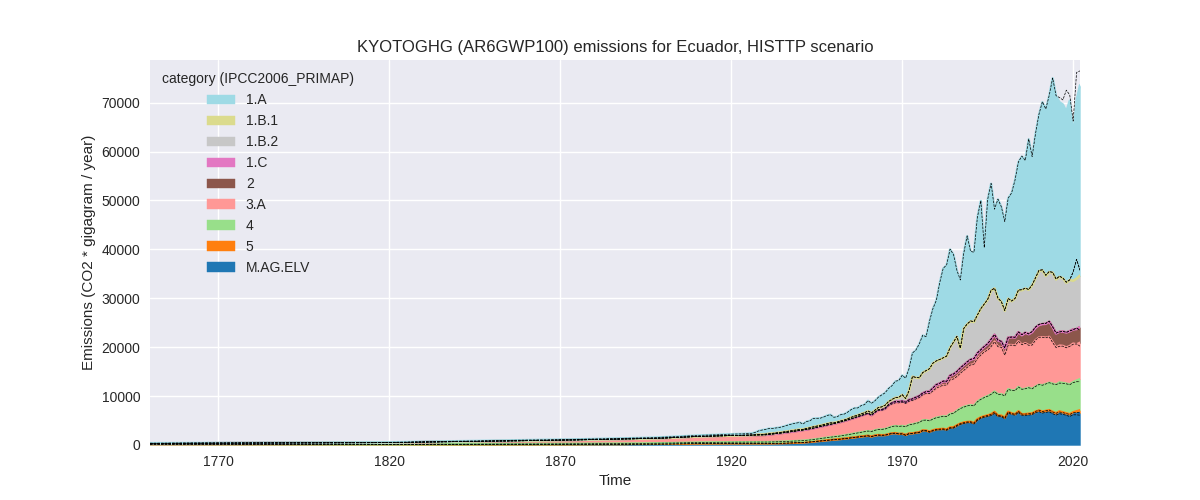
The following figures show the aggregate national total emissions excluding LULUCF AR6GWP100 for the third party priority scenario. The dotted linesshow the v2.5_final data.

Overview over changes
In the country reported priority scenario we have the following changes for aggregate Kyoto GHG and national total emissions excluding LULUCF (M.0.EL):
- Emissions in 2022 have changed by 3.1%% (2008.11 Gg CO2 / year)
- Emissions in 1990-2022 have changed by 0.4%% (181.88 Gg CO2 / year)
In the third party priority scenario we have the following changes for aggregate Kyoto GHG and national total emissions excluding LULUCF (M.0.EL):
- Emissions in 2022 have changed by -3.8%% (-2941.26 Gg CO2 / year)
- Emissions in 1990-2022 have changed by -1.1%% (-642.36 Gg CO2 / year)
Most important changes per scenario and time frame
In the country reported priority scenario the following sector-gas combinations have the highest absolute impact on national total KyotoGHG (AR6GWP100) emissions in 2022 (top 5):
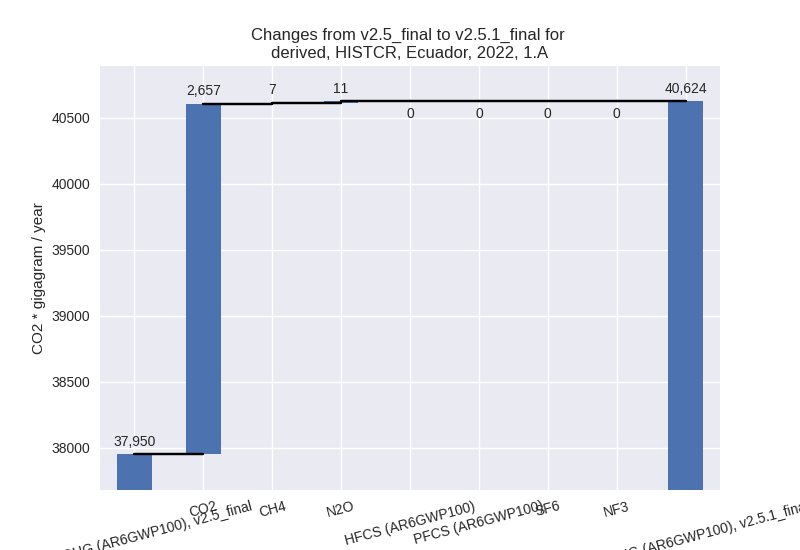
- 1: 1.A, CO2 with 2656.97 Gg CO2 / year (7.1%)
- 2: 3.A, CH4 with -481.82 Gg CO2 / year (-4.2%)
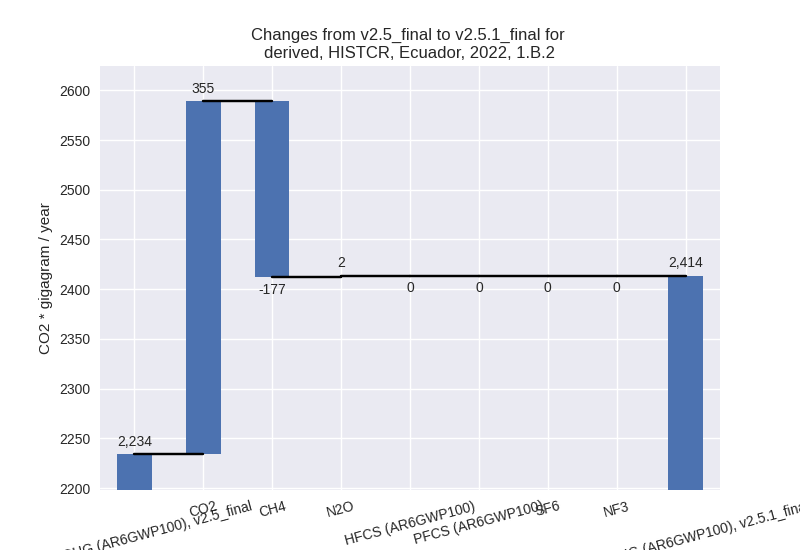
- 3: 1.B.2, CO2 with 354.94 Gg CO2 / year (24.6%)
- 4: 4, CH4 with -321.94 Gg CO2 / year (-10.6%)
- 5: 1.B.2, CH4 with -176.89 Gg CO2 / year (-22.5%)
In the country reported priority scenario the following sector-gas combinations have the highest absolute impact on national total KyotoGHG (AR6GWP100) emissions in 1990-2022 (top 5):
- 1: 1.A, CO2 with 298.56 Gg CO2 / year (1.1%)
- 2: 2, CO2 with -80.46 Gg CO2 / year (-3.2%)
- 3: 3.A, CH4 with -29.87 Gg CO2 / year (-0.3%)
- 4: 1.B.2, CH4 with -19.36 Gg CO2 / year (-3.2%)
- 5: 1.B.2, CO2 with 18.32 Gg CO2 / year (1.6%)
In the third party priority scenario the following sector-gas combinations have the highest absolute impact on national total KyotoGHG (AR6GWP100) emissions in 2022 (top 5):
- 1: 1.B.2, CH4 with -2442.10 Gg CO2 / year (-25.0%)
- 2: 1.A, CO2 with -1861.00 Gg CO2 / year (-4.6%)
- 3: 1.B.2, CO2 with 747.03 Gg CO2 / year (30.2%)
- 4: M.AG.ELV, CH4 with 363.89 Gg CO2 / year (20.3%)
- 5: 3.A, CH4 with 202.88 Gg CO2 / year (2.9%)
In the third party priority scenario the following sector-gas combinations have the highest absolute impact on national total KyotoGHG (AR6GWP100) emissions in 1990-2022 (top 5):
- 1: 1.A, CO2 with -361.82 Gg CO2 / year (-1.3%)
- 2: 1.B.2, CH4 with -248.66 Gg CO2 / year (-3.6%)
- 3: 2, CO2 with -79.95 Gg CO2 / year (-4.3%)
- 4: M.AG.ELV, CO2 with 24.70 Gg CO2 / year (11.3%)
- 5: M.AG.ELV, CH4 with 17.91 Gg CO2 / year (0.8%)
Notes on data changes
No country specific notes present for this changelog.
Changes by sector and gas
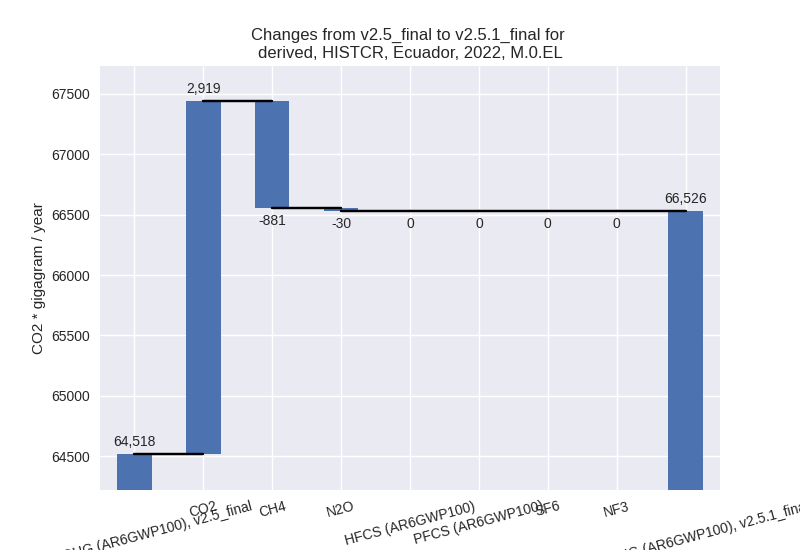
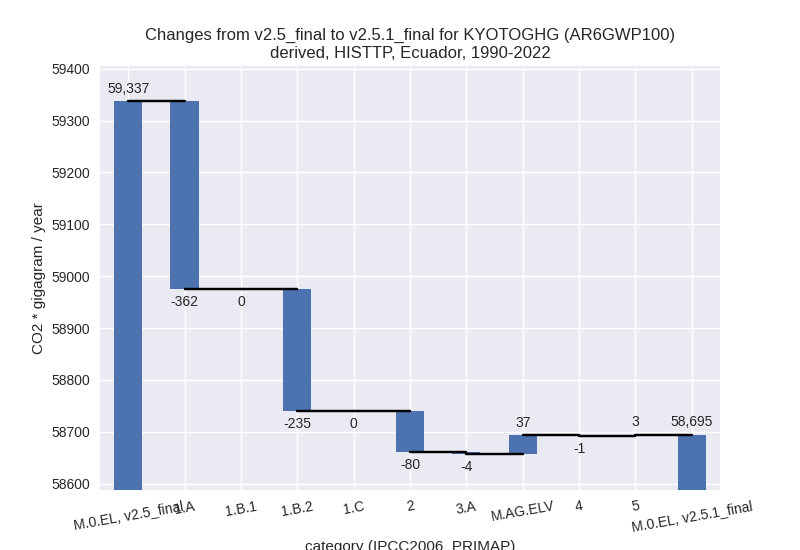
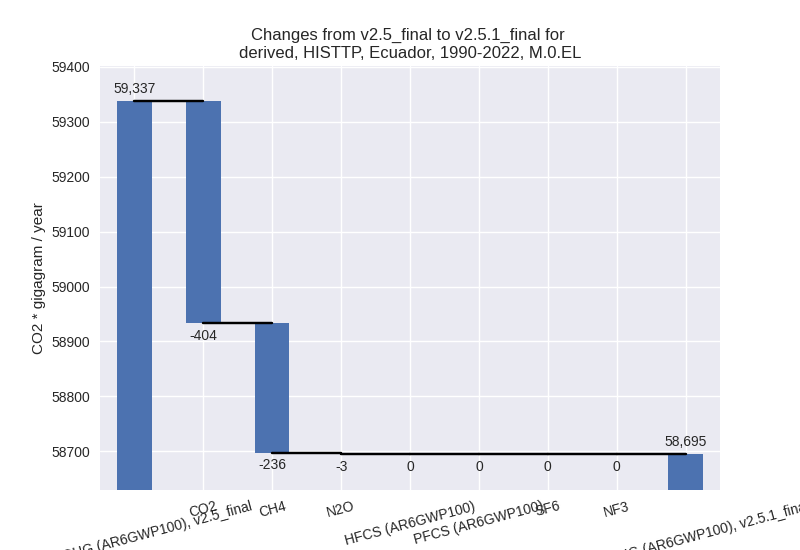
For each scenario and time frame the changes are displayed for all individual sectors and all individual gases. In the sector plot we use aggregate Kyoto GHGs in AR6GWP100. In the gas plot we usenational total emissions without LULUCF. ## country reported scenario
2022

1990-2022


third party scenario
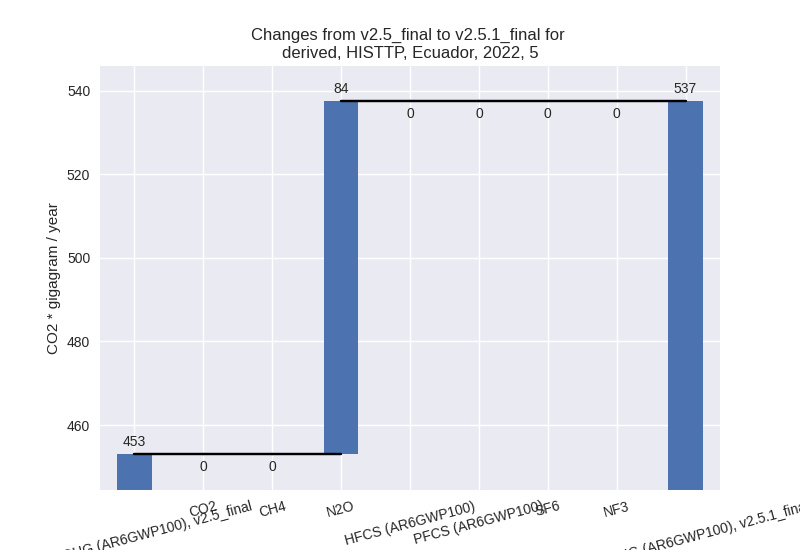
2022


1990-2022
Detailed changes for the scenarios:
country reported scenario (HISTCR):
Most important changes per time frame
For 2022 the following sector-gas combinations have the highest absolute impact on national total KyotoGHG (AR6GWP100) emissions in 2022 (top 5):
- 1: 1.A, CO2 with 2656.97 Gg CO2 / year (7.1%)
- 2: 3.A, CH4 with -481.82 Gg CO2 / year (-4.2%)
- 3: 1.B.2, CO2 with 354.94 Gg CO2 / year (24.6%)
- 4: 4, CH4 with -321.94 Gg CO2 / year (-10.6%)
- 5: 1.B.2, CH4 with -176.89 Gg CO2 / year (-22.5%)
For 1990-2022 the following sector-gas combinations have the highest absolute impact on national total KyotoGHG (AR6GWP100) emissions in 1990-2022 (top 5):
- 1: 1.A, CO2 with 298.56 Gg CO2 / year (1.1%)
- 2: 2, CO2 with -80.46 Gg CO2 / year (-3.2%)
- 3: 3.A, CH4 with -29.87 Gg CO2 / year (-0.3%)
- 4: 1.B.2, CH4 with -19.36 Gg CO2 / year (-3.2%)
- 5: 1.B.2, CO2 with 18.32 Gg CO2 / year (1.6%)
Changes in the main sectors for aggregate KyotoGHG (AR6GWP100) are
- 1: Total sectoral emissions in 2022 are 43038.09 Gg
CO2 / year which is 64.7% of M.0.EL emissions. 2022 Emissions have
changed by 7.1% (2854.53 Gg CO2 /
year). 1990-2022 Emissions have changed by 1.0% (298.56 Gg CO2 / year). For 2022 the
changes per gas
are:

The changes come from the following subsectors:- 1.A: Total sectoral emissions in 2022 are 40624.39
Gg CO2 / year which is 94.4% of category 1 emissions. 2022 Emissions
have changed by 7.0% (2674.85 Gg CO2
/ year). 1990-2022 Emissions have changed by 1.1% (299.51 Gg CO2 / year). For 2022 the
changes per gas
are:
There is no subsector information available in PRIMAP-hist. - 1.B.2: Total sectoral emissions in 2022 are 2413.70
Gg CO2 / year which is 5.6% of category 1 emissions. 2022 Emissions have
changed by 8.0% (179.68 Gg CO2 /
year). 1990-2022 Emissions have changed by -0.1% (-0.96 Gg CO2 / year). For 2022 the
changes per gas
are:
There is no subsector information available in PRIMAP-hist.
- 1.A: Total sectoral emissions in 2022 are 40624.39
Gg CO2 / year which is 94.4% of category 1 emissions. 2022 Emissions
have changed by 7.0% (2674.85 Gg CO2
/ year). 1990-2022 Emissions have changed by 1.1% (299.51 Gg CO2 / year). For 2022 the
changes per gas
are:
- 2: Total sectoral emissions in 2022 are 3268.14 Gg
CO2 / year which is 4.9% of M.0.EL emissions. 2022 Emissions have
changed by -3.5% (-119.48 Gg CO2 /
year). 1990-2022 Emissions have changed by -2.9% (-80.46 Gg CO2 / year). For 2022 the
changes per gas
are:

For 1990-2022 the changes per gas are: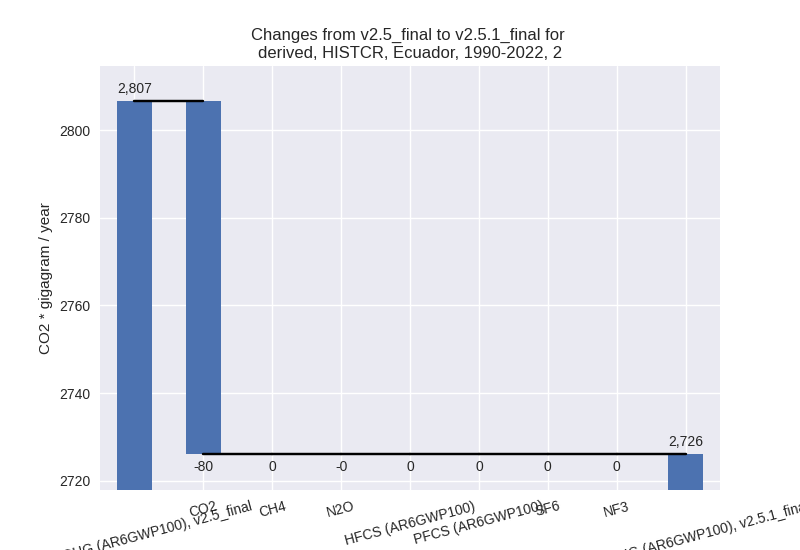
- M.AG: Total sectoral emissions in 2022 are 16755.39
Gg CO2 / year which is 25.2% of M.0.EL emissions. 2022 Emissions have
changed by -2.8% (-487.87 Gg CO2 /
year). 1990-2022 Emissions have changed by -0.2% (-28.98 Gg CO2 / year). For 2022 the
changes per gas
are:
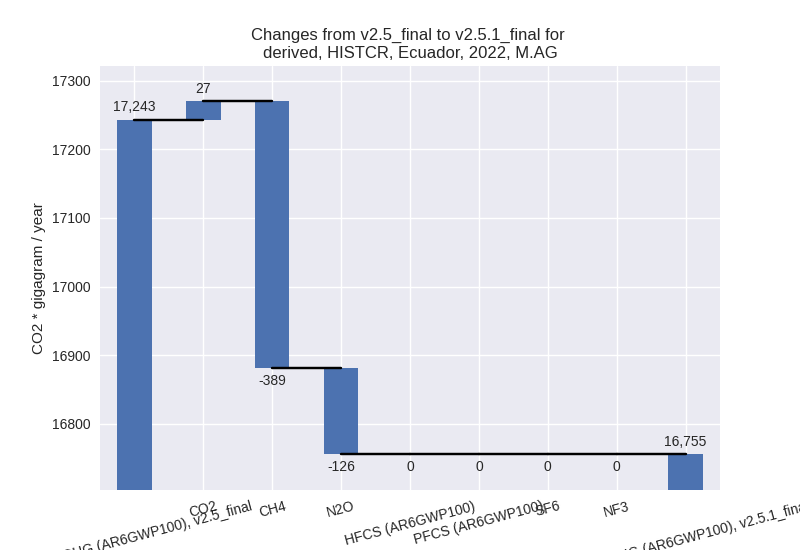
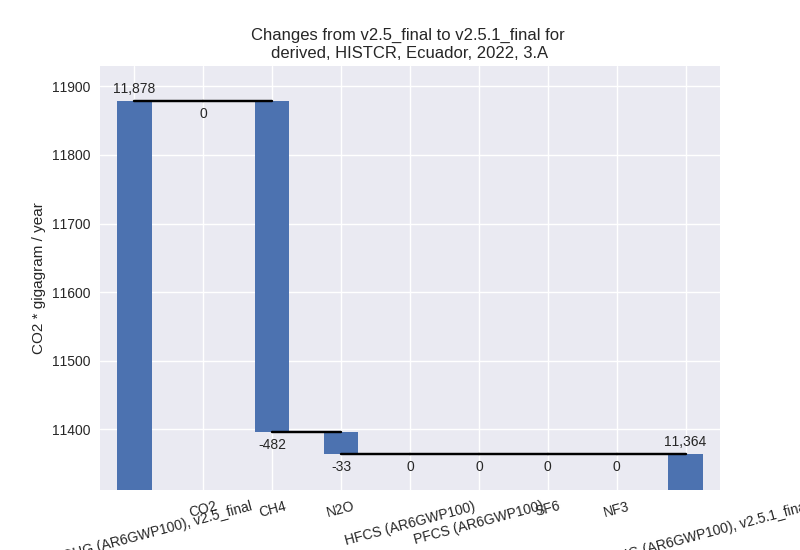
The changes come from the following subsectors:- 3.A: Total sectoral emissions in 2022 are 11363.88
Gg CO2 / year which is 67.8% of category M.AG emissions. 2022 Emissions
have changed by -4.3% (-514.38 Gg
CO2 / year). 1990-2022 Emissions have changed by -0.3% (-29.72 Gg CO2 / year). For 2022 the
changes per gas
are:
There is no subsector information available in PRIMAP-hist. - M.AG.ELV: Total sectoral emissions in 2022 are 5391.50 Gg CO2 / year which is 32.2% of category M.AG emissions. 2022 Emissions have changed by 0.5% (26.51 Gg CO2 / year). 1990-2022 Emissions have changed by 0.0% (0.74 Gg CO2 / year).
- 3.A: Total sectoral emissions in 2022 are 11363.88
Gg CO2 / year which is 67.8% of category M.AG emissions. 2022 Emissions
have changed by -4.3% (-514.38 Gg
CO2 / year). 1990-2022 Emissions have changed by -0.3% (-29.72 Gg CO2 / year). For 2022 the
changes per gas
are:
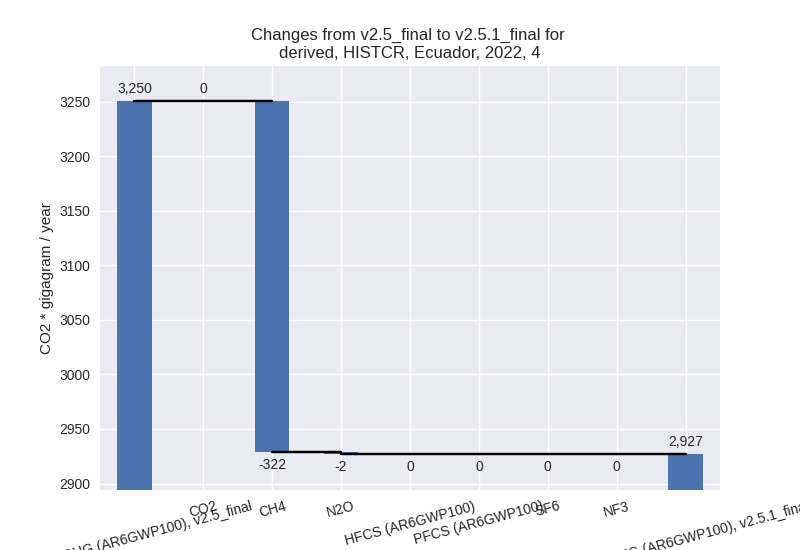
- 4: Total sectoral emissions in 2022 are 2926.89 Gg
CO2 / year which is 4.4% of M.0.EL emissions. 2022 Emissions have
changed by -10.0% (-323.51 Gg CO2 /
year). 1990-2022 Emissions have changed by -0.6% (-9.80 Gg CO2 / year). For 2022 the
changes per gas
are:
- 5: Total sectoral emissions in 2022 are 537.47 Gg
CO2 / year which is 0.8% of M.0.EL emissions. 2022 Emissions have
changed by 18.6% (84.45 Gg CO2 /
year). 1990-2022 Emissions have changed by 0.9% (2.56 Gg CO2 / year). For 2022 the
changes per gas
are:

third party scenario (HISTTP):
Most important changes per time frame
For 2022 the following sector-gas combinations have the highest absolute impact on national total KyotoGHG (AR6GWP100) emissions in 2022 (top 5):
- 1: 1.B.2, CH4 with -2442.10 Gg CO2 / year (-25.0%)
- 2: 1.A, CO2 with -1861.00 Gg CO2 / year (-4.6%)
- 3: 1.B.2, CO2 with 747.03 Gg CO2 / year (30.2%)
- 4: M.AG.ELV, CH4 with 363.89 Gg CO2 / year (20.3%)
- 5: 3.A, CH4 with 202.88 Gg CO2 / year (2.9%)
For 1990-2022 the following sector-gas combinations have the highest absolute impact on national total KyotoGHG (AR6GWP100) emissions in 1990-2022 (top 5):
- 1: 1.A, CO2 with -361.82 Gg CO2 / year (-1.3%)
- 2: 1.B.2, CH4 with -248.66 Gg CO2 / year (-3.6%)
- 3: 2, CO2 with -79.95 Gg CO2 / year (-4.3%)
- 4: M.AG.ELV, CO2 with 24.70 Gg CO2 / year (11.3%)
- 5: M.AG.ELV, CH4 with 17.91 Gg CO2 / year (0.8%)
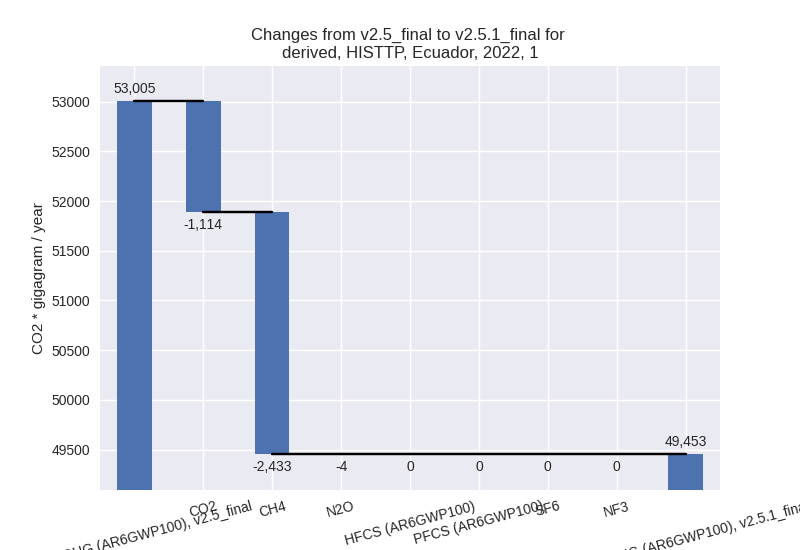
Changes in the main sectors for aggregate KyotoGHG (AR6GWP100) are
- 1: Total sectoral emissions in 2022 are 49453.11 Gg
CO2 / year which is 67.2% of M.0.EL emissions. 2022 Emissions have
changed by -6.7% (-3551.54 Gg CO2 /
year). 1990-2022 Emissions have changed by -1.6% (-596.73 Gg CO2 / year). For 2022
the changes per gas
are:
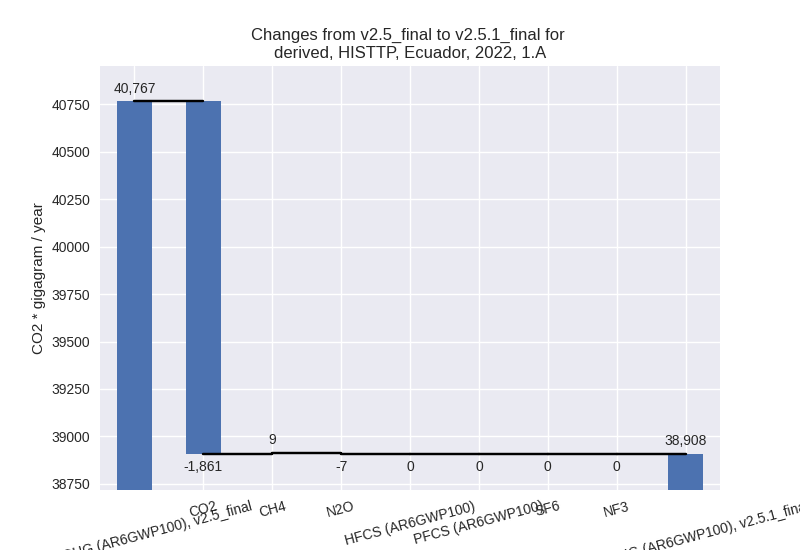
The changes come from the following subsectors:- 1.A: Total sectoral emissions in 2022 are 38907.62
Gg CO2 / year which is 78.7% of category 1 emissions. 2022 Emissions
have changed by -4.6% (-1859.18 Gg
CO2 / year). 1990-2022 Emissions have changed by -1.3% (-361.55 Gg CO2 / year). For 2022
the changes per gas
are:
There is no subsector information available in PRIMAP-hist. - 1.B.2: Total sectoral emissions in 2022 are
10545.49 Gg CO2 / year which is 21.3% of category 1 emissions. 2022
Emissions have changed by -13.8%
(-1692.36 Gg CO2 / year). 1990-2022 Emissions have changed by -2.4% (-235.18 Gg CO2 / year). For 2022
the changes per gas
are:
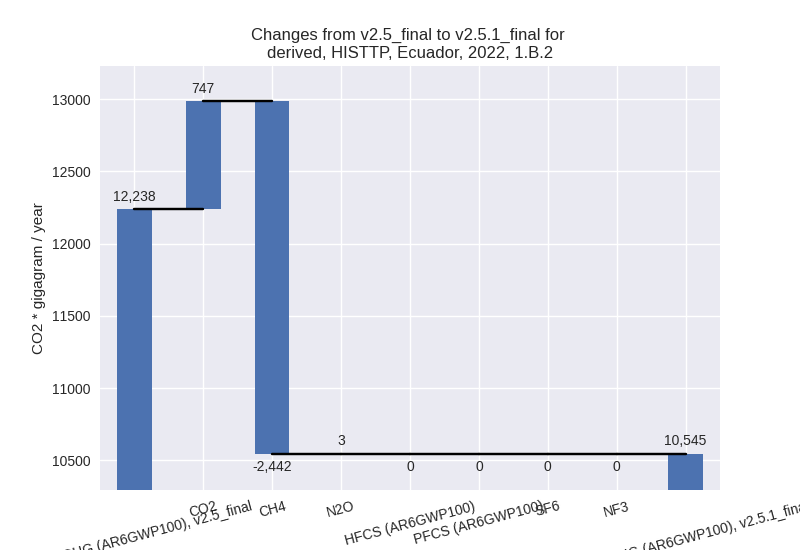
For 1990-2022 the changes per gas are: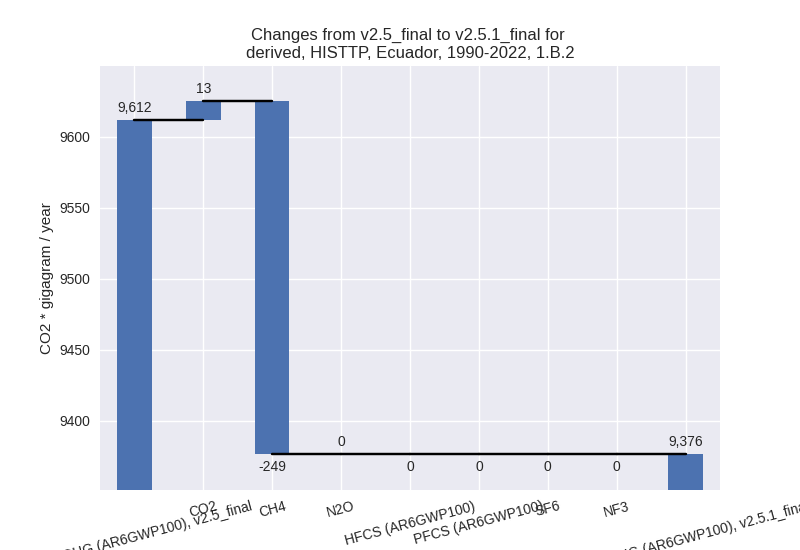
There is no subsector information available in PRIMAP-hist.
- 1.A: Total sectoral emissions in 2022 are 38907.62
Gg CO2 / year which is 78.7% of category 1 emissions. 2022 Emissions
have changed by -4.6% (-1859.18 Gg
CO2 / year). 1990-2022 Emissions have changed by -1.3% (-361.55 Gg CO2 / year). For 2022
the changes per gas
are:
- 2: Total sectoral emissions in 2022 are 3186.74 Gg
CO2 / year which is 4.3% of M.0.EL emissions. 2022 Emissions have
changed by -3.1% (-102.54 Gg CO2 /
year). 1990-2022 Emissions have changed by -3.7% (-79.95 Gg CO2 / year). For 2022 the
changes per gas
are:

For 1990-2022 the changes per gas are:
- M.AG: Total sectoral emissions in 2022 are 14025.79
Gg CO2 / year which is 19.1% of M.0.EL emissions. 2022 Emissions have
changed by 5.0% (667.54 Gg CO2 /
year). 1990-2022 Emissions have changed by 0.2% (32.94 Gg CO2 / year). For 2022 the
changes per gas
are:

The changes come from the following subsectors:- 3.A: Total sectoral emissions in 2022 are 7453.16
Gg CO2 / year which is 53.1% of category M.AG emissions. 2022 Emissions
have changed by 2.6% (186.99 Gg CO2
/ year). 1990-2022 Emissions have changed by -0.0% (-3.59 Gg CO2 / year). For 2022 the
changes per gas
are:

There is no subsector information available in PRIMAP-hist. - M.AG.ELV: Total sectoral emissions in 2022 are
6572.62 Gg CO2 / year which is 46.9% of category M.AG emissions. 2022
Emissions have changed by 7.9%
(480.55 Gg CO2 / year). 1990-2022 Emissions have changed by 0.6% (36.54 Gg CO2 / year). For 2022 the
changes per gas
are:
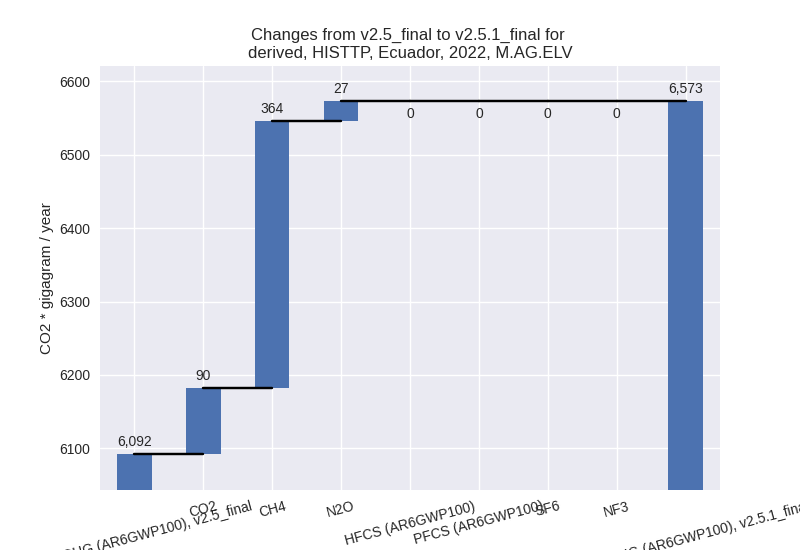
There is no subsector information available in PRIMAP-hist.
- 3.A: Total sectoral emissions in 2022 are 7453.16
Gg CO2 / year which is 53.1% of category M.AG emissions. 2022 Emissions
have changed by 2.6% (186.99 Gg CO2
/ year). 1990-2022 Emissions have changed by -0.0% (-3.59 Gg CO2 / year). For 2022 the
changes per gas
are:
- 4: Total sectoral emissions in 2022 are 6354.14 Gg CO2 / year which is 8.6% of M.0.EL emissions. 2022 Emissions have changed by -0.6% (-39.17 Gg CO2 / year). 1990-2022 Emissions have changed by -0.0% (-1.19 Gg CO2 / year).
- 5: Total sectoral emissions in 2022 are 537.47 Gg
CO2 / year which is 0.7% of M.0.EL emissions. 2022 Emissions have
changed by 18.6% (84.45 Gg CO2 /
year). 1990-2022 Emissions have changed by 0.9% (2.56 Gg CO2 / year). For 2022 the
changes per gas
are: