Changes in PRIMAP-hist v2.5.1_final compared to v2.5_final for Egypt
2024-02-29
Johannes Gütschow
Change analysis for Egypt for PRIMAP-hist v2.5.1_final compared to v2.5_final
Overview over emissions by sector and gas
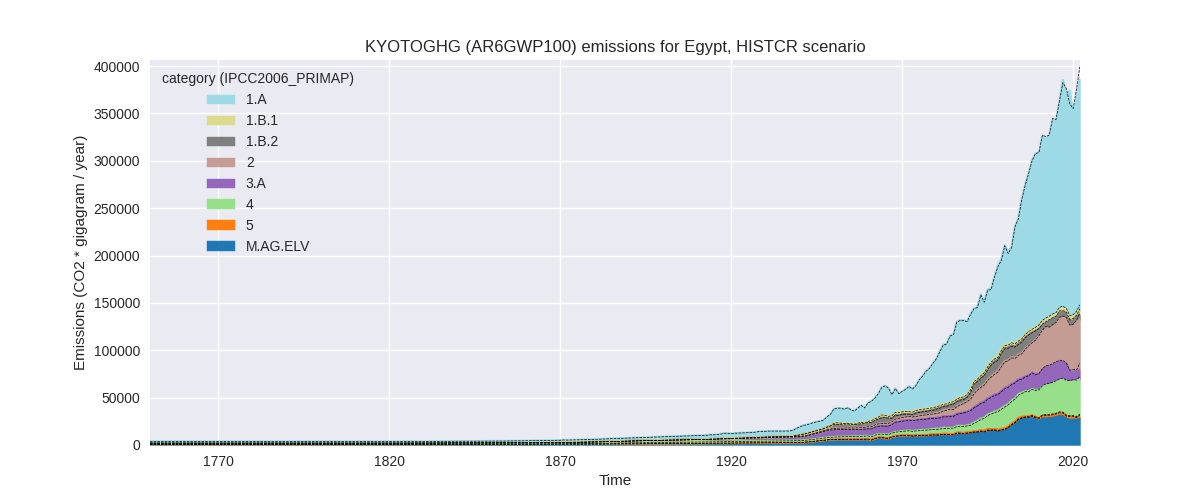
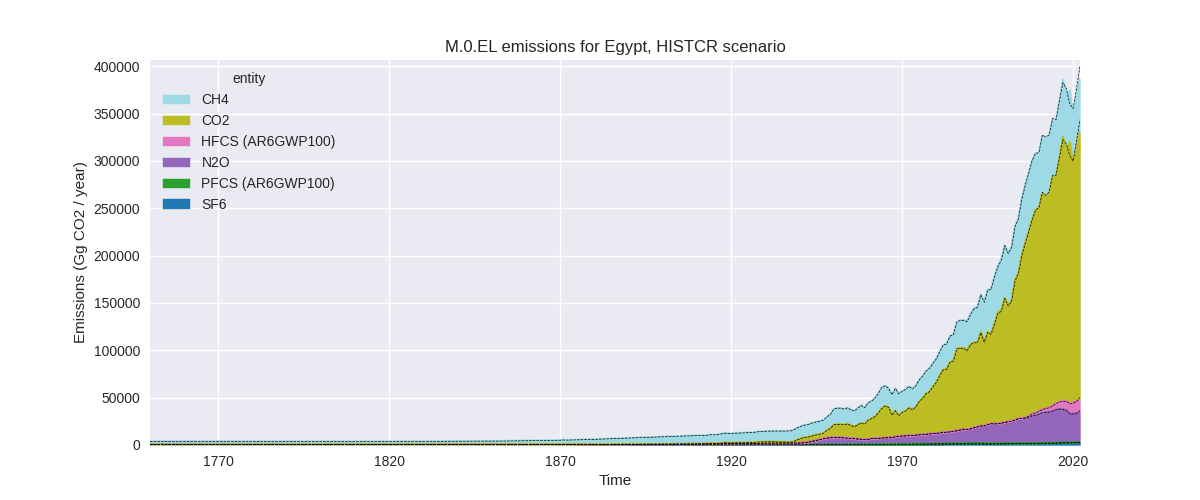
The following figures show the aggregate national total emissions excluding LULUCF AR6GWP100 for the country reported priority scenario. The dotted linesshow the v2.5_final data.

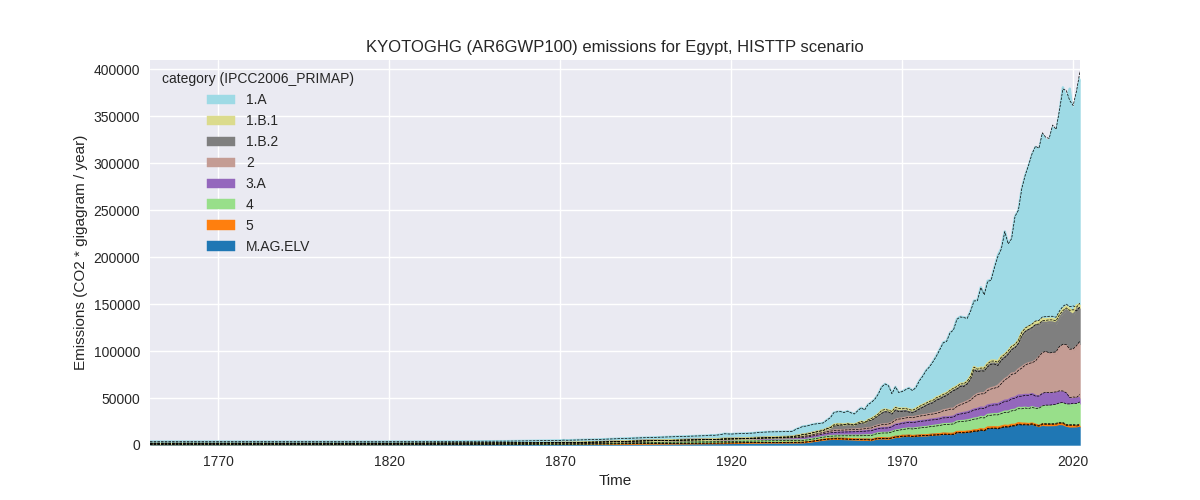
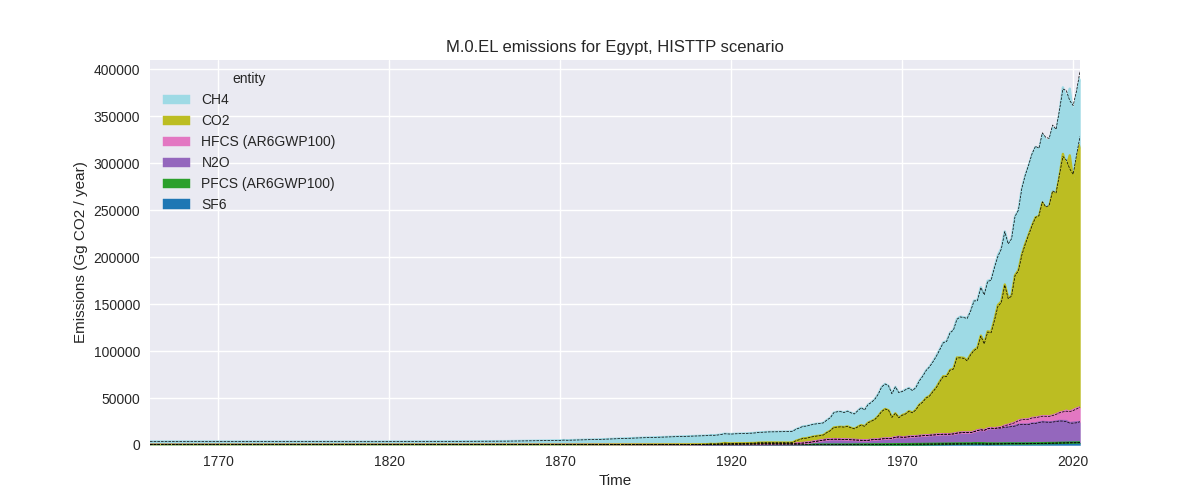
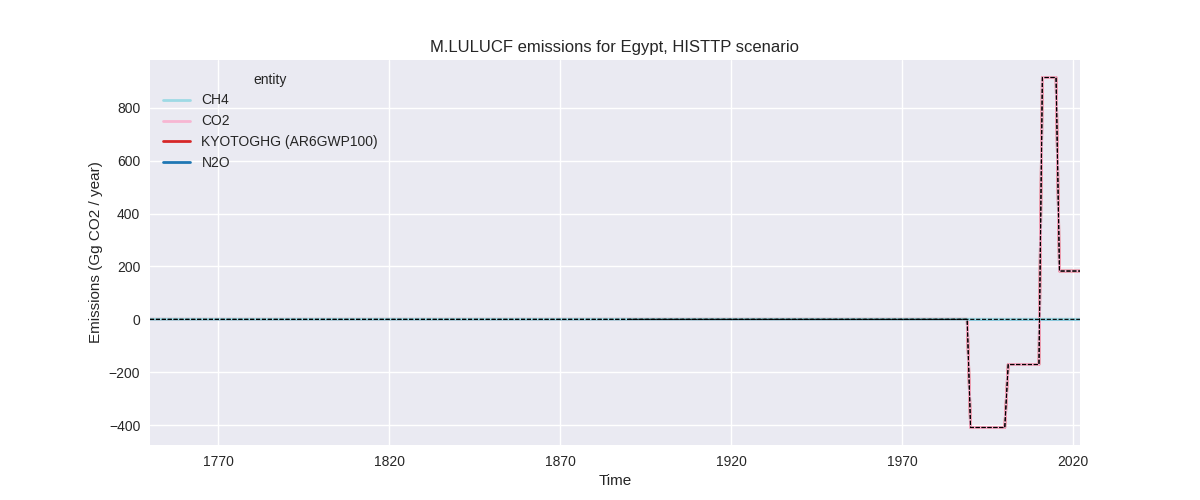
The following figures show the aggregate national total emissions excluding LULUCF AR6GWP100 for the third party priority scenario. The dotted linesshow the v2.5_final data.
Overview over changes
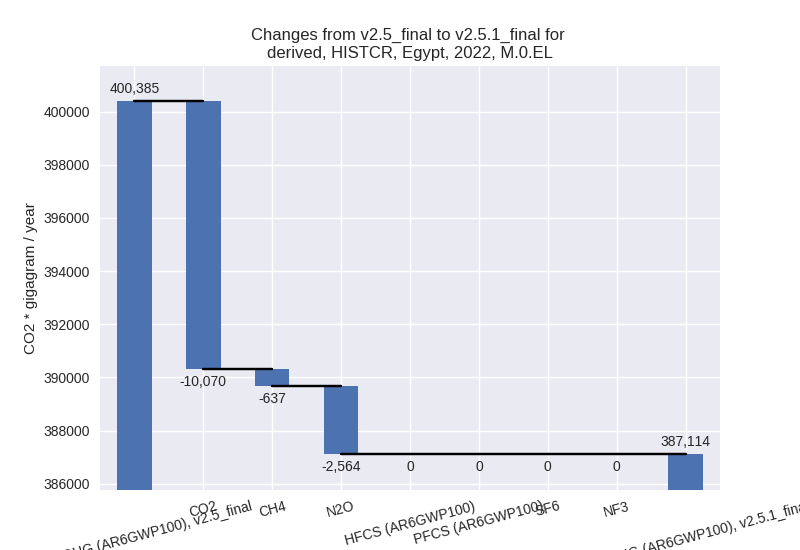
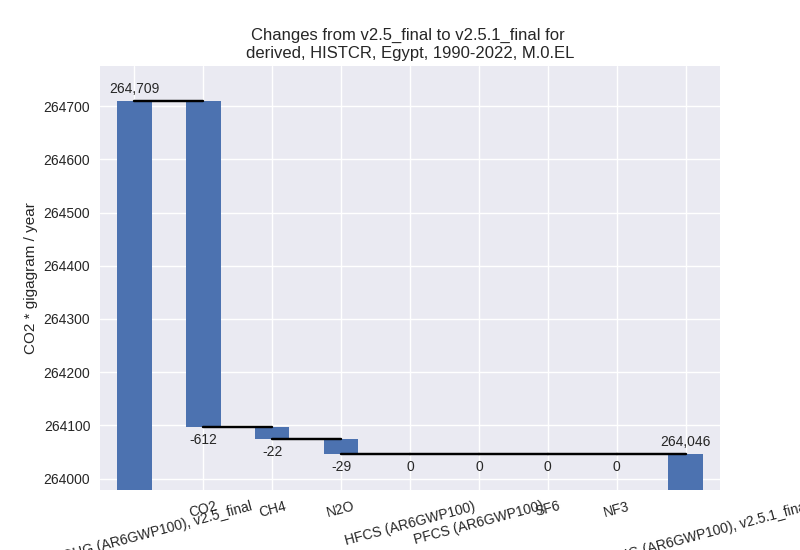
In the country reported priority scenario we have the following changes for aggregate Kyoto GHG and national total emissions excluding LULUCF (M.0.EL):
- Emissions in 2022 have changed by -3.3%% (-13271.04 Gg CO2 / year)
- Emissions in 1990-2022 have changed by -0.3%% (-663.23 Gg CO2 / year)
In the third party priority scenario we have the following changes for aggregate Kyoto GHG and national total emissions excluding LULUCF (M.0.EL):
- Emissions in 2022 have changed by -1.9%% (-7722.18 Gg CO2 / year)
- Emissions in 1990-2022 have changed by -0.4%% (-1049.21 Gg CO2 / year)
Most important changes per scenario and time frame
In the country reported priority scenario the following sector-gas combinations have the highest absolute impact on national total KyotoGHG (AR6GWP100) emissions in 2022 (top 5):
- 1: 1.A, CO2 with -7259.03 Gg CO2 / year (-2.9%)
- 2: 3.A, CH4 with -3472.67 Gg CO2 / year (-33.5%)
- 3: M.AG.ELV, CO2 with -2434.49 Gg CO2 / year (-45.0%)
- 4: M.AG.ELV, N2O with -1986.60 Gg CO2 / year (-9.1%)
- 5: M.AG.ELV, CH4 with 1807.61 Gg CO2 / year (41.7%)
In the country reported priority scenario the following sector-gas combinations have the highest absolute impact on national total KyotoGHG (AR6GWP100) emissions in 1990-2022 (top 5):
- 1: M.AG.ELV, CO2 with -300.61 Gg CO2 / year (-10.7%)
- 2: 1.A, CO2 with -177.08 Gg CO2 / year (-0.1%)
- 3: 3.A, CH4 with -132.89 Gg CO2 / year (-1.1%)
- 4: 1.B.1, CO2 with -71.42 Gg CO2 / year (-74.7%)
- 5: 2, CO2 with -62.74 Gg CO2 / year (-0.3%)
In the third party priority scenario the following sector-gas combinations have the highest absolute impact on national total KyotoGHG (AR6GWP100) emissions in 2022 (top 5):
- 1: 1.A, CO2 with -7082.65 Gg CO2 / year (-2.9%)
- 2: M.AG.ELV, CO2 with -2434.49 Gg CO2 / year (-45.0%)
- 3: 1.B.2, CH4 with 2126.69 Gg CO2 / year (6.7%)
- 4: 3.A, CH4 with -2042.54 Gg CO2 / year (-26.2%)
- 5: M.AG.ELV, CH4 with 1037.06 Gg CO2 / year (28.9%)
In the third party priority scenario the following sector-gas combinations have the highest absolute impact on national total KyotoGHG (AR6GWP100) emissions in 1990-2022 (top 5):
- 1: 1.B.2, CH4 with -651.48 Gg CO2 / year (-2.3%)
- 2: M.AG.ELV, CO2 with -300.61 Gg CO2 / year (-10.7%)
- 3: 1.A, CO2 with -172.77 Gg CO2 / year (-0.1%)
- 4: 2, CO2 with 150.91 Gg CO2 / year (0.7%)
- 5: 3.A, CH4 with -84.98 Gg CO2 / year (-0.8%)
Notes on data changes
No country specific notes present for this changelog.
Changes by sector and gas
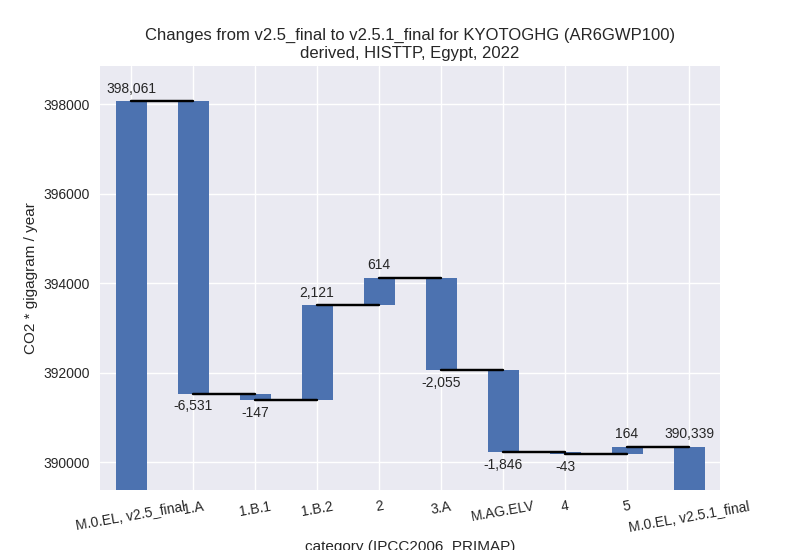
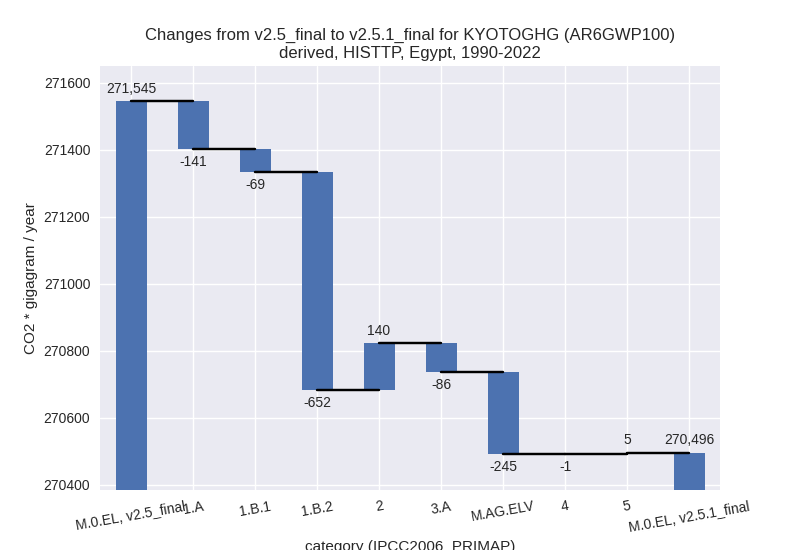
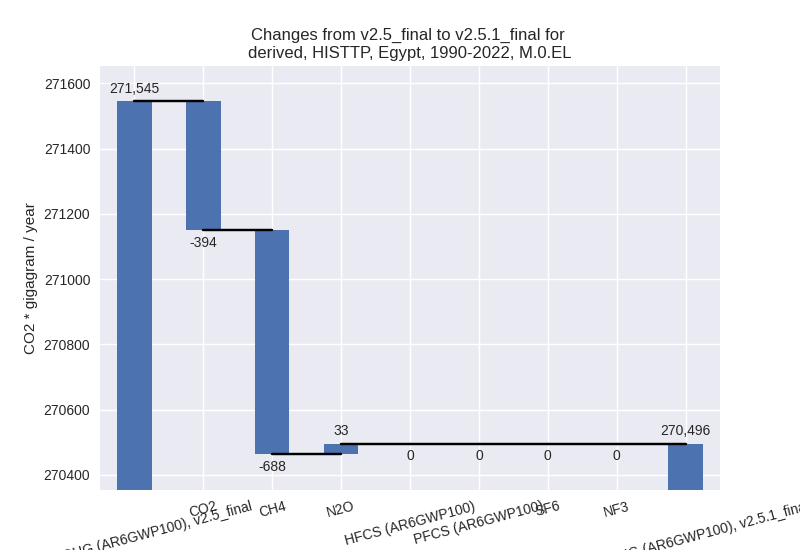
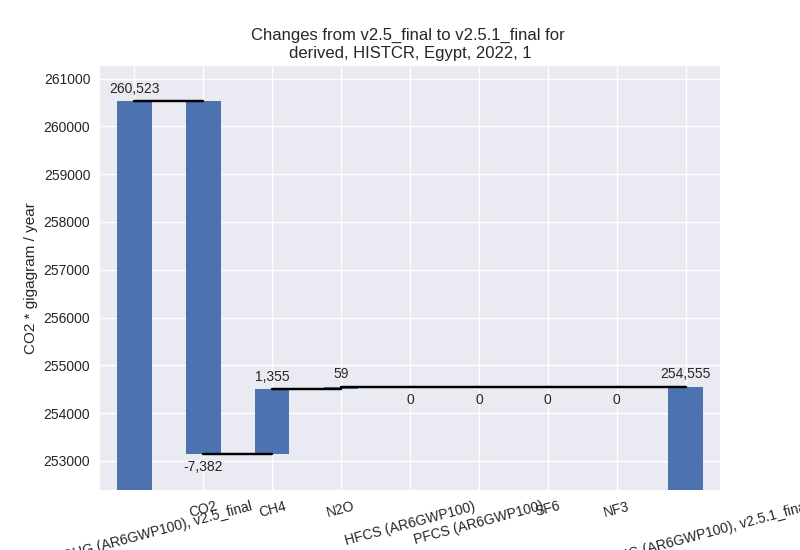
For each scenario and time frame the changes are displayed for all individual sectors and all individual gases. In the sector plot we use aggregate Kyoto GHGs in AR6GWP100. In the gas plot we usenational total emissions without LULUCF. ## country reported scenario
2022
1990-2022

third party scenario
2022

1990-2022
Detailed changes for the scenarios:
country reported scenario (HISTCR):
Most important changes per time frame
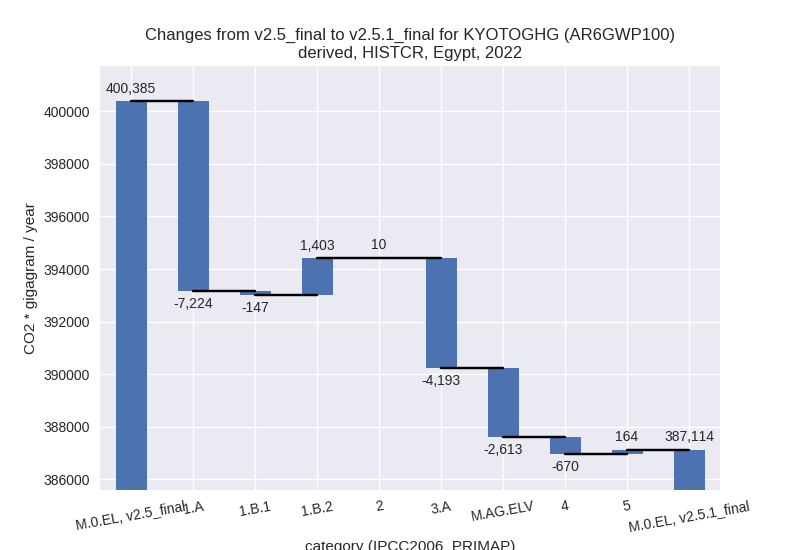
For 2022 the following sector-gas combinations have the highest absolute impact on national total KyotoGHG (AR6GWP100) emissions in 2022 (top 5):
- 1: 1.A, CO2 with -7259.03 Gg CO2 / year (-2.9%)
- 2: 3.A, CH4 with -3472.67 Gg CO2 / year (-33.5%)
- 3: M.AG.ELV, CO2 with -2434.49 Gg CO2 / year (-45.0%)
- 4: M.AG.ELV, N2O with -1986.60 Gg CO2 / year (-9.1%)
- 5: M.AG.ELV, CH4 with 1807.61 Gg CO2 / year (41.7%)
For 1990-2022 the following sector-gas combinations have the highest absolute impact on national total KyotoGHG (AR6GWP100) emissions in 1990-2022 (top 5):
- 1: M.AG.ELV, CO2 with -300.61 Gg CO2 / year (-10.7%)
- 2: 1.A, CO2 with -177.08 Gg CO2 / year (-0.1%)
- 3: 3.A, CH4 with -132.89 Gg CO2 / year (-1.1%)
- 4: 1.B.1, CO2 with -71.42 Gg CO2 / year (-74.7%)
- 5: 2, CO2 with -62.74 Gg CO2 / year (-0.3%)
Changes in the main sectors for aggregate KyotoGHG (AR6GWP100) are
- 1: Total sectoral emissions in 2022 are 254554.76
Gg CO2 / year which is 65.8% of M.0.EL emissions. 2022 Emissions have
changed by -2.3% (-5968.49 Gg CO2 /
year). 1990-2022 Emissions have changed by -0.1% (-181.74 Gg CO2 / year). For 2022
the changes per gas
are:
The changes come from the following subsectors:- 1.A: Total sectoral emissions in 2022 are 245164.88
Gg CO2 / year which is 96.3% of category 1 emissions. 2022 Emissions
have changed by -2.9% (-7224.34 Gg
CO2 / year). 1990-2022 Emissions have changed by -0.1% (-166.80 Gg CO2 / year). For 2022
the changes per gas
are:

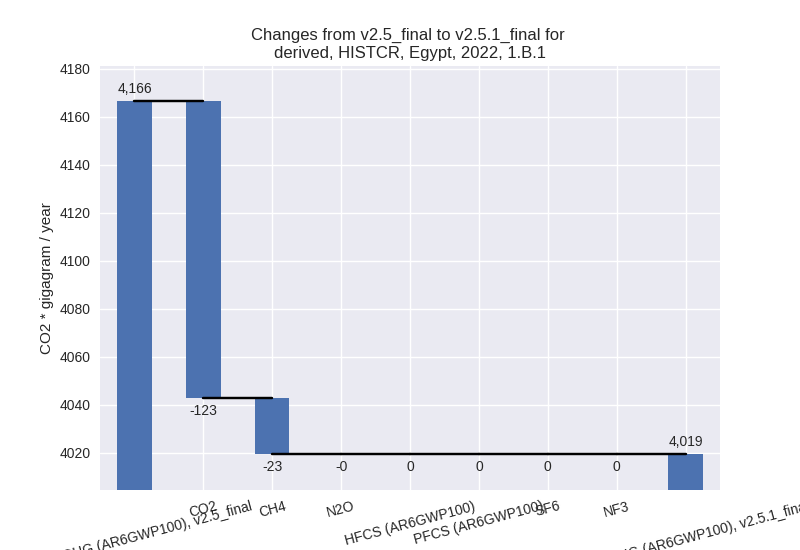
There is no subsector information available in PRIMAP-hist. - 1.B.1: Total sectoral emissions in 2022 are 4019.48
Gg CO2 / year which is 1.6% of category 1 emissions. 2022 Emissions have
changed by -3.5% (-146.89 Gg CO2 /
year). 1990-2022 Emissions have changed by -1.9% (-69.19 Gg CO2 / year). For 2022 the
changes per gas
are:
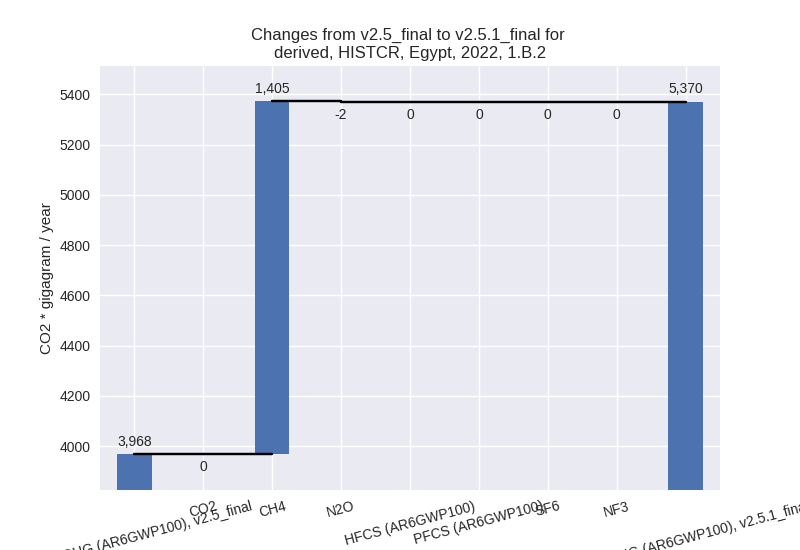
There is no subsector information available in PRIMAP-hist. - 1.B.2: Total sectoral emissions in 2022 are 5370.40
Gg CO2 / year which is 2.1% of category 1 emissions. 2022 Emissions have
changed by 35.4% (1402.74 Gg CO2 /
year). 1990-2022 Emissions have changed by 0.6% (54.25 Gg CO2 / year). For 2022 the
changes per gas
are:
There is no subsector information available in PRIMAP-hist.
- 1.A: Total sectoral emissions in 2022 are 245164.88
Gg CO2 / year which is 96.3% of category 1 emissions. 2022 Emissions
have changed by -2.9% (-7224.34 Gg
CO2 / year). 1990-2022 Emissions have changed by -0.1% (-166.80 Gg CO2 / year). For 2022
the changes per gas
are:
- 2: Total sectoral emissions in 2022 are 53166.87 Gg CO2 / year which is 13.7% of M.0.EL emissions. 2022 Emissions have changed by 0.0% (10.32 Gg CO2 / year). 1990-2022 Emissions have changed by -0.2% (-53.35 Gg CO2 / year).
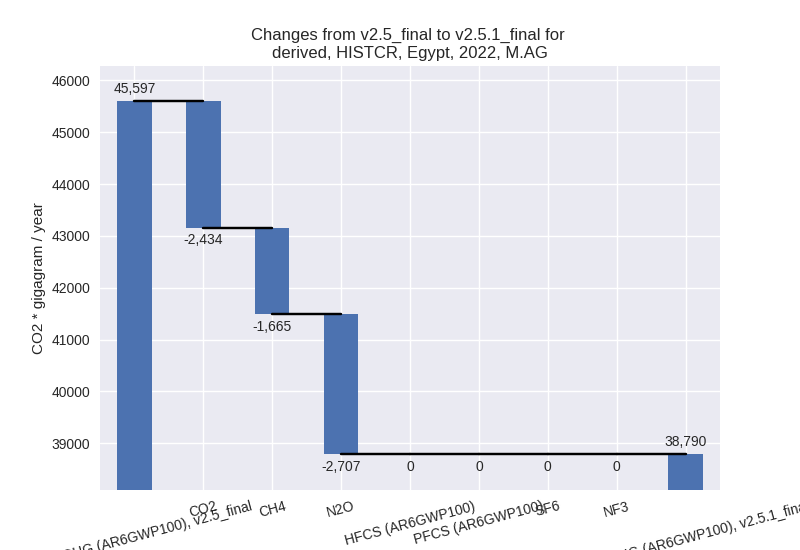
- M.AG: Total sectoral emissions in 2022 are 38790.31
Gg CO2 / year which is 10.0% of M.0.EL emissions. 2022 Emissions have
changed by -14.9% (-6806.38 Gg CO2 /
year). 1990-2022 Emissions have changed by -1.0% (-412.79 Gg CO2 / year). For 2022
the changes per gas
are:
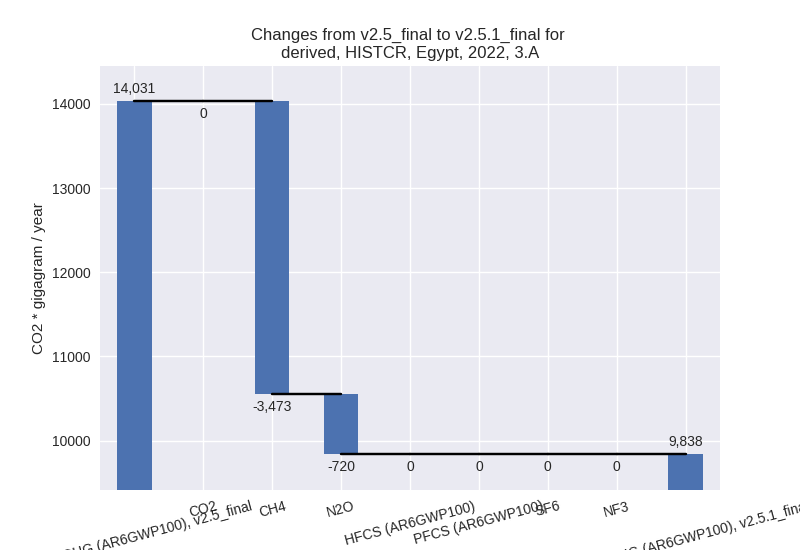
The changes come from the following subsectors:- 3.A: Total sectoral emissions in 2022 are 9838.08
Gg CO2 / year which is 25.4% of category M.AG emissions. 2022 Emissions
have changed by -29.9% (-4192.89 Gg
CO2 / year). 1990-2022 Emissions have changed by -1.0% (-167.42 Gg CO2 / year). For 2022
the changes per gas
are:
There is no subsector information available in PRIMAP-hist. - M.AG.ELV: Total sectoral emissions in 2022 are
28952.23 Gg CO2 / year which is 74.6% of category M.AG emissions. 2022
Emissions have changed by -8.3%
(-2613.49 Gg CO2 / year). 1990-2022 Emissions have changed by -1.0% (-245.37 Gg CO2 / year). For 2022
the changes per gas
are:
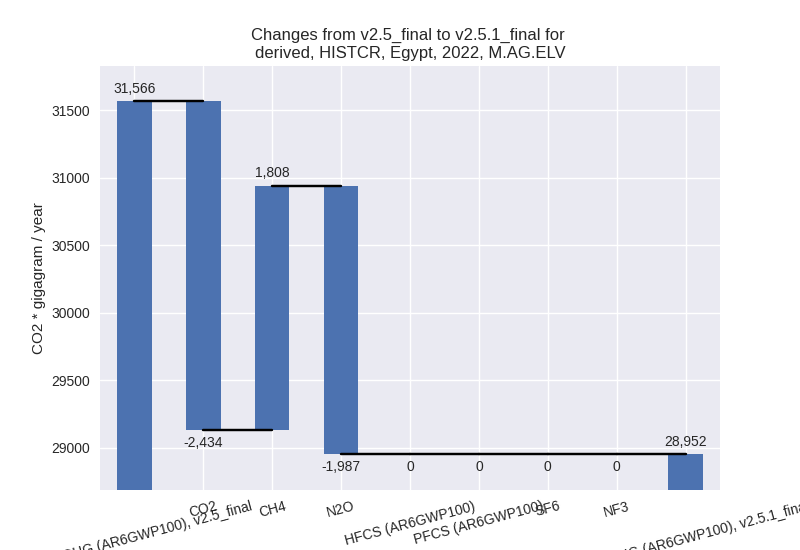
There is no subsector information available in PRIMAP-hist.
- 3.A: Total sectoral emissions in 2022 are 9838.08
Gg CO2 / year which is 25.4% of category M.AG emissions. 2022 Emissions
have changed by -29.9% (-4192.89 Gg
CO2 / year). 1990-2022 Emissions have changed by -1.0% (-167.42 Gg CO2 / year). For 2022
the changes per gas
are:
- 4: Total sectoral emissions in 2022 are 39355.87 Gg CO2 / year which is 10.2% of M.0.EL emissions. 2022 Emissions have changed by -1.7% (-670.35 Gg CO2 / year). 1990-2022 Emissions have changed by -0.1% (-20.31 Gg CO2 / year).
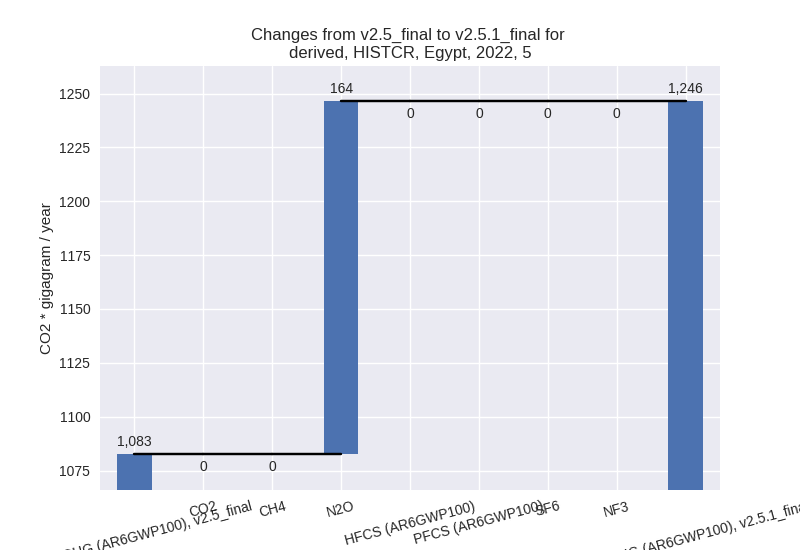
- 5: Total sectoral emissions in 2022 are 1246.44 Gg
CO2 / year which is 0.3% of M.0.EL emissions. 2022 Emissions have
changed by 15.1% (163.87 Gg CO2 /
year). 1990-2022 Emissions have changed by 0.7% (4.97 Gg CO2 / year). For 2022 the
changes per gas
are:
third party scenario (HISTTP):
Most important changes per time frame
For 2022 the following sector-gas combinations have the highest absolute impact on national total KyotoGHG (AR6GWP100) emissions in 2022 (top 5):
- 1: 1.A, CO2 with -7082.65 Gg CO2 / year (-2.9%)
- 2: M.AG.ELV, CO2 with -2434.49 Gg CO2 / year (-45.0%)
- 3: 1.B.2, CH4 with 2126.69 Gg CO2 / year (6.7%)
- 4: 3.A, CH4 with -2042.54 Gg CO2 / year (-26.2%)
- 5: M.AG.ELV, CH4 with 1037.06 Gg CO2 / year (28.9%)
For 1990-2022 the following sector-gas combinations have the highest absolute impact on national total KyotoGHG (AR6GWP100) emissions in 1990-2022 (top 5):
- 1: 1.B.2, CH4 with -651.48 Gg CO2 / year (-2.3%)
- 2: M.AG.ELV, CO2 with -300.61 Gg CO2 / year (-10.7%)
- 3: 1.A, CO2 with -172.77 Gg CO2 / year (-0.1%)
- 4: 2, CO2 with 150.91 Gg CO2 / year (0.7%)
- 5: 3.A, CH4 with -84.98 Gg CO2 / year (-0.8%)
Changes in the main sectors for aggregate KyotoGHG (AR6GWP100) are
- 1: Total sectoral emissions in 2022 are 282678.77 Gg CO2 / year which is 72.4% of M.0.EL emissions. 2022 Emissions have changed by -1.6% (-4556.36 Gg CO2 / year). 1990-2022 Emissions have changed by -0.5% (-862.16 Gg CO2 / year).
- 2: Total sectoral emissions in 2022 are 57666.01 Gg CO2 / year which is 14.8% of M.0.EL emissions. 2022 Emissions have changed by 1.1% (614.46 Gg CO2 / year). 1990-2022 Emissions have changed by 0.4% (140.02 Gg CO2 / year).
- M.AG: Total sectoral emissions in 2022 are 25405.27
Gg CO2 / year which is 6.5% of M.0.EL emissions. 2022 Emissions have
changed by -13.3% (-3901.04 Gg CO2 /
year). 1990-2022 Emissions have changed by -1.1% (-330.73 Gg CO2 / year). For 2022
the changes per gas
are:

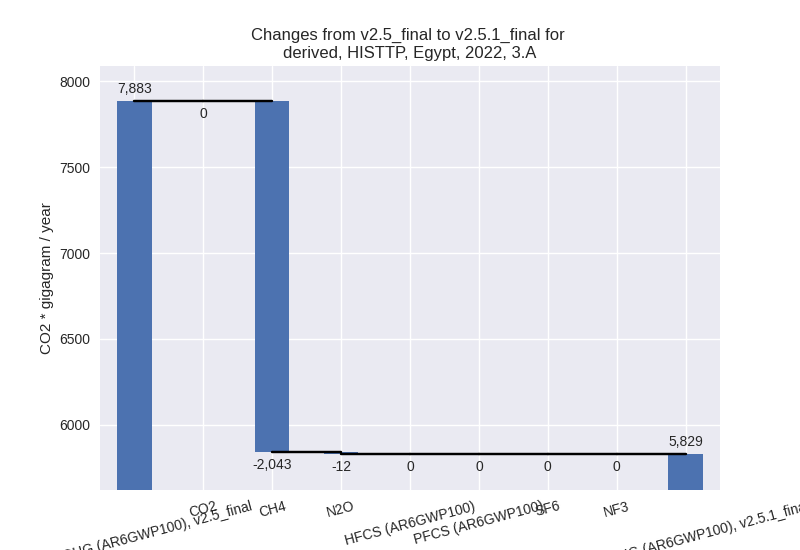
The changes come from the following subsectors:- 3.A: Total sectoral emissions in 2022 are 5828.71
Gg CO2 / year which is 22.9% of category M.AG emissions. 2022 Emissions
have changed by -26.1% (-2054.59 Gg
CO2 / year). 1990-2022 Emissions have changed by -0.8% (-85.64 Gg CO2 / year). For 2022 the
changes per gas
are:
There is no subsector information available in PRIMAP-hist. - M.AG.ELV: Total sectoral emissions in 2022 are
19576.56 Gg CO2 / year which is 77.1% of category M.AG emissions. 2022
Emissions have changed by -8.6%
(-1846.45 Gg CO2 / year). 1990-2022 Emissions have changed by -1.2% (-245.09 Gg CO2 / year). For 2022
the changes per gas
are:
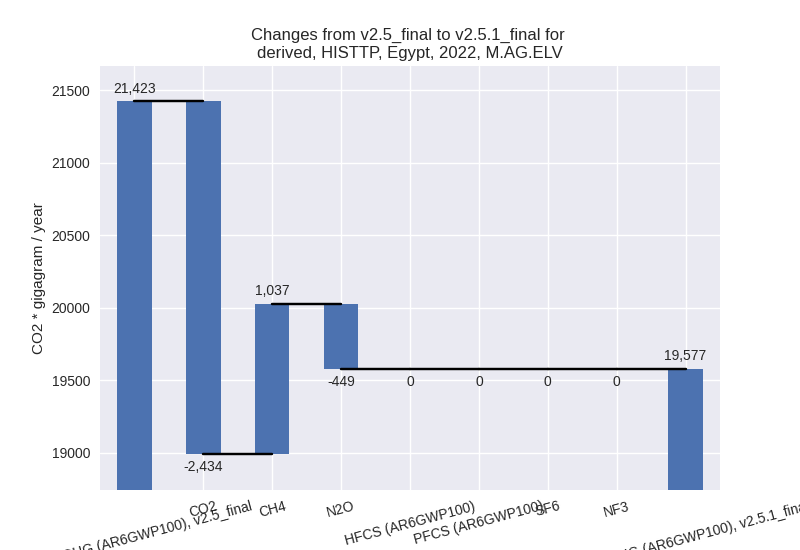
There is no subsector information available in PRIMAP-hist.
- 3.A: Total sectoral emissions in 2022 are 5828.71
Gg CO2 / year which is 22.9% of category M.AG emissions. 2022 Emissions
have changed by -26.1% (-2054.59 Gg
CO2 / year). 1990-2022 Emissions have changed by -0.8% (-85.64 Gg CO2 / year). For 2022 the
changes per gas
are:
- 4: Total sectoral emissions in 2022 are 23342.49 Gg CO2 / year which is 6.0% of M.0.EL emissions. 2022 Emissions have changed by -0.2% (-43.10 Gg CO2 / year). 1990-2022 Emissions have changed by -0.0% (-1.31 Gg CO2 / year).
- 5: Total sectoral emissions in 2022 are 1246.44 Gg
CO2 / year which is 0.3% of M.0.EL emissions. 2022 Emissions have
changed by 15.1% (163.87 Gg CO2 /
year). 1990-2022 Emissions have changed by 0.7% (4.97 Gg CO2 / year). For 2022 the
changes per gas
are:
