Changes in PRIMAP-hist v2.5.1_final compared to v2.5_final for Estonia
2024-02-29
Johannes Gütschow
Change analysis for Estonia for PRIMAP-hist v2.5.1_final compared to v2.5_final
Overview over emissions by sector and gas
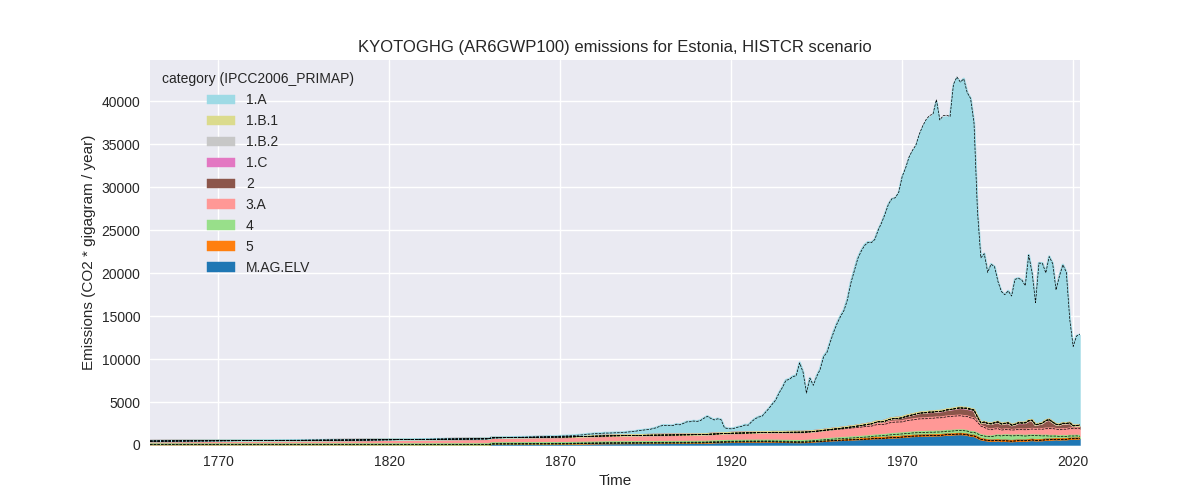
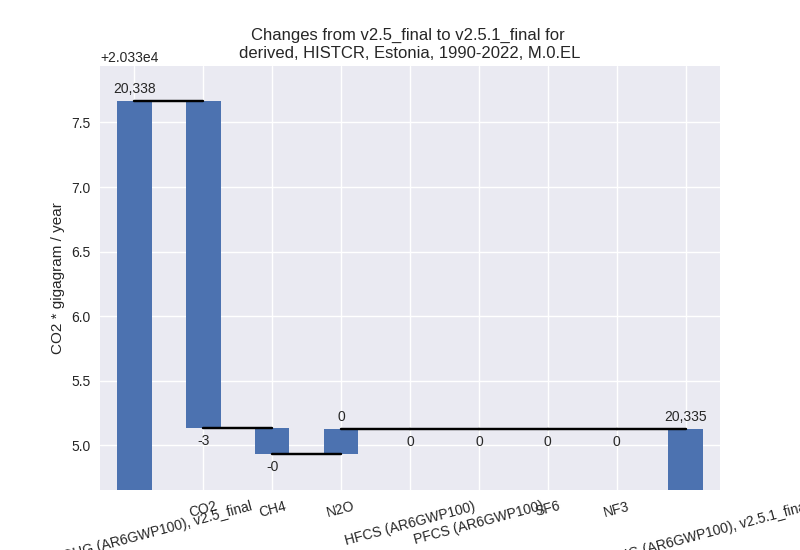
The following figures show the aggregate national total emissions excluding LULUCF AR6GWP100 for the country reported priority scenario. The dotted linesshow the v2.5_final data.


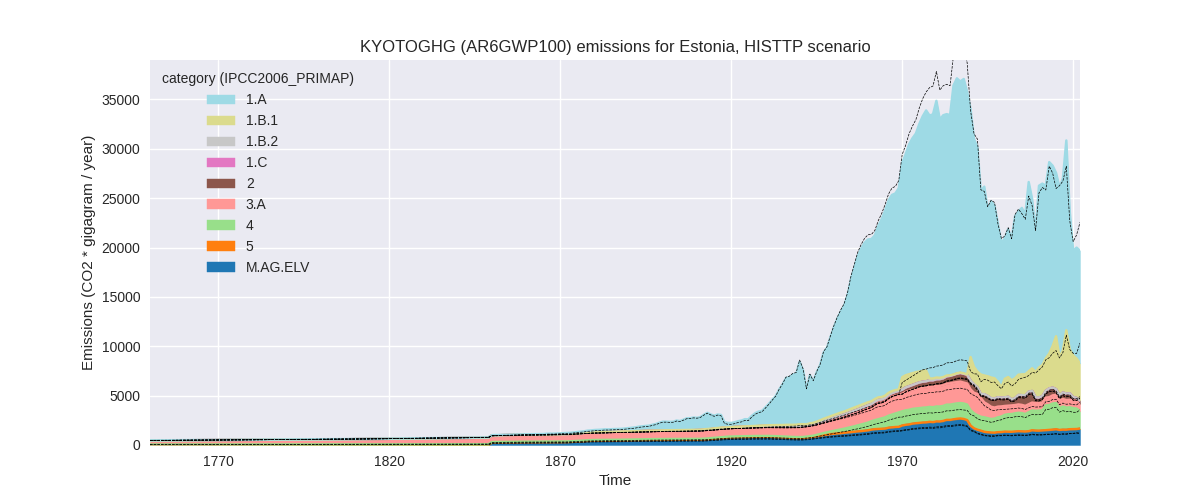
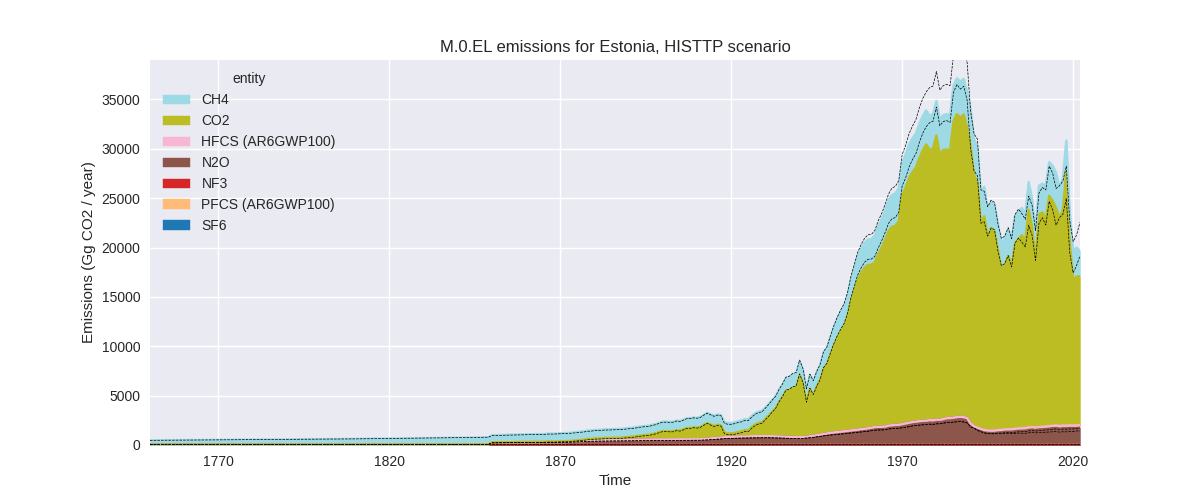
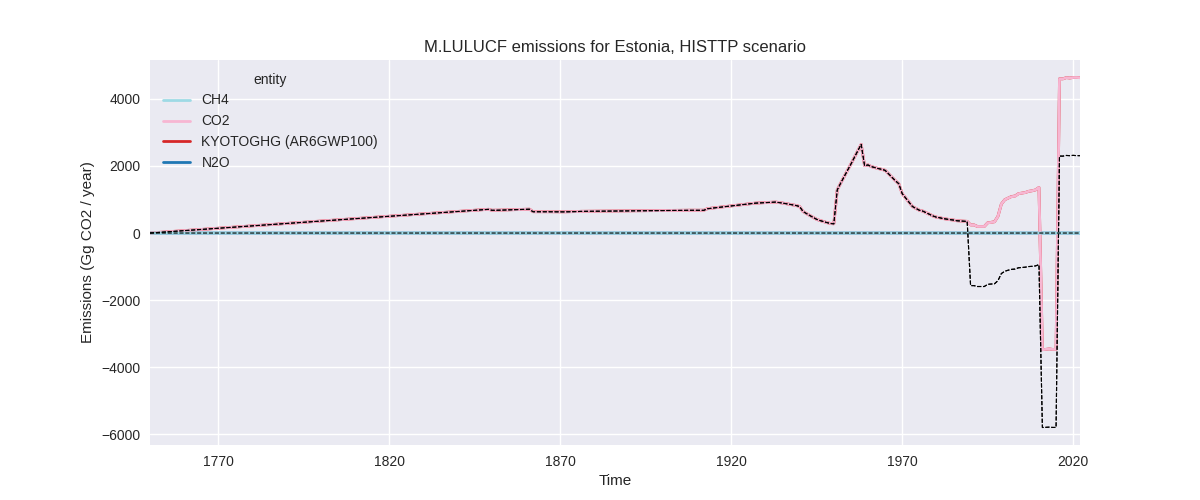
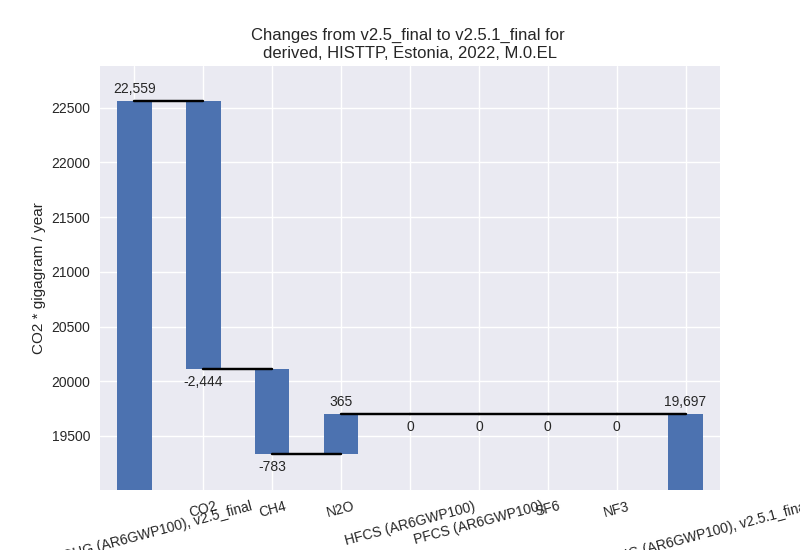
The following figures show the aggregate national total emissions excluding LULUCF AR6GWP100 for the third party priority scenario. The dotted linesshow the v2.5_final data.
Overview over changes
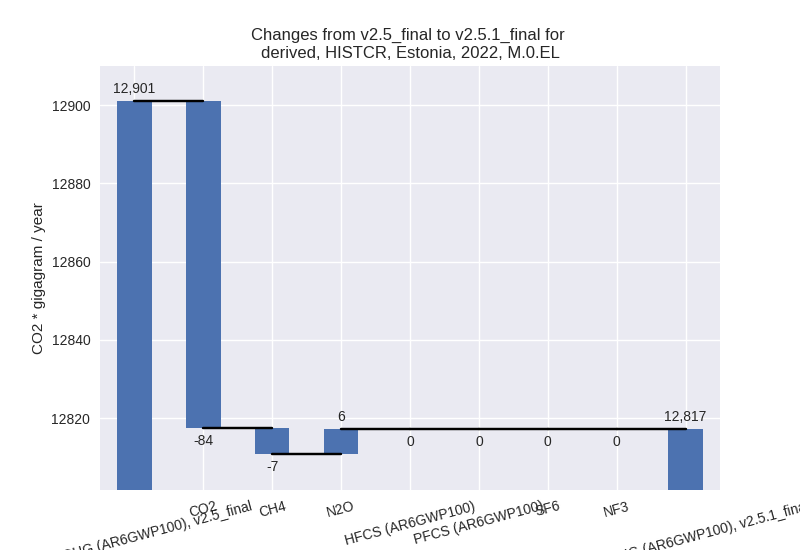
In the country reported priority scenario we have the following changes for aggregate Kyoto GHG and national total emissions excluding LULUCF (M.0.EL):
- Emissions in 2022 have changed by -0.6%% (-83.84 Gg CO2 / year)
- Emissions in 1990-2022 have changed by -0.0%% (-2.54 Gg CO2 / year)
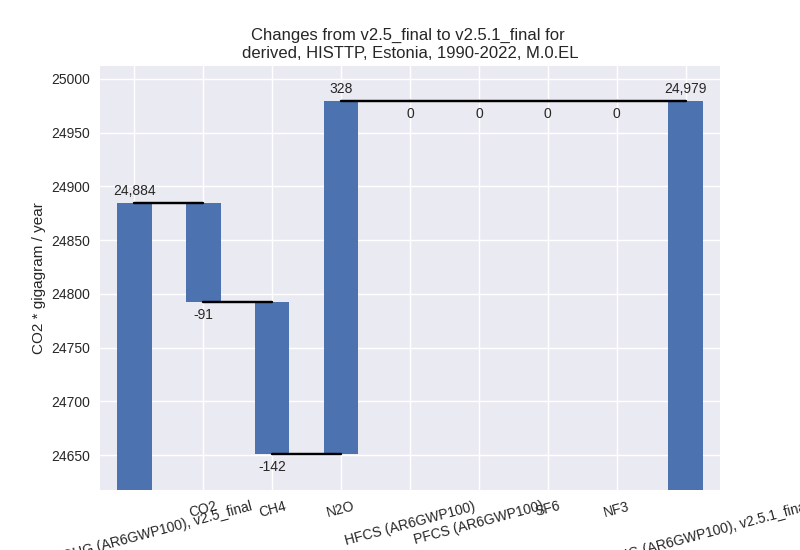
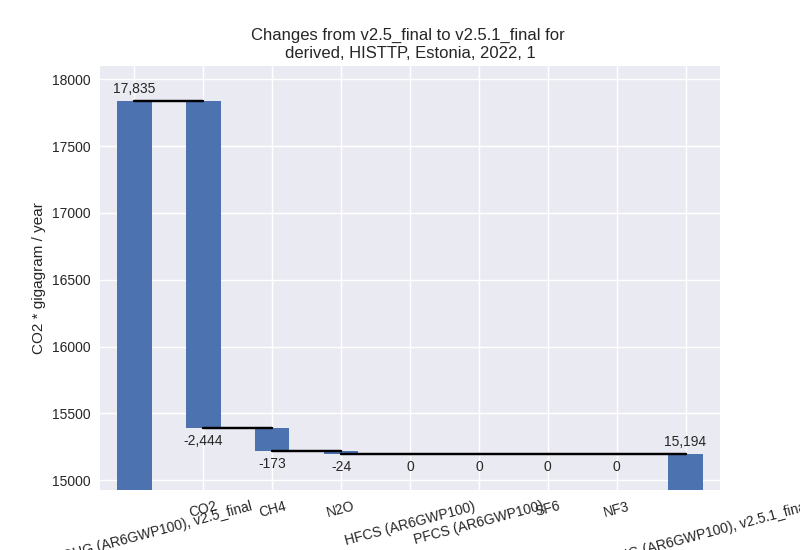
In the third party priority scenario we have the following changes for aggregate Kyoto GHG and national total emissions excluding LULUCF (M.0.EL):
- Emissions in 2022 have changed by -12.7%% (-2862.23 Gg CO2 / year)
- Emissions in 1990-2022 have changed by 0.4%% (94.94 Gg CO2 / year)
Most important changes per scenario and time frame
In the country reported priority scenario the following sector-gas combinations have the highest absolute impact on national total KyotoGHG (AR6GWP100) emissions in 2022 (top 5):
- 1: 2, CO2 with -90.02 Gg CO2 / year (-49.4%)
- 2: 3.A, CH4 with -31.60 Gg CO2 / year (-3.8%)
- 3: 4, CH4 with 14.78 Gg CO2 / year (6.7%)
- 4: M.AG.ELV, N2O with 13.43 Gg CO2 / year (1.8%)
- 5: 1.B.2, CH4 with 6.51 Gg CO2 / year (39.3%)
In the country reported priority scenario the following sector-gas combinations have the highest absolute impact on national total KyotoGHG (AR6GWP100) emissions in 1990-2022 (top 5):
- 1: 2, CO2 with -2.73 Gg CO2 / year (-0.5%)
- 2: 3.A, CH4 with -0.96 Gg CO2 / year (-0.1%)
- 3: 4, CH4 with 0.45 Gg CO2 / year (0.1%)
- 4: M.AG.ELV, N2O with 0.41 Gg CO2 / year (0.1%)
- 5: 1.B.2, CH4 with 0.20 Gg CO2 / year (0.6%)
In the third party priority scenario the following sector-gas combinations have the highest absolute impact on national total KyotoGHG (AR6GWP100) emissions in 2022 (top 5):
- 1: 1.B.1, CO2 with -1679.87 Gg CO2 / year (-30.9%)
- 2: 1.A, CO2 with -764.49 Gg CO2 / year (-6.4%)
- 3: 4, CH4 with -592.08 Gg CO2 / year (-25.5%)
- 4: M.AG.ELV, N2O with 386.19 Gg CO2 / year (33.7%)
- 5: 1.B.2, CH4 with -168.92 Gg CO2 / year (-95.8%)
In the third party priority scenario the following sector-gas combinations have the highest absolute impact on national total KyotoGHG (AR6GWP100) emissions in 1990-2022 (top 5):
- 1: M.AG.ELV, N2O with 329.26 Gg CO2 / year (32.3%)
- 2: 1.A, CO2 with -230.43 Gg CO2 / year (-1.4%)
- 3: 1.B.1, CO2 with 191.85 Gg CO2 / year (7.3%)
- 4: 1.B.2, CH4 with -123.35 Gg CO2 / year (-89.7%)
- 5: 2, CO2 with -101.51 Gg CO2 / year (-14.8%)
Notes on data changes
Here we list notes explaining important emissions changes for the country. ’' means that the following text only applies to the TP time series, while means that it only applies to the CR scenario. Otherwise the note applies to both scenarios.
- 2, CO2: 2022 emissions in 2.A (mineral industry) have changed due to an update to the algorithm that extends time series with lower priority data for the special case that the lower priority data is zero (which in this case is the Andrew cement data)
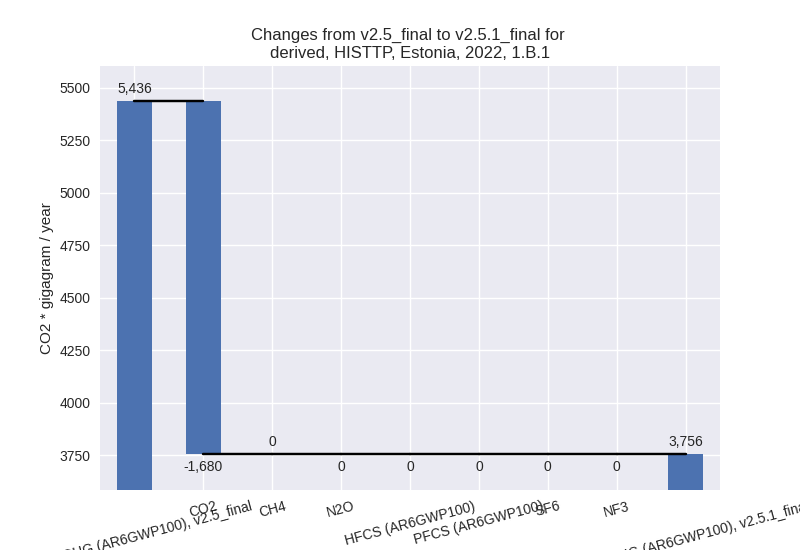
- 1.B.1, CO2: EDGAR 8.0 emissions differ from EDGAR 7.0 leading to lower 2022 emissions and higher cumulative emissions.
- 1.A, CO2: The CDIAC 2023 data shows a bit different growth rates for the latest years than the EI data used in v2.5.
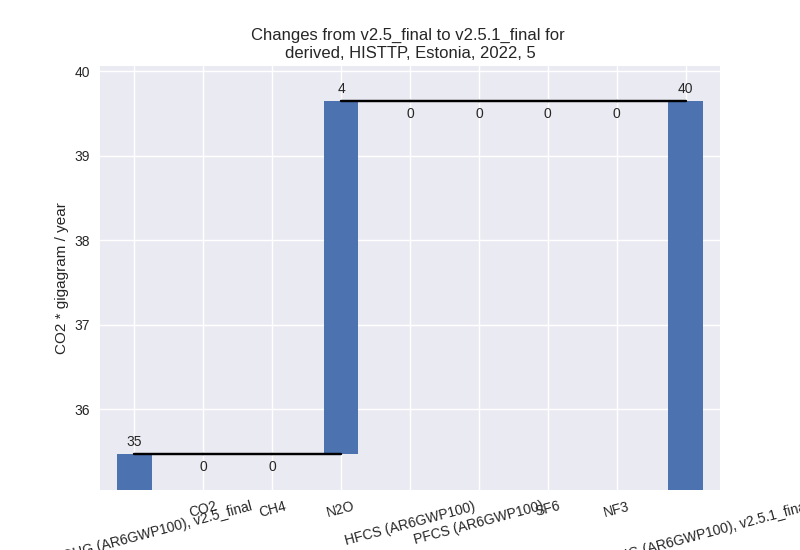
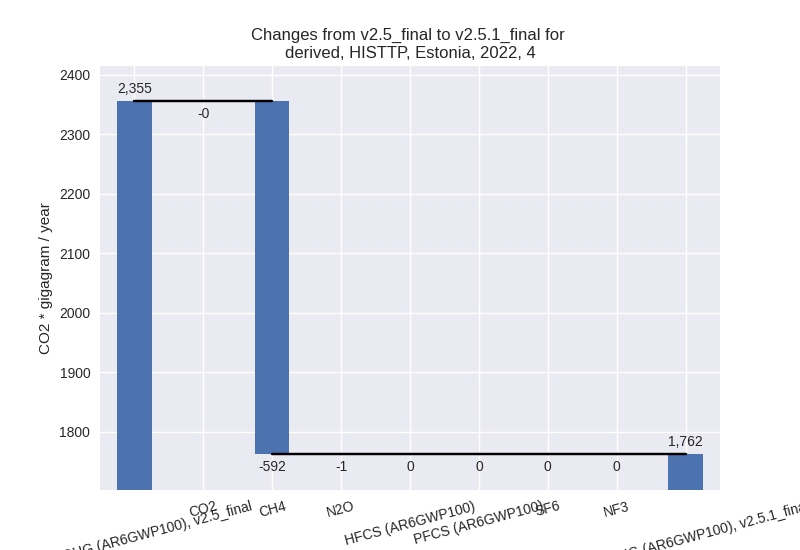
Changes by sector and gas
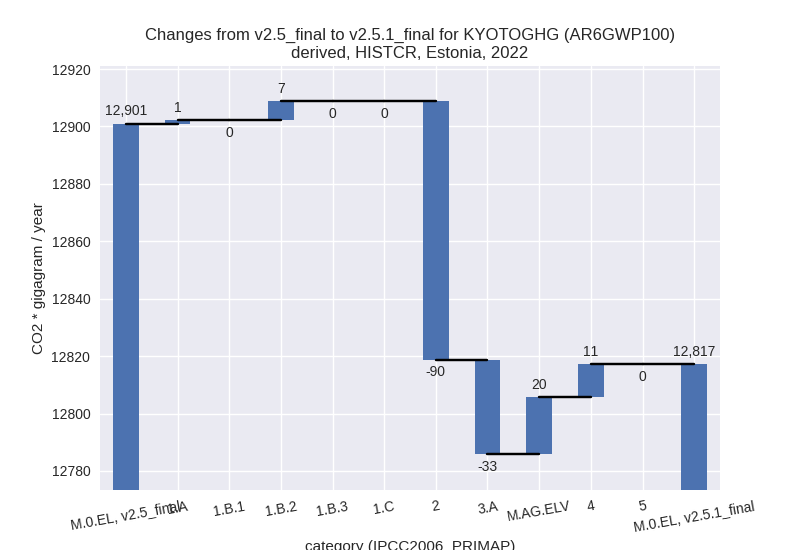
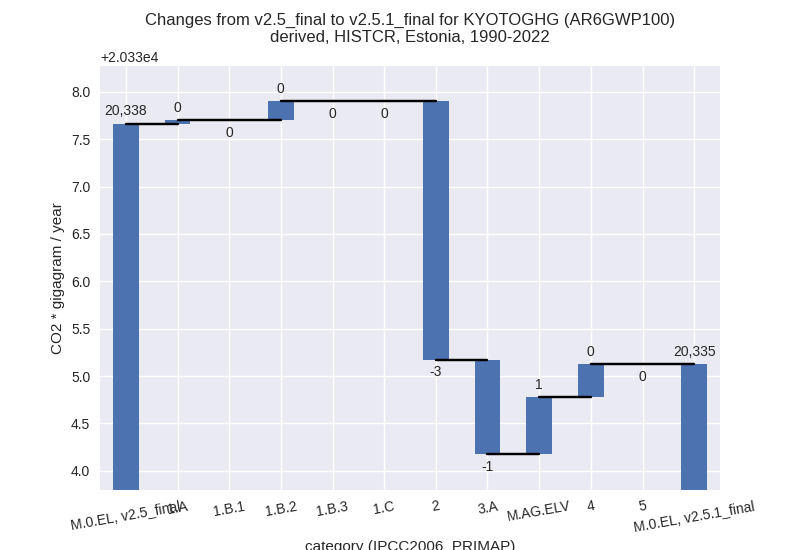
For each scenario and time frame the changes are displayed for all individual sectors and all individual gases. In the sector plot we use aggregate Kyoto GHGs in AR6GWP100. In the gas plot we usenational total emissions without LULUCF. ## country reported scenario
2022
1990-2022
third party scenario
2022
1990-2022
Detailed changes for the scenarios:
country reported scenario (HISTCR):
Most important changes per time frame
For 2022 the following sector-gas combinations have the highest absolute impact on national total KyotoGHG (AR6GWP100) emissions in 2022 (top 5):
- 1: 2, CO2 with -90.02 Gg CO2 / year (-49.4%)
- 2: 3.A, CH4 with -31.60 Gg CO2 / year (-3.8%)
- 3: 4, CH4 with 14.78 Gg CO2 / year (6.7%)
- 4: M.AG.ELV, N2O with 13.43 Gg CO2 / year (1.8%)
- 5: 1.B.2, CH4 with 6.51 Gg CO2 / year (39.3%)
For 1990-2022 the following sector-gas combinations have the highest absolute impact on national total KyotoGHG (AR6GWP100) emissions in 1990-2022 (top 5):
- 1: 2, CO2 with -2.73 Gg CO2 / year (-0.5%)
- 2: 3.A, CH4 with -0.96 Gg CO2 / year (-0.1%)
- 3: 4, CH4 with 0.45 Gg CO2 / year (0.1%)
- 4: M.AG.ELV, N2O with 0.41 Gg CO2 / year (0.1%)
- 5: 1.B.2, CH4 with 0.20 Gg CO2 / year (0.6%)
Changes in the main sectors for aggregate KyotoGHG (AR6GWP100) are
- 1: Total sectoral emissions in 2022 are 10597.74 Gg CO2 / year which is 82.7% of M.0.EL emissions. 2022 Emissions have changed by 0.1% (7.80 Gg CO2 / year). 1990-2022 Emissions have changed by 0.0% (0.24 Gg CO2 / year).
- 2: Total sectoral emissions in 2022 are 327.40 Gg
CO2 / year which is 2.6% of M.0.EL emissions. 2022 Emissions have
changed by -21.6% (-89.97 Gg CO2 /
year). 1990-2022 Emissions have changed by -0.4% (-2.73 Gg CO2 / year). For 2022 the
changes per gas
are:

- M.AG: Total sectoral emissions in 2022 are 1616.38 Gg CO2 / year which is 12.6% of M.0.EL emissions. 2022 Emissions have changed by -0.8% (-13.15 Gg CO2 / year). 1990-2022 Emissions have changed by -0.0% (-0.40 Gg CO2 / year).
- 4: Total sectoral emissions in 2022 are 275.61 Gg
CO2 / year which is 2.2% of M.0.EL emissions. 2022 Emissions have
changed by 4.3% (11.48 Gg CO2 /
year). 1990-2022 Emissions have changed by 0.1% (0.35 Gg CO2 / year). For 2022 the
changes per gas
are:

- 5: No data
third party scenario (HISTTP):
Most important changes per time frame
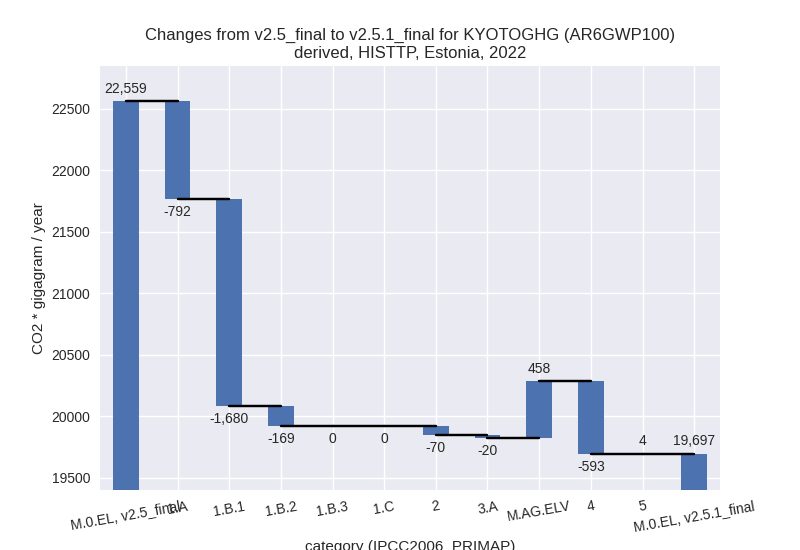
For 2022 the following sector-gas combinations have the highest absolute impact on national total KyotoGHG (AR6GWP100) emissions in 2022 (top 5):
- 1: 1.B.1, CO2 with -1679.87 Gg CO2 / year (-30.9%)
- 2: 1.A, CO2 with -764.49 Gg CO2 / year (-6.4%)
- 3: 4, CH4 with -592.08 Gg CO2 / year (-25.5%)
- 4: M.AG.ELV, N2O with 386.19 Gg CO2 / year (33.7%)
- 5: 1.B.2, CH4 with -168.92 Gg CO2 / year (-95.8%)
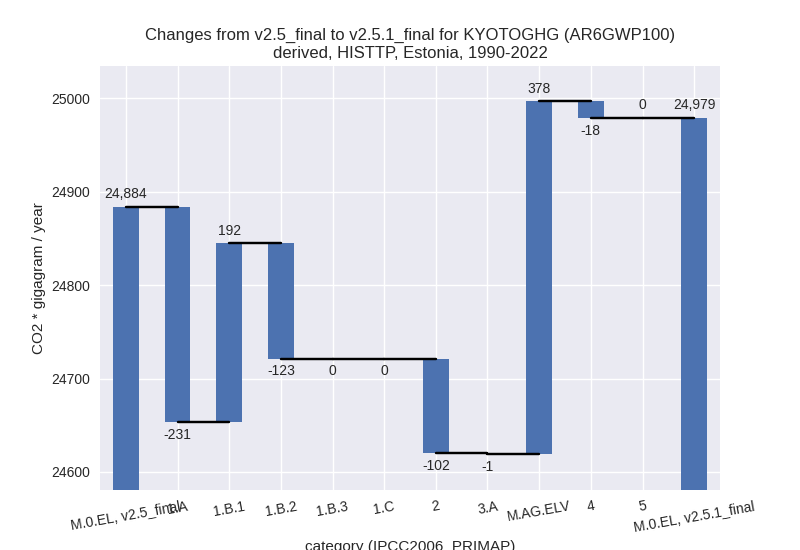
For 1990-2022 the following sector-gas combinations have the highest absolute impact on national total KyotoGHG (AR6GWP100) emissions in 1990-2022 (top 5):
- 1: M.AG.ELV, N2O with 329.26 Gg CO2 / year (32.3%)
- 2: 1.A, CO2 with -230.43 Gg CO2 / year (-1.4%)
- 3: 1.B.1, CO2 with 191.85 Gg CO2 / year (7.3%)
- 4: 1.B.2, CH4 with -123.35 Gg CO2 / year (-89.7%)
- 5: 2, CO2 with -101.51 Gg CO2 / year (-14.8%)
Changes in the main sectors for aggregate KyotoGHG (AR6GWP100) are
- 1: Total sectoral emissions in 2022 are 15193.95 Gg
CO2 / year which is 77.1% of M.0.EL emissions. 2022 Emissions have
changed by -14.8% (-2641.16 Gg CO2 /
year). 1990-2022 Emissions have changed by -0.8% (-162.79 Gg CO2 / year). For 2022
the changes per gas
are:
The changes come from the following subsectors:- 1.A: Total sectoral emissions in 2022 are 11430.47
Gg CO2 / year which is 75.2% of category 1 emissions. 2022 Emissions
have changed by -6.5% (-792.45 Gg
CO2 / year). 1990-2022 Emissions have changed by -1.3% (-231.29 Gg CO2 / year). For 2022
the changes per gas
are:

There is no subsector information available in PRIMAP-hist. - 1.B.1: Total sectoral emissions in 2022 are 3756.10
Gg CO2 / year which is 24.7% of category 1 emissions. 2022 Emissions
have changed by -30.9% (-1679.78 Gg
CO2 / year). 1990-2022 Emissions have changed by 7.3% (191.84 Gg CO2 / year). For 2022 the
changes per gas
are:
For 1990-2022 the changes per gas are: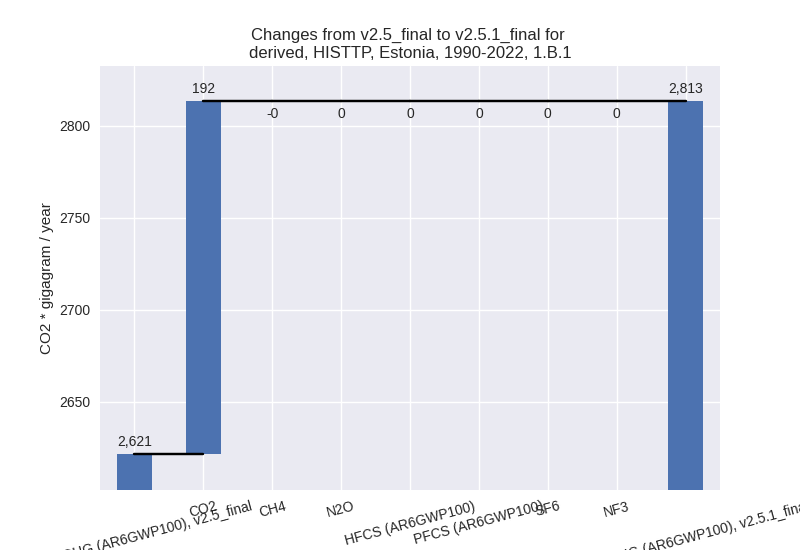
There is no subsector information available in PRIMAP-hist. - 1.B.2: Total sectoral emissions in 2022 are 7.39 Gg
CO2 / year which is 0.0% of category 1 emissions. 2022 Emissions have
changed by -95.8% (-168.92 Gg CO2 /
year). 1990-2022 Emissions have changed by -89.7% (-123.35 Gg CO2 / year). For 2022
the changes per gas
are:
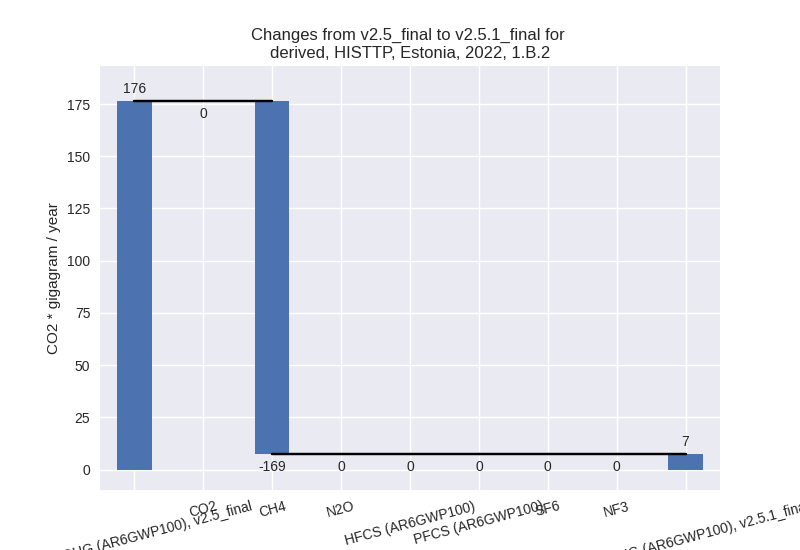
For 1990-2022 the changes per gas are:
There is no subsector information available in PRIMAP-hist.
- 1.A: Total sectoral emissions in 2022 are 11430.47
Gg CO2 / year which is 75.2% of category 1 emissions. 2022 Emissions
have changed by -6.5% (-792.45 Gg
CO2 / year). 1990-2022 Emissions have changed by -1.3% (-231.29 Gg CO2 / year). For 2022
the changes per gas
are:
- 2: Total sectoral emissions in 2022 are 328.74 Gg
CO2 / year which is 1.7% of M.0.EL emissions. 2022 Emissions have
changed by -17.6% (-70.37 Gg CO2 /
year). 1990-2022 Emissions have changed by -12.0% (-101.51 Gg CO2 / year). For 2022
the changes per gas
are:

For 1990-2022 the changes per gas are:
- M.AG: Total sectoral emissions in 2022 are 2372.59
Gg CO2 / year which is 12.0% of M.0.EL emissions. 2022 Emissions have
changed by 22.6% (438.08 Gg CO2 /
year). 1990-2022 Emissions have changed by 18.2% (377.09 Gg CO2 / year). For 2022 the
changes per gas
are:

For 1990-2022 the changes per gas are: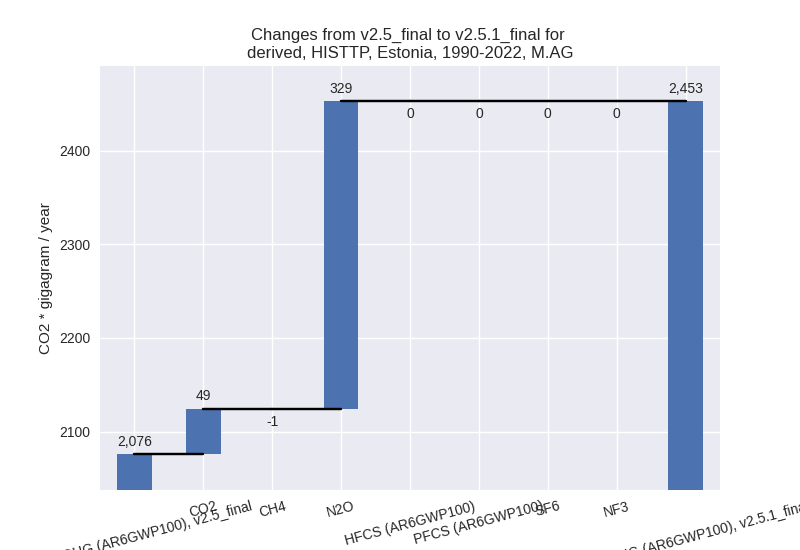
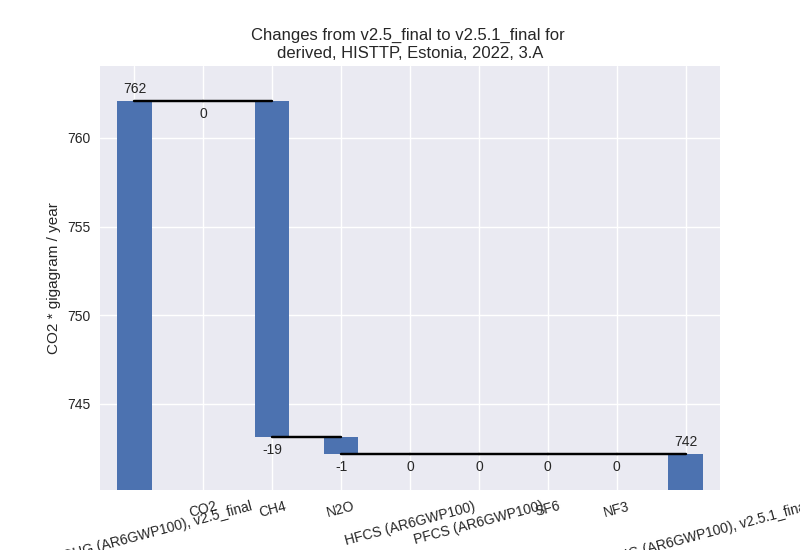
The changes come from the following subsectors:- 3.A: Total sectoral emissions in 2022 are 742.17 Gg
CO2 / year which is 31.3% of category M.AG emissions. 2022 Emissions
have changed by -2.6% (-19.90 Gg CO2
/ year). 1990-2022 Emissions have changed by -0.1% (-0.98 Gg CO2 / year). For 2022 the
changes per gas
are:
There is no subsector information available in PRIMAP-hist. - M.AG.ELV: Total sectoral emissions in 2022 are
1630.43 Gg CO2 / year which is 68.7% of category M.AG emissions. 2022
Emissions have changed by 39.1%
(457.98 Gg CO2 / year). 1990-2022 Emissions have changed by 36.3% (378.08 Gg CO2 / year). For 2022 the
changes per gas
are:
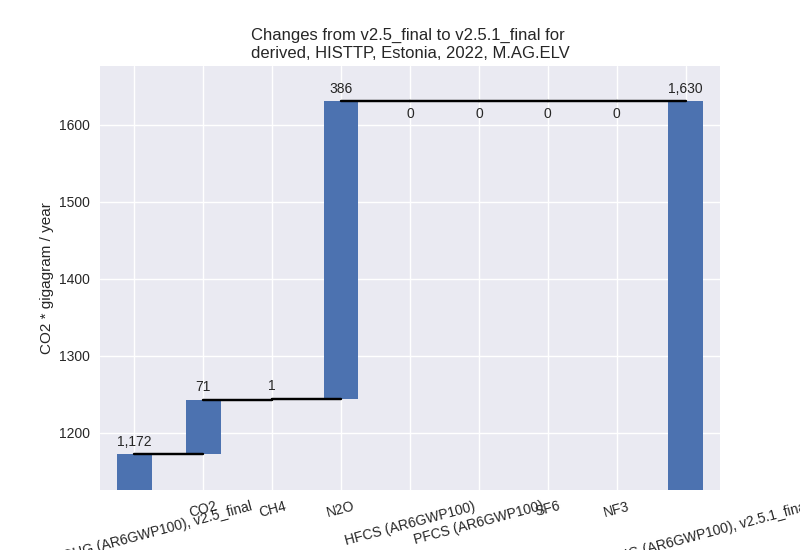
For 1990-2022 the changes per gas are:
There is no subsector information available in PRIMAP-hist.
- 3.A: Total sectoral emissions in 2022 are 742.17 Gg
CO2 / year which is 31.3% of category M.AG emissions. 2022 Emissions
have changed by -2.6% (-19.90 Gg CO2
/ year). 1990-2022 Emissions have changed by -0.1% (-0.98 Gg CO2 / year). For 2022 the
changes per gas
are:
- 4: Total sectoral emissions in 2022 are 1762.06 Gg
CO2 / year which is 8.9% of M.0.EL emissions. 2022 Emissions have
changed by -25.2% (-592.97 Gg CO2 /
year). 1990-2022 Emissions have changed by -0.9% (-17.97 Gg CO2 / year). For 2022 the
changes per gas
are:
- 5: Total sectoral emissions in 2022 are 39.65 Gg
CO2 / year which is 0.2% of M.0.EL emissions. 2022 Emissions have
changed by 11.8% (4.18 Gg CO2 /
year). 1990-2022 Emissions have changed by 0.2% (0.13 Gg CO2 / year). For 2022 the
changes per gas
are: