Changes in PRIMAP-hist v2.5.1_final compared to v2.5_final for Ethiopia
2024-02-29
Johannes Gütschow
Change analysis for Ethiopia for PRIMAP-hist v2.5.1_final compared to v2.5_final
Overview over emissions by sector and gas
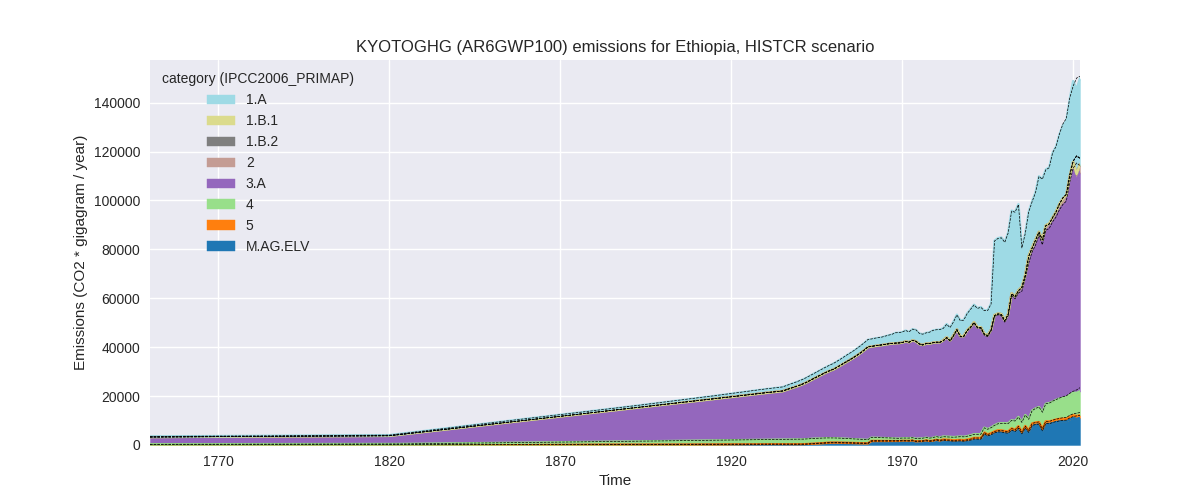
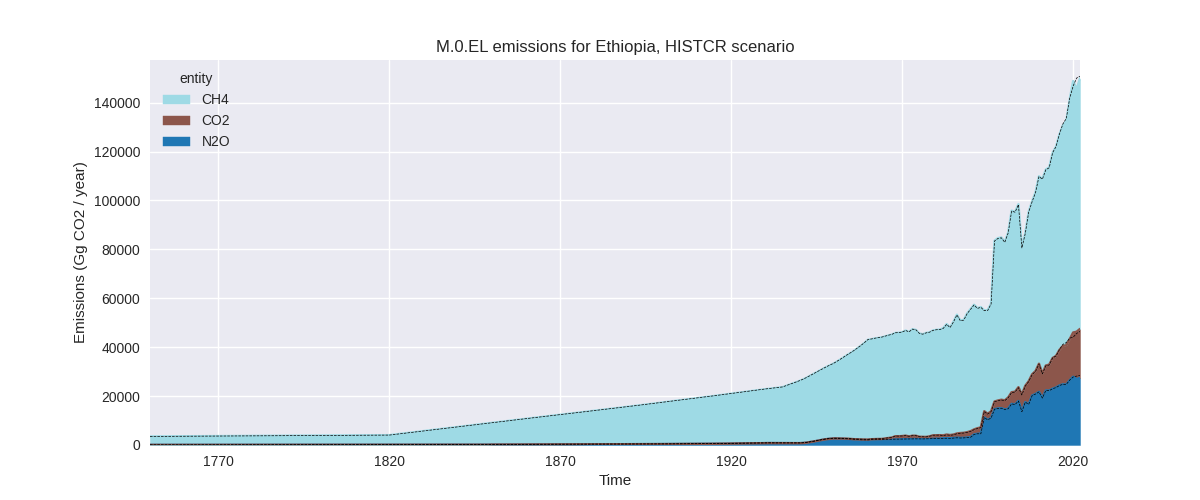
The following figures show the aggregate national total emissions excluding LULUCF AR6GWP100 for the country reported priority scenario. The dotted linesshow the v2.5_final data.

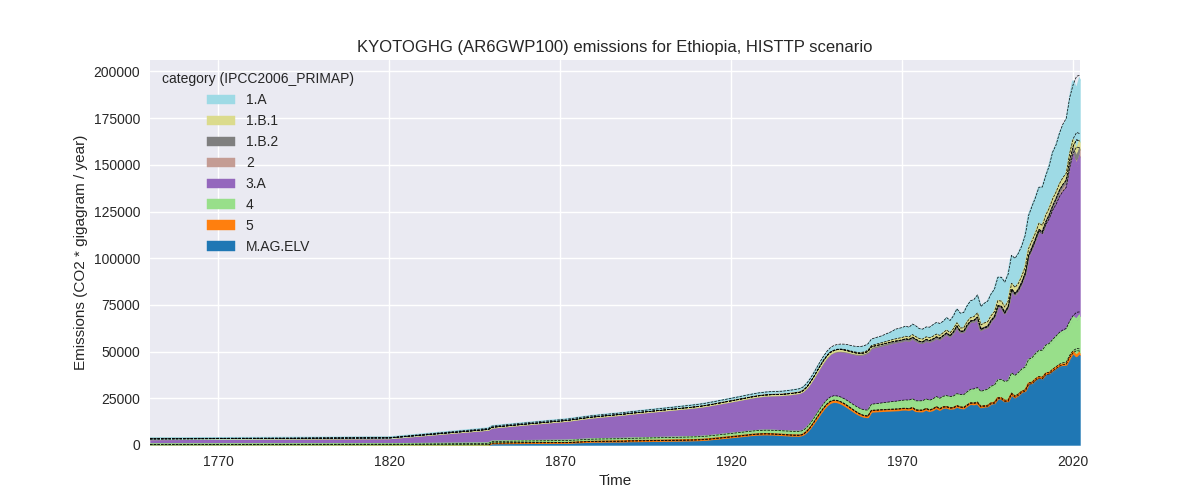
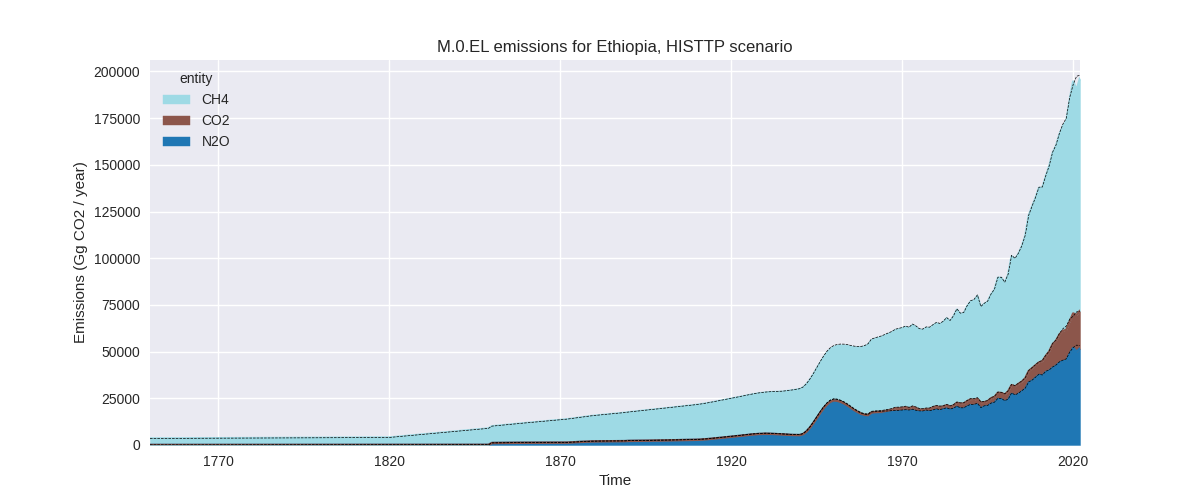
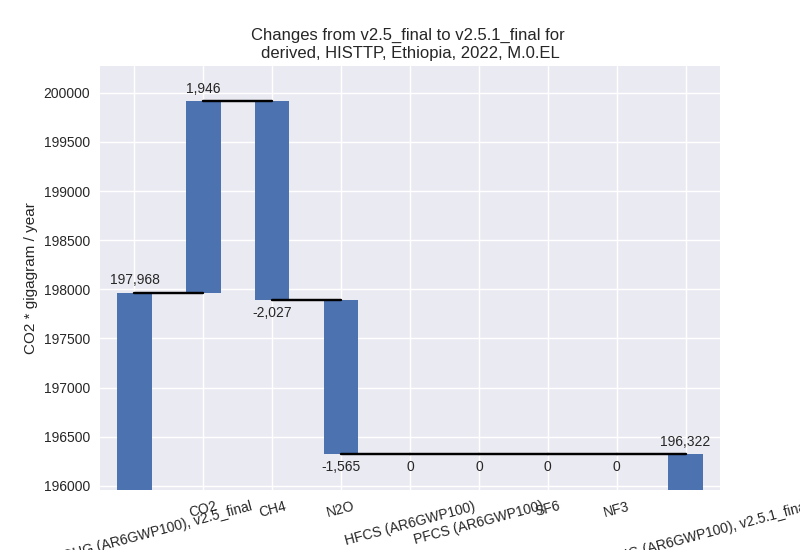
The following figures show the aggregate national total emissions excluding LULUCF AR6GWP100 for the third party priority scenario. The dotted linesshow the v2.5_final data.

Overview over changes
In the country reported priority scenario we have the following changes for aggregate Kyoto GHG and national total emissions excluding LULUCF (M.0.EL):
- Emissions in 2022 have changed by -0.6%% (-832.87 Gg CO2 / year)
- Emissions in 1990-2022 have changed by -0.1%% (-88.91 Gg CO2 / year)
In the third party priority scenario we have the following changes for aggregate Kyoto GHG and national total emissions excluding LULUCF (M.0.EL):
- Emissions in 2022 have changed by -0.8%% (-1645.69 Gg CO2 / year)
- Emissions in 1990-2022 have changed by -0.6%% (-710.98 Gg CO2 / year)
Most important changes per scenario and time frame
In the country reported priority scenario the following sector-gas combinations have the highest absolute impact on national total KyotoGHG (AR6GWP100) emissions in 2022 (top 5):
- 1: 1.A, CO2 with 2517.86 Gg CO2 / year (18.1%)
- 2: 1.A, CH4 with -856.00 Gg CO2 / year (-4.8%)
- 3: M.AG.ELV, CO2 with -664.08 Gg CO2 / year (-58.8%)
- 4: 3.A, CH4 with -659.92 Gg CO2 / year (-0.9%)
- 5: 3.A, N2O with -531.79 Gg CO2 / year (-3.9%)
In the country reported priority scenario the following sector-gas combinations have the highest absolute impact on national total KyotoGHG (AR6GWP100) emissions in 1990-2022 (top 5):
- 1: 3.A, CH4 with -195.55 Gg CO2 / year (-0.4%)
- 2: 1.A, CO2 with 189.86 Gg CO2 / year (2.9%)
- 3: 2, CO2 with 123.54 Gg CO2 / year (8.9%)
- 4: M.AG.ELV, CO2 with -113.38 Gg CO2 / year (-34.4%)
- 5: M.AG.ELV, N2O with -37.20 Gg CO2 / year (-0.7%)
In the third party priority scenario the following sector-gas combinations have the highest absolute impact on national total KyotoGHG (AR6GWP100) emissions in 2022 (top 5):
- 1: 1.A, CO2 with 2417.44 Gg CO2 / year (18.1%)
- 2: 3.A, CH4 with -2069.76 Gg CO2 / year (-2.4%)
- 3: M.AG.ELV, N2O with -1416.65 Gg CO2 / year (-3.0%)
- 4: M.AG.ELV, CO2 with -664.08 Gg CO2 / year (-58.8%)
- 5: 1.A, CH4 with -263.77 Gg CO2 / year (-1.8%)
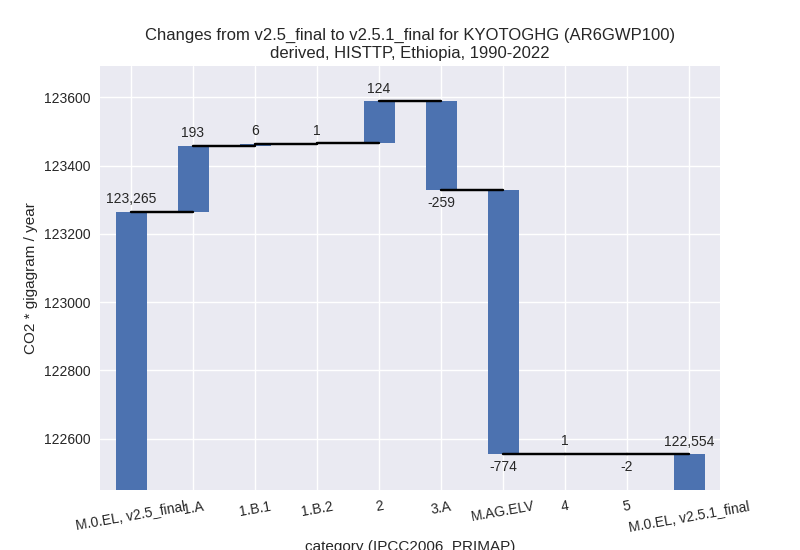
In the third party priority scenario the following sector-gas combinations have the highest absolute impact on national total KyotoGHG (AR6GWP100) emissions in 1990-2022 (top 5):
- 1: M.AG.ELV, N2O with -667.38 Gg CO2 / year (-2.3%)
- 2: 3.A, CH4 with -257.99 Gg CO2 / year (-0.5%)
- 3: 1.A, CO2 with 188.07 Gg CO2 / year (3.0%)
- 4: 2, CO2 with 123.54 Gg CO2 / year (9.1%)
- 5: M.AG.ELV, CO2 with -113.38 Gg CO2 / year (-34.4%)
Notes on data changes
No country specific notes present for this changelog.
Changes by sector and gas
For each scenario and time frame the changes are displayed for all individual sectors and all individual gases. In the sector plot we use aggregate Kyoto GHGs in AR6GWP100. In the gas plot we usenational total emissions without LULUCF. ## country reported scenario
2022

1990-2022

third party scenario
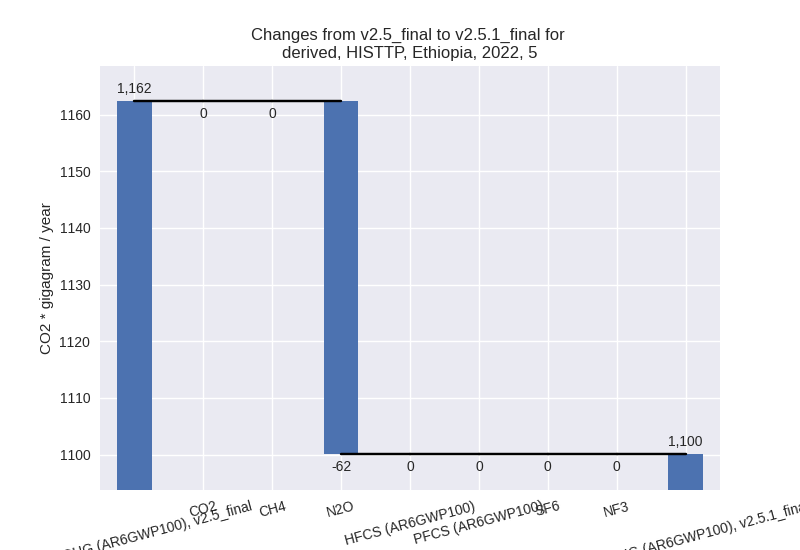
2022
1990-2022

Detailed changes for the scenarios:
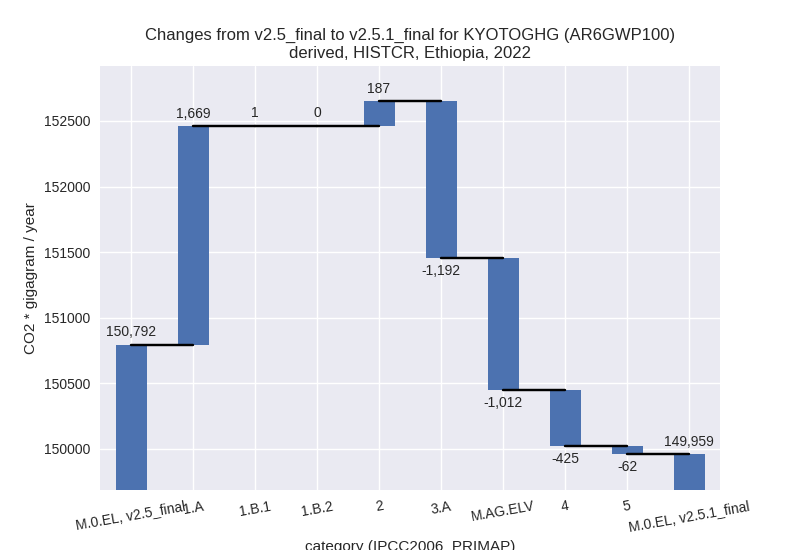
country reported scenario (HISTCR):
Most important changes per time frame
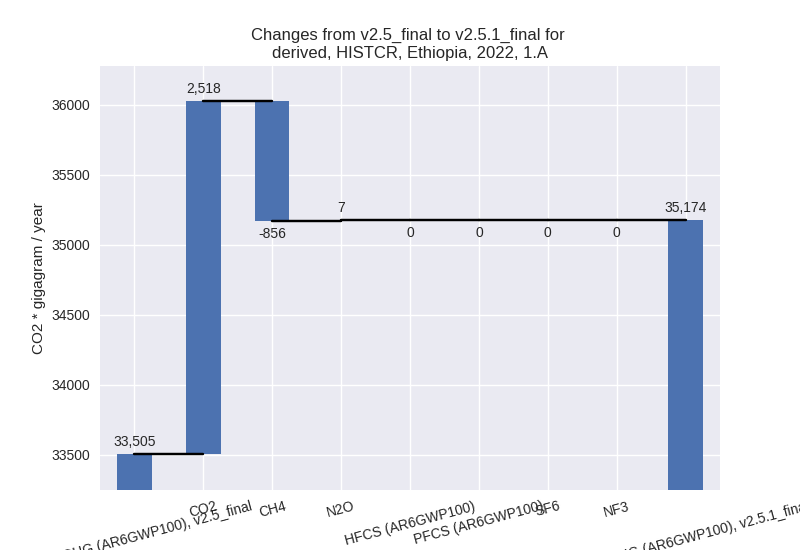
For 2022 the following sector-gas combinations have the highest absolute impact on national total KyotoGHG (AR6GWP100) emissions in 2022 (top 5):
- 1: 1.A, CO2 with 2517.86 Gg CO2 / year (18.1%)
- 2: 1.A, CH4 with -856.00 Gg CO2 / year (-4.8%)
- 3: M.AG.ELV, CO2 with -664.08 Gg CO2 / year (-58.8%)
- 4: 3.A, CH4 with -659.92 Gg CO2 / year (-0.9%)
- 5: 3.A, N2O with -531.79 Gg CO2 / year (-3.9%)
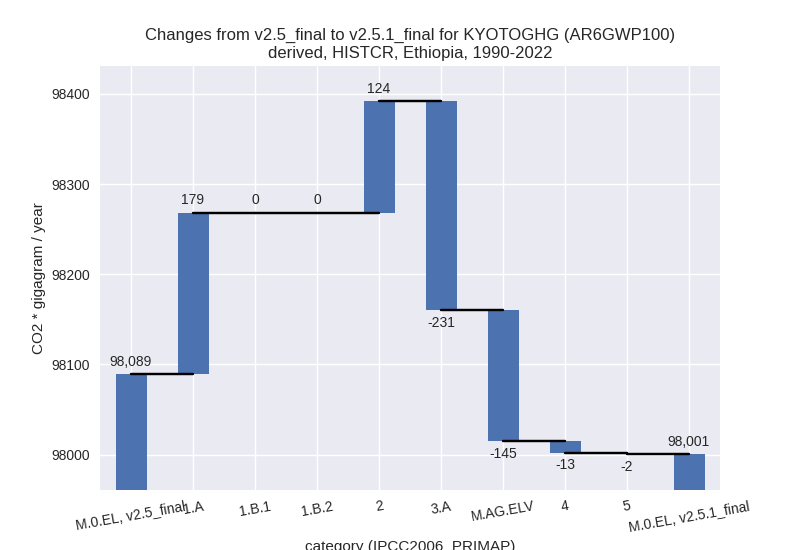
For 1990-2022 the following sector-gas combinations have the highest absolute impact on national total KyotoGHG (AR6GWP100) emissions in 1990-2022 (top 5):
- 1: 3.A, CH4 with -195.55 Gg CO2 / year (-0.4%)
- 2: 1.A, CO2 with 189.86 Gg CO2 / year (2.9%)
- 3: 2, CO2 with 123.54 Gg CO2 / year (8.9%)
- 4: M.AG.ELV, CO2 with -113.38 Gg CO2 / year (-34.4%)
- 5: M.AG.ELV, N2O with -37.20 Gg CO2 / year (-0.7%)
Changes in the main sectors for aggregate KyotoGHG (AR6GWP100) are
- 1: Total sectoral emissions in 2022 are 35240.30 Gg
CO2 / year which is 23.5% of M.0.EL emissions. 2022 Emissions have
changed by 5.0% (1670.32 Gg CO2 /
year). 1990-2022 Emissions have changed by 0.8% (178.76 Gg CO2 / year). For 2022 the
changes per gas
are:

The changes come from the following subsectors:- 1.A: Total sectoral emissions in 2022 are 35174.46
Gg CO2 / year which is 99.8% of category 1 emissions. 2022 Emissions
have changed by 5.0% (1669.06 Gg CO2
/ year). 1990-2022 Emissions have changed by 0.8% (178.65 Gg CO2 / year). For 2022 the
changes per gas
are:
There is no subsector information available in PRIMAP-hist. - 1.B.1: Total sectoral emissions in 2022 are 64.73 Gg CO2 / year which is 0.2% of category 1 emissions. 2022 Emissions have changed by 1.5% (0.96 Gg CO2 / year). 1990-2022 Emissions have changed by 0.1% (0.07 Gg CO2 / year).
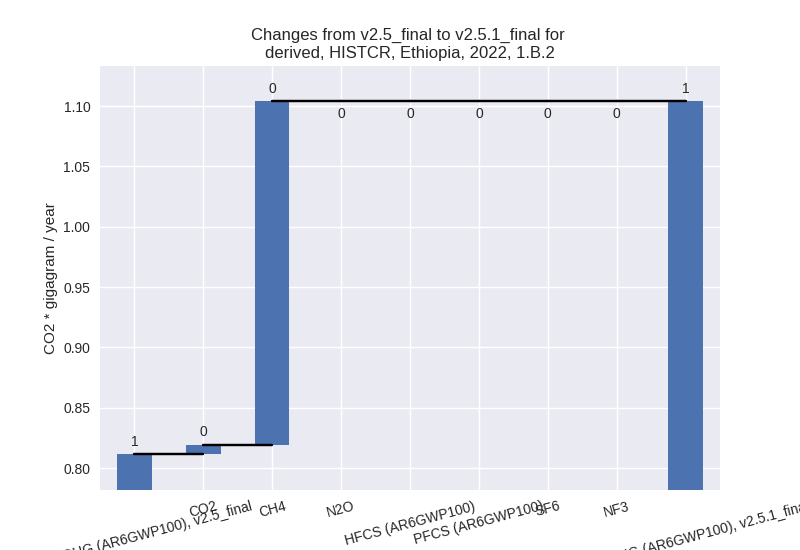
- 1.B.2: Total sectoral emissions in 2022 are 1.10 Gg
CO2 / year which is 0.0% of category 1 emissions. 2022 Emissions have
changed by 36.0% (0.29 Gg CO2 /
year). 1990-2022 Emissions have changed by 7.6% (0.04 Gg CO2 / year). For 2022 the
changes per gas
are:
For 1990-2022 the changes per gas are:
There is no subsector information available in PRIMAP-hist.
- 1.A: Total sectoral emissions in 2022 are 35174.46
Gg CO2 / year which is 99.8% of category 1 emissions. 2022 Emissions
have changed by 5.0% (1669.06 Gg CO2
/ year). 1990-2022 Emissions have changed by 0.8% (178.65 Gg CO2 / year). For 2022 the
changes per gas
are:
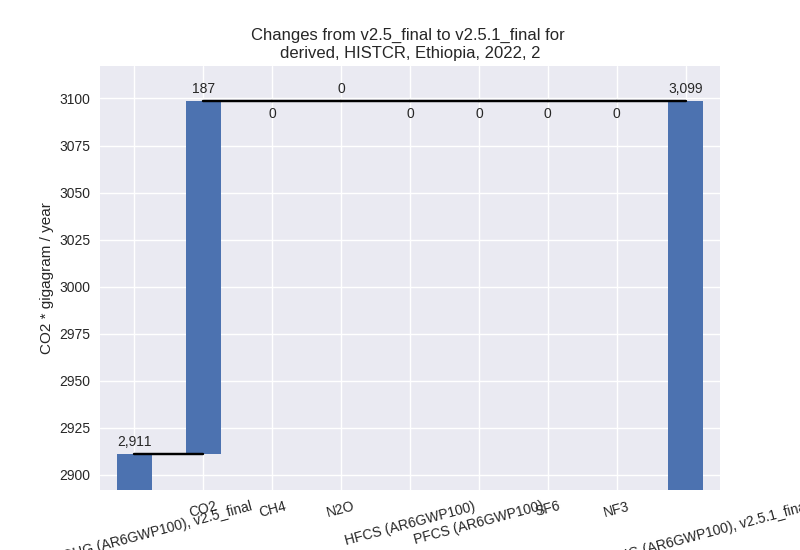
- 2: Total sectoral emissions in 2022 are 3098.52 Gg
CO2 / year which is 2.1% of M.0.EL emissions. 2022 Emissions have
changed by 6.4% (187.47 Gg CO2 /
year). 1990-2022 Emissions have changed by 8.9% (123.54 Gg CO2 / year). For 2022 the
changes per gas
are:
For 1990-2022 the changes per gas are:
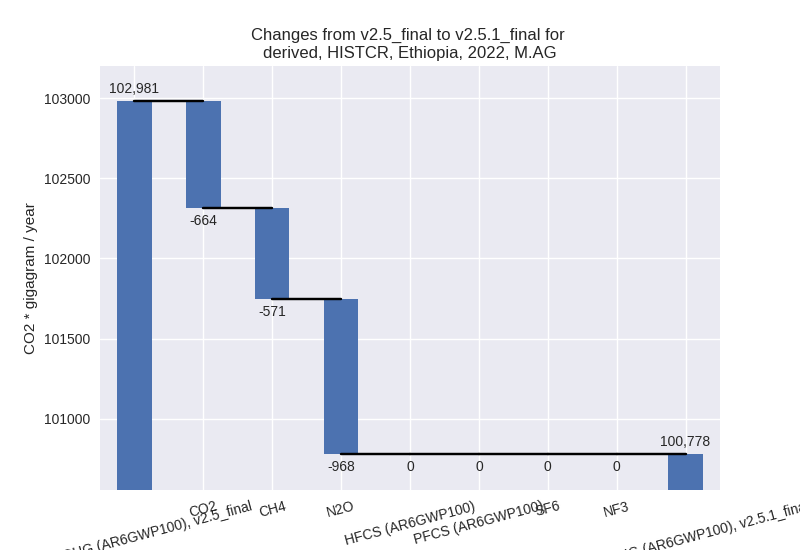
- M.AG: Total sectoral emissions in 2022 are
100778.15 Gg CO2 / year which is 67.2% of M.0.EL emissions. 2022
Emissions have changed by -2.1%
(-2203.22 Gg CO2 / year). 1990-2022 Emissions have changed by -0.6% (-376.44 Gg CO2 / year). For 2022
the changes per gas
are:
The changes come from the following subsectors:- 3.A: Total sectoral emissions in 2022 are 89664.04 Gg CO2 / year which is 89.0% of category M.AG emissions. 2022 Emissions have changed by -1.3% (-1191.71 Gg CO2 / year). 1990-2022 Emissions have changed by -0.4% (-231.50 Gg CO2 / year).
- M.AG.ELV: Total sectoral emissions in 2022 are
11114.11 Gg CO2 / year which is 11.0% of category M.AG emissions. 2022
Emissions have changed by -8.3%
(-1011.52 Gg CO2 / year). 1990-2022 Emissions have changed by -2.1% (-144.94 Gg CO2 / year). For 2022
the changes per gas
are:

For 1990-2022 the changes per gas are:
There is no subsector information available in PRIMAP-hist.
- 4: Total sectoral emissions in 2022 are 9741.97 Gg
CO2 / year which is 6.5% of M.0.EL emissions. 2022 Emissions have
changed by -4.2% (-425.16 Gg CO2 /
year). 1990-2022 Emissions have changed by -0.3% (-12.88 Gg CO2 / year). For 2022 the
changes per gas
are:

- 5: Total sectoral emissions in 2022 are 1100.06 Gg
CO2 / year which is 0.7% of M.0.EL emissions. 2022 Emissions have
changed by -5.4% (-62.27 Gg CO2 /
year). 1990-2022 Emissions have changed by -0.2% (-1.89 Gg CO2 / year). For 2022 the
changes per gas
are:

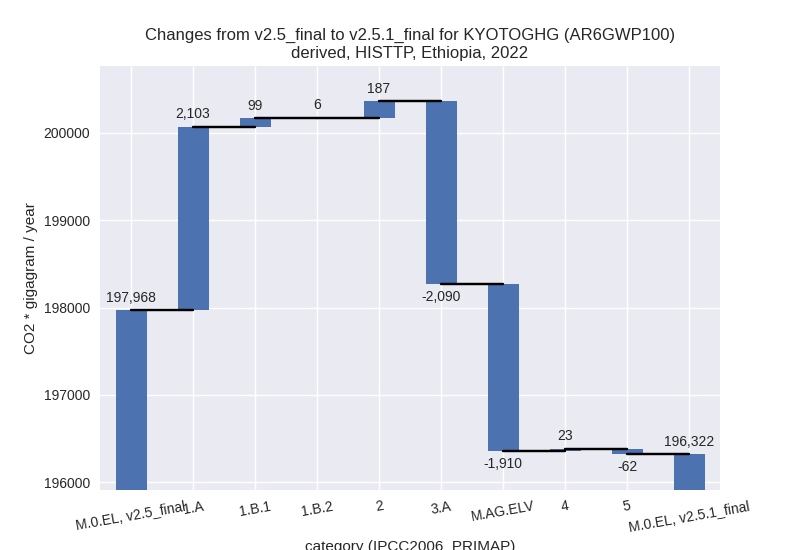
third party scenario (HISTTP):
Most important changes per time frame
For 2022 the following sector-gas combinations have the highest absolute impact on national total KyotoGHG (AR6GWP100) emissions in 2022 (top 5):
- 1: 1.A, CO2 with 2417.44 Gg CO2 / year (18.1%)
- 2: 3.A, CH4 with -2069.76 Gg CO2 / year (-2.4%)
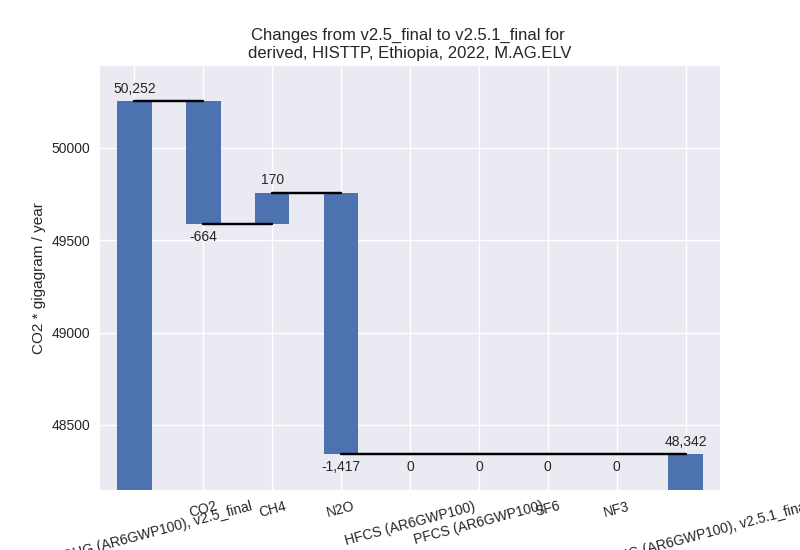
- 3: M.AG.ELV, N2O with -1416.65 Gg CO2 / year (-3.0%)
- 4: M.AG.ELV, CO2 with -664.08 Gg CO2 / year (-58.8%)
- 5: 1.A, CH4 with -263.77 Gg CO2 / year (-1.8%)
For 1990-2022 the following sector-gas combinations have the highest absolute impact on national total KyotoGHG (AR6GWP100) emissions in 1990-2022 (top 5):
- 1: M.AG.ELV, N2O with -667.38 Gg CO2 / year (-2.3%)
- 2: 3.A, CH4 with -257.99 Gg CO2 / year (-0.5%)
- 3: 1.A, CO2 with 188.07 Gg CO2 / year (3.0%)
- 4: 2, CO2 with 123.54 Gg CO2 / year (9.1%)
- 5: M.AG.ELV, CO2 with -113.38 Gg CO2 / year (-34.4%)
Changes in the main sectors for aggregate KyotoGHG (AR6GWP100) are
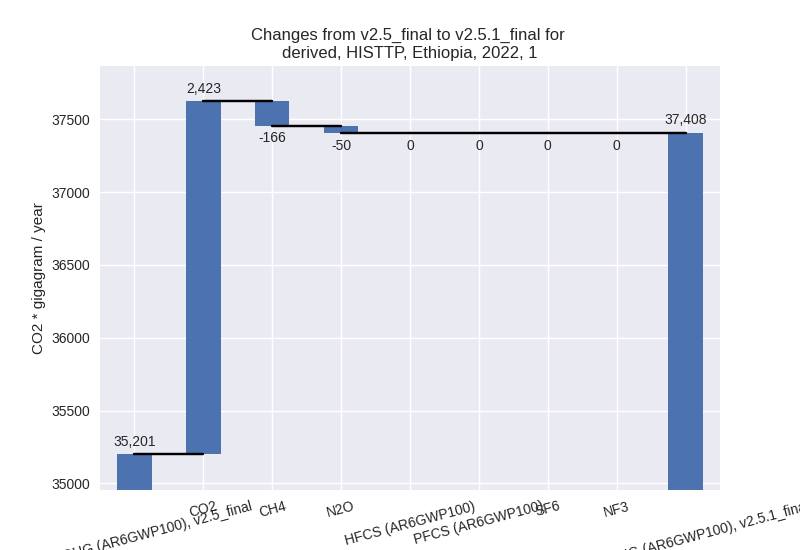
- 1: Total sectoral emissions in 2022 are 37407.68 Gg
CO2 / year which is 19.1% of M.0.EL emissions. 2022 Emissions have
changed by 6.3% (2206.78 Gg CO2 /
year). 1990-2022 Emissions have changed by 0.9% (199.99 Gg CO2 / year). For 2022 the
changes per gas
are:
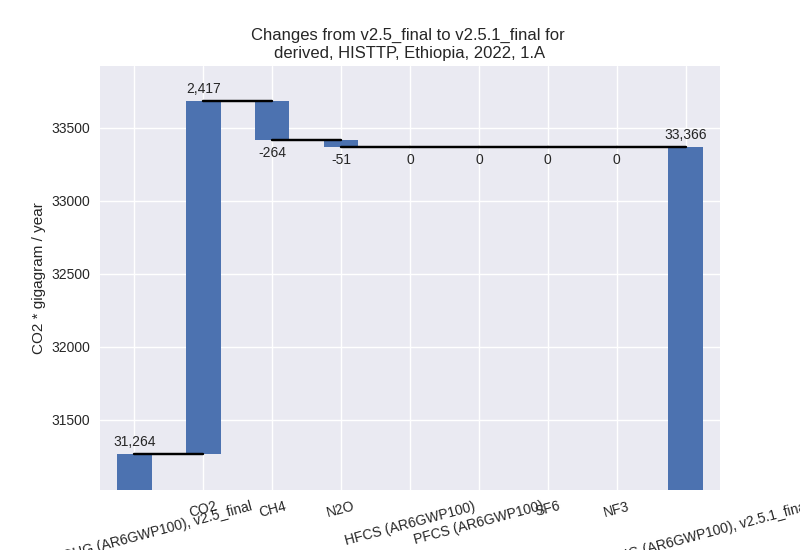
The changes come from the following subsectors:- 1.A: Total sectoral emissions in 2022 are 33366.13
Gg CO2 / year which is 89.2% of category 1 emissions. 2022 Emissions
have changed by 6.7% (2102.57 Gg CO2
/ year). 1990-2022 Emissions have changed by 1.0% (192.91 Gg CO2 / year). For 2022 the
changes per gas
are:
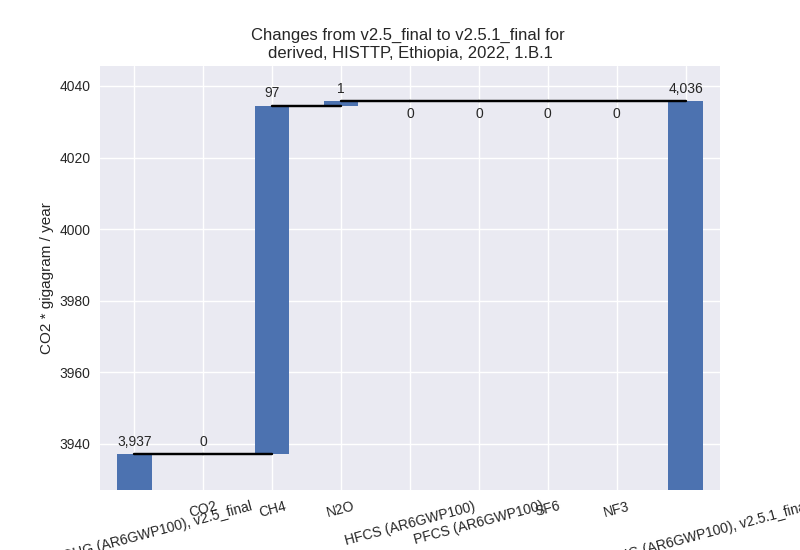
There is no subsector information available in PRIMAP-hist. - 1.B.1: Total sectoral emissions in 2022 are 4035.72
Gg CO2 / year which is 10.8% of category 1 emissions. 2022 Emissions
have changed by 2.5% (98.60 Gg CO2 /
year). 1990-2022 Emissions have changed by 0.2% (5.66 Gg CO2 / year). For 2022 the
changes per gas
are:
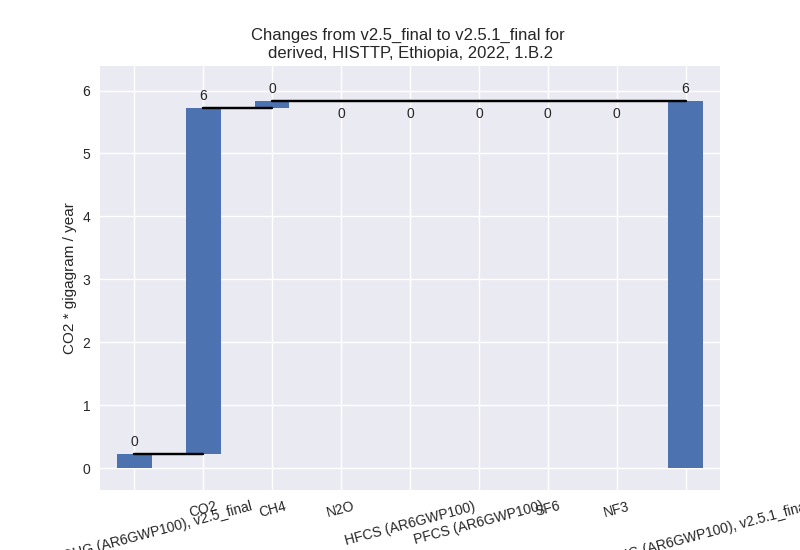
There is no subsector information available in PRIMAP-hist. - 1.B.2: Total sectoral emissions in 2022 are 5.83 Gg
CO2 / year which is 0.0% of category 1 emissions. 2022 Emissions have
changed by 2530.9% (5.61 Gg CO2 /
year). 1990-2022 Emissions have changed by 100.8% (1.41 Gg CO2 / year). For 2022 the
changes per gas
are:
For 1990-2022 the changes per gas are:
There is no subsector information available in PRIMAP-hist.
- 1.A: Total sectoral emissions in 2022 are 33366.13
Gg CO2 / year which is 89.2% of category 1 emissions. 2022 Emissions
have changed by 6.7% (2102.57 Gg CO2
/ year). 1990-2022 Emissions have changed by 1.0% (192.91 Gg CO2 / year). For 2022 the
changes per gas
are:
- 2: Total sectoral emissions in 2022 are 3976.68 Gg
CO2 / year which is 2.0% of M.0.EL emissions. 2022 Emissions have
changed by 4.9% (187.47 Gg CO2 /
year). 1990-2022 Emissions have changed by 9.1% (123.54 Gg CO2 / year). For 2022 the
changes per gas
are:

For 1990-2022 the changes per gas are:
- M.AG: Total sectoral emissions in 2022 are
133930.56 Gg CO2 / year which is 68.2% of M.0.EL emissions. 2022
Emissions have changed by -2.9%
(-4000.79 Gg CO2 / year). 1990-2022 Emissions have changed by -1.2% (-1033.32 Gg CO2 / year). For 2022
the changes per gas
are:

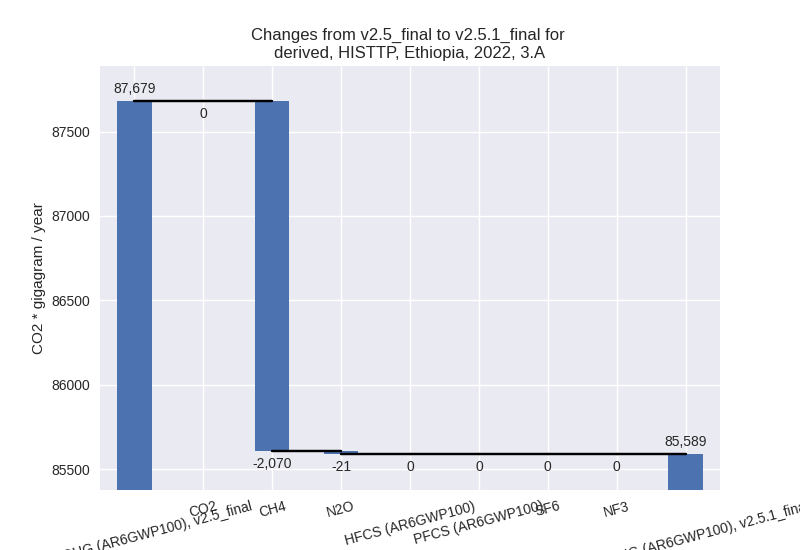
The changes come from the following subsectors:- 3.A: Total sectoral emissions in 2022 are 85588.83
Gg CO2 / year which is 63.9% of category M.AG emissions. 2022 Emissions
have changed by -2.4% (-2090.29 Gg
CO2 / year). 1990-2022 Emissions have changed by -0.5% (-259.18 Gg CO2 / year). For 2022
the changes per gas
are:
There is no subsector information available in PRIMAP-hist. - M.AG.ELV: Total sectoral emissions in 2022 are
48341.74 Gg CO2 / year which is 36.1% of category M.AG emissions. 2022
Emissions have changed by -3.8%
(-1910.50 Gg CO2 / year). 1990-2022 Emissions have changed by -2.4% (-774.14 Gg CO2 / year). For 2022
the changes per gas
are:
For 1990-2022 the changes per gas are: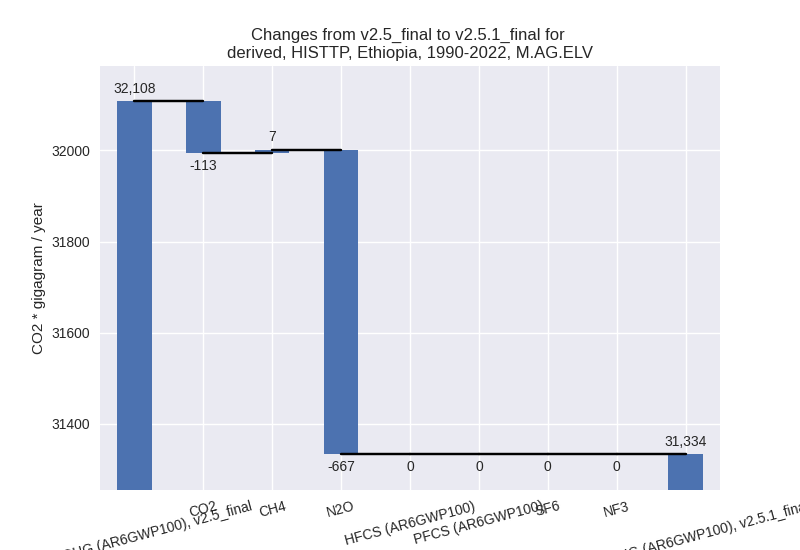
There is no subsector information available in PRIMAP-hist.
- 3.A: Total sectoral emissions in 2022 are 85588.83
Gg CO2 / year which is 63.9% of category M.AG emissions. 2022 Emissions
have changed by -2.4% (-2090.29 Gg
CO2 / year). 1990-2022 Emissions have changed by -0.5% (-259.18 Gg CO2 / year). For 2022
the changes per gas
are:
- 4: Total sectoral emissions in 2022 are 19906.99 Gg CO2 / year which is 10.1% of M.0.EL emissions. 2022 Emissions have changed by 0.1% (23.11 Gg CO2 / year). 1990-2022 Emissions have changed by 0.0% (0.70 Gg CO2 / year).
- 5: Total sectoral emissions in 2022 are 1100.06 Gg
CO2 / year which is 0.6% of M.0.EL emissions. 2022 Emissions have
changed by -5.4% (-62.27 Gg CO2 /
year). 1990-2022 Emissions have changed by -0.2% (-1.89 Gg CO2 / year). For 2022 the
changes per gas
are: