Changes in PRIMAP-hist v2.5.1_final compared to v2.5_final for EU27BX
2024-02-29
Johannes Gütschow
Change analysis for EU27BX for PRIMAP-hist v2.5.1_final compared to v2.5_final
Overview over emissions by sector and gas
The following figures show the aggregate national total emissions excluding LULUCF AR6GWP100 for the country reported priority scenario. The dotted linesshow the v2.5_final data.


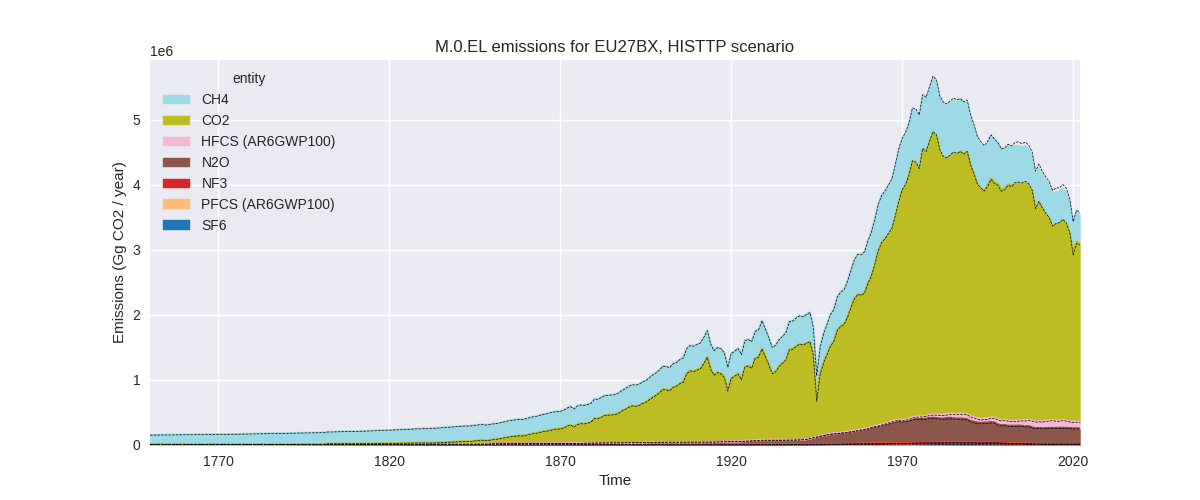
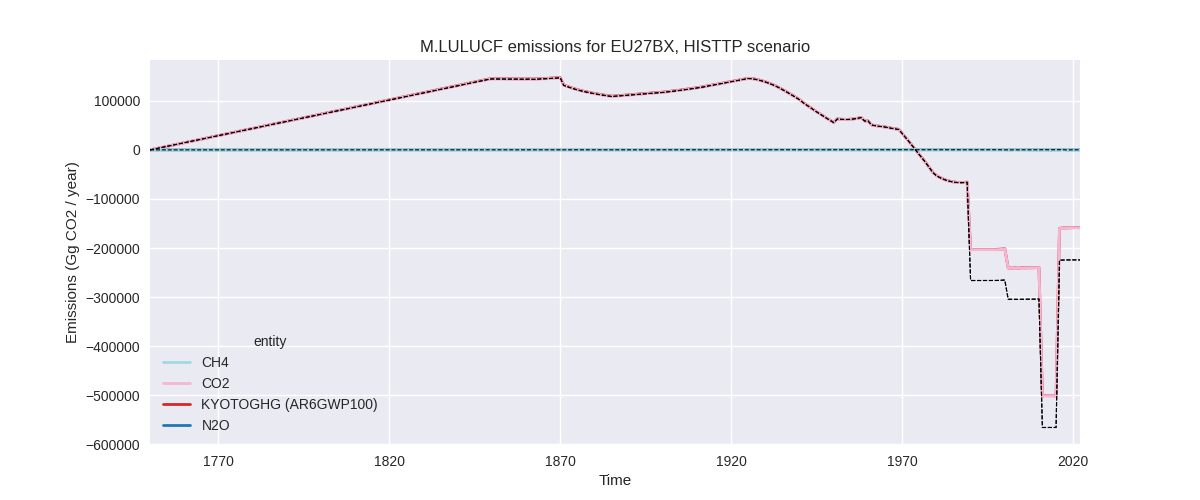
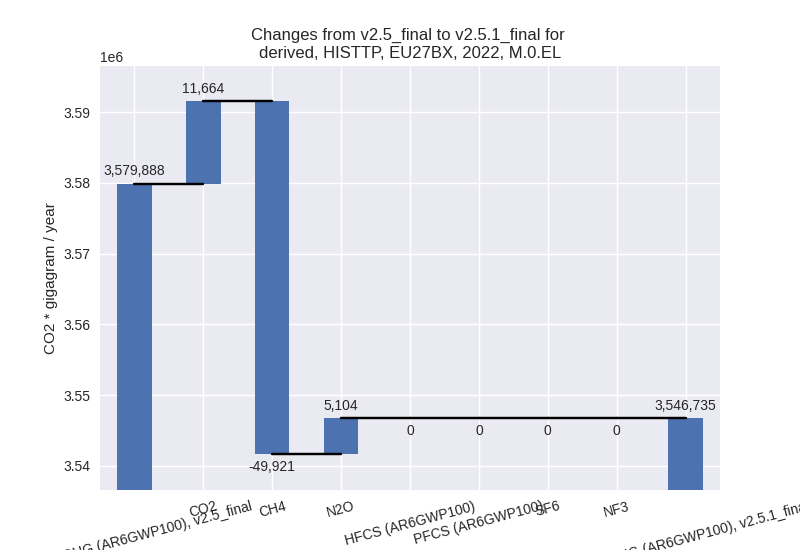
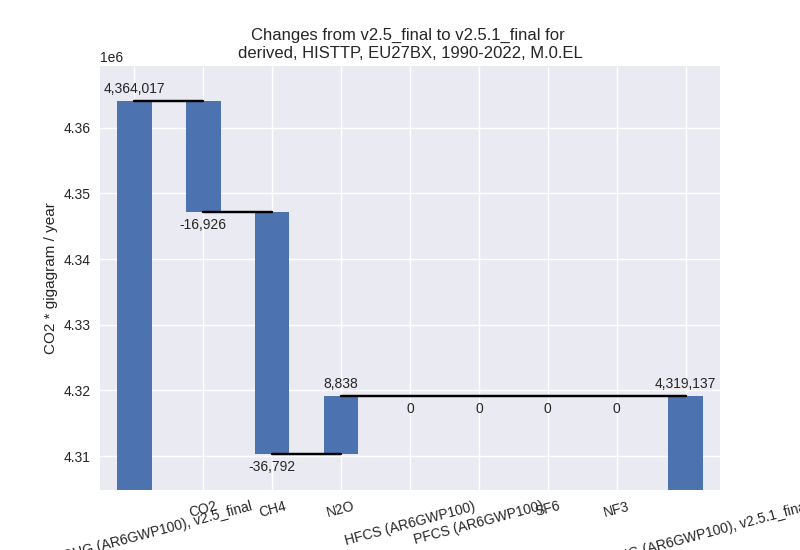
The following figures show the aggregate national total emissions excluding LULUCF AR6GWP100 for the third party priority scenario. The dotted linesshow the v2.5_final data.

Overview over changes
In the country reported priority scenario we have the following changes for aggregate Kyoto GHG and national total emissions excluding LULUCF (M.0.EL):
- Emissions in 2022 have changed by -0.2%% (-6273.10 Gg CO2 / year)
- Emissions in 1990-2022 have changed by -0.0%% (-190.09 Gg CO2 / year)
In the third party priority scenario we have the following changes for aggregate Kyoto GHG and national total emissions excluding LULUCF (M.0.EL):
- Emissions in 2022 have changed by -0.9%% (-33152.40 Gg CO2 / year)
- Emissions in 1990-2022 have changed by -1.0%% (-44880.17 Gg CO2 / year)
Most important changes per scenario and time frame
In the country reported priority scenario the following sector-gas combinations have the highest absolute impact on national total KyotoGHG (AR6GWP100) emissions in 2022 (top 5):
- 1: 1.B.2, CO2 with -5927.00 Gg CO2 / year (-43.2%)
- 2: 4, CH4 with 4724.96 Gg CO2 / year (5.2%)
- 3: 2, CO2 with -3864.25 Gg CO2 / year (-1.7%)
- 4: M.AG.ELV, N2O with -3275.66 Gg CO2 / year (-2.5%)
- 5: 2, N2O with 2981.90 Gg CO2 / year (85.0%)
In the country reported priority scenario the following sector-gas combinations have the highest absolute impact on national total KyotoGHG (AR6GWP100) emissions in 1990-2022 (top 5):
- 1: 1.B.2, CO2 with -179.61 Gg CO2 / year (-1.1%)
- 2: 4, CH4 with 143.18 Gg CO2 / year (0.1%)
- 3: 2, CO2 with -117.10 Gg CO2 / year (-0.0%)
- 4: M.AG.ELV, N2O with -99.26 Gg CO2 / year (-0.1%)
- 5: 2, N2O with 90.36 Gg CO2 / year (0.2%)
In the third party priority scenario the following sector-gas combinations have the highest absolute impact on national total KyotoGHG (AR6GWP100) emissions in 2022 (top 5):
- 1: 1.B.2, CH4 with -51441.34 Gg CO2 / year (-62.0%)
- 2: 1.A, CO2 with 46451.20 Gg CO2 / year (1.9%)
- 3: 2, CO2 with -29465.41 Gg CO2 / year (-15.3%)
- 4: 1.B.1, CO2 with -5487.48 Gg CO2 / year (-24.9%)
- 5: 3.A, CH4 with -3777.96 Gg CO2 / year (-1.7%)
In the third party priority scenario the following sector-gas combinations have the highest absolute impact on national total KyotoGHG (AR6GWP100) emissions in 1990-2022 (top 5):
- 1: 1.B.2, CH4 with -36070.44 Gg CO2 / year (-47.2%)
- 2: 2, CO2 with -28743.40 Gg CO2 / year (-13.5%)
- 3: 1.B.2, CO2 with 11241.79 Gg CO2 / year (289.6%)
- 4: M.AG.ELV, N2O with 7563.04 Gg CO2 / year (5.2%)
- 5: M.AG.ELV, CO2 with 1651.53 Gg CO2 / year (18.4%)
Notes on data changes
No country specific notes present for this changelog.
Changes by sector and gas
For each scenario and time frame the changes are displayed for all individual sectors and all individual gases. In the sector plot we use aggregate Kyoto GHGs in AR6GWP100. In the gas plot we usenational total emissions without LULUCF. ## country reported scenario
2022


1990-2022

third party scenario
2022

1990-2022

Detailed changes for the scenarios:
country reported scenario (HISTCR):
Most important changes per time frame
For 2022 the following sector-gas combinations have the highest absolute impact on national total KyotoGHG (AR6GWP100) emissions in 2022 (top 5):
- 1: 1.B.2, CO2 with -5927.00 Gg CO2 / year (-43.2%)
- 2: 4, CH4 with 4724.96 Gg CO2 / year (5.2%)
- 3: 2, CO2 with -3864.25 Gg CO2 / year (-1.7%)
- 4: M.AG.ELV, N2O with -3275.66 Gg CO2 / year (-2.5%)
- 5: 2, N2O with 2981.90 Gg CO2 / year (85.0%)
For 1990-2022 the following sector-gas combinations have the highest absolute impact on national total KyotoGHG (AR6GWP100) emissions in 1990-2022 (top 5):
- 1: 1.B.2, CO2 with -179.61 Gg CO2 / year (-1.1%)
- 2: 4, CH4 with 143.18 Gg CO2 / year (0.1%)
- 3: 2, CO2 with -117.10 Gg CO2 / year (-0.0%)
- 4: M.AG.ELV, N2O with -99.26 Gg CO2 / year (-0.1%)
- 5: 2, N2O with 90.36 Gg CO2 / year (0.2%)
Changes in the main sectors for aggregate KyotoGHG (AR6GWP100) are
- 1: Total sectoral emissions in 2022 are 2648138.60 Gg CO2 / year which is 76.7% of M.0.EL emissions. 2022 Emissions have changed by -0.2% (-4003.00 Gg CO2 / year). 1990-2022 Emissions have changed by -0.0% (-121.30 Gg CO2 / year).
- 2: Total sectoral emissions in 2022 are 317806.71 Gg CO2 / year which is 9.2% of M.0.EL emissions. 2022 Emissions have changed by -0.3% (-933.73 Gg CO2 / year). 1990-2022 Emissions have changed by -0.0% (-28.29 Gg CO2 / year).
- M.AG: Total sectoral emissions in 2022 are 379028.69 Gg CO2 / year which is 11.0% of M.0.EL emissions. 2022 Emissions have changed by -1.7% (-6407.20 Gg CO2 / year). 1990-2022 Emissions have changed by -0.0% (-194.16 Gg CO2 / year).
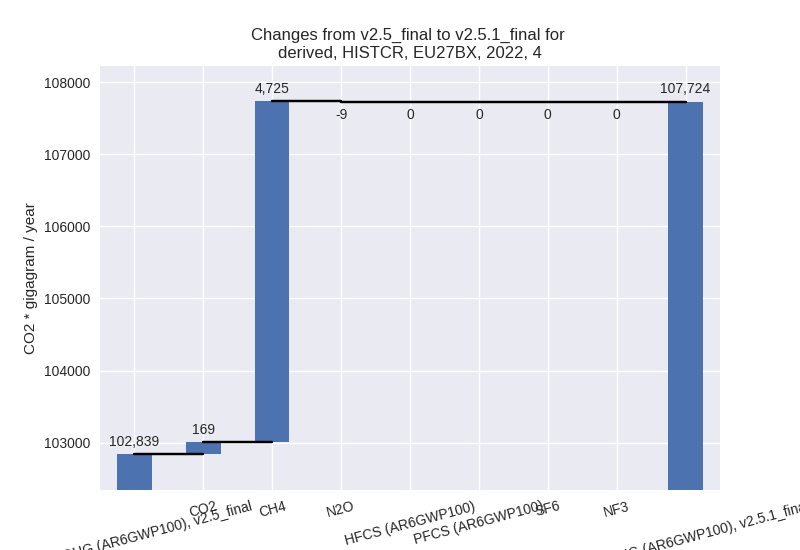
- 4: Total sectoral emissions in 2022 are 107724.38
Gg CO2 / year which is 3.1% of M.0.EL emissions. 2022 Emissions have
changed by 4.8% (4884.96 Gg CO2 /
year). 1990-2022 Emissions have changed by 0.1% (148.03 Gg CO2 / year). For 2022 the
changes per gas
are:
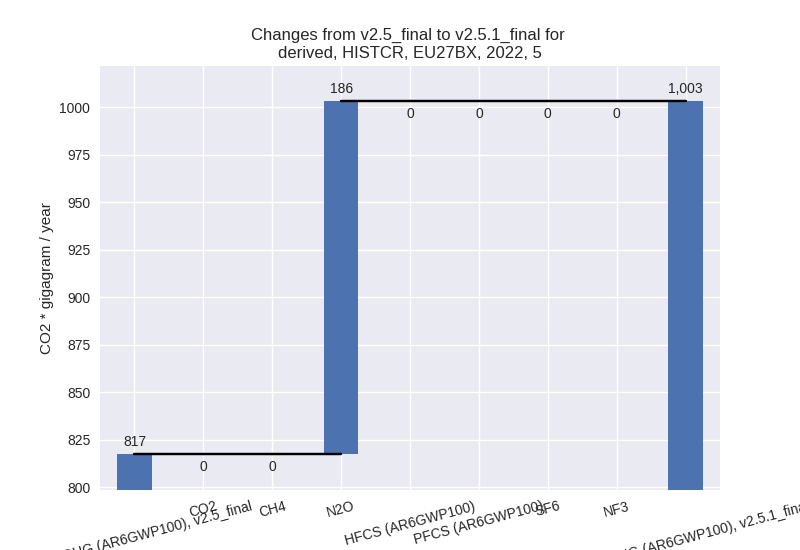
- 5: Total sectoral emissions in 2022 are 1003.08 Gg
CO2 / year which is 0.0% of M.0.EL emissions. 2022 Emissions have
changed by 22.7% (185.76 Gg CO2 /
year). 1990-2022 Emissions have changed by 0.3% (5.63 Gg CO2 / year). For 2022 the
changes per gas
are:
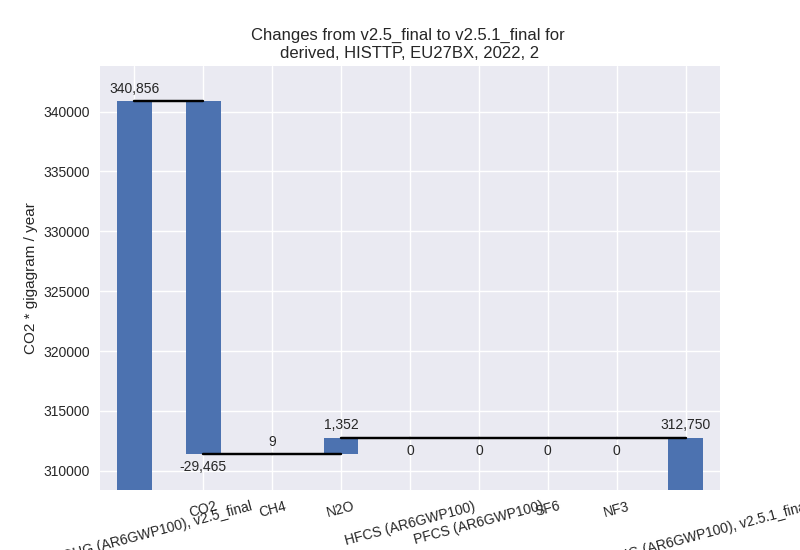
third party scenario (HISTTP):
Most important changes per time frame
For 2022 the following sector-gas combinations have the highest absolute impact on national total KyotoGHG (AR6GWP100) emissions in 2022 (top 5):
- 1: 1.B.2, CH4 with -51441.34 Gg CO2 / year (-62.0%)
- 2: 1.A, CO2 with 46451.20 Gg CO2 / year (1.9%)
- 3: 2, CO2 with -29465.41 Gg CO2 / year (-15.3%)
- 4: 1.B.1, CO2 with -5487.48 Gg CO2 / year (-24.9%)
- 5: 3.A, CH4 with -3777.96 Gg CO2 / year (-1.7%)
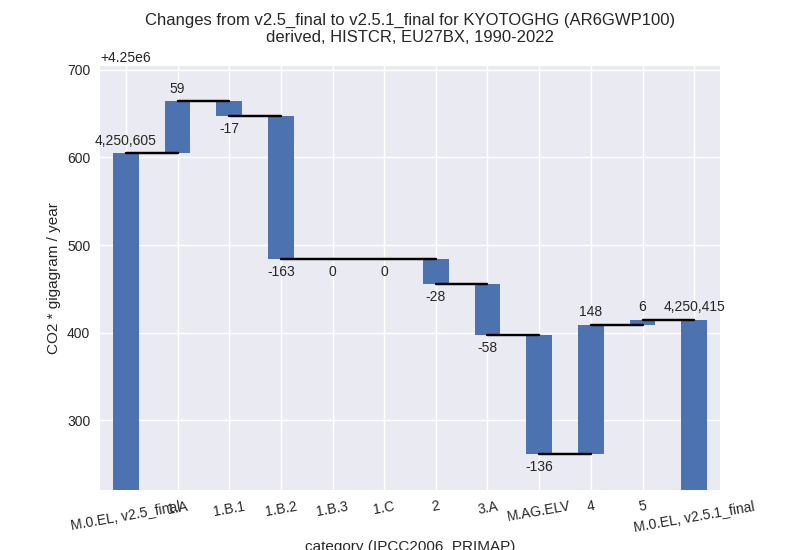
For 1990-2022 the following sector-gas combinations have the highest absolute impact on national total KyotoGHG (AR6GWP100) emissions in 1990-2022 (top 5):
- 1: 1.B.2, CH4 with -36070.44 Gg CO2 / year (-47.2%)
- 2: 2, CO2 with -28743.40 Gg CO2 / year (-13.5%)
- 3: 1.B.2, CO2 with 11241.79 Gg CO2 / year (289.6%)
- 4: M.AG.ELV, N2O with 7563.04 Gg CO2 / year (5.2%)
- 5: M.AG.ELV, CO2 with 1651.53 Gg CO2 / year (18.4%)
Changes in the main sectors for aggregate KyotoGHG (AR6GWP100) are
- 1: Total sectoral emissions in 2022 are 2663616.30 Gg CO2 / year which is 75.1% of M.0.EL emissions. 2022 Emissions have changed by -0.2% (-6479.10 Gg CO2 / year). 1990-2022 Emissions have changed by -0.8% (-26285.56 Gg CO2 / year).
- 2: Total sectoral emissions in 2022 are 312750.45
Gg CO2 / year which is 8.8% of M.0.EL emissions. 2022 Emissions have
changed by -8.2% (-28105.23 Gg CO2 /
year). 1990-2022 Emissions have changed by -7.3% (-27561.29 Gg CO2 / year). For 2022
the changes per gas
are:
For 1990-2022 the changes per gas are: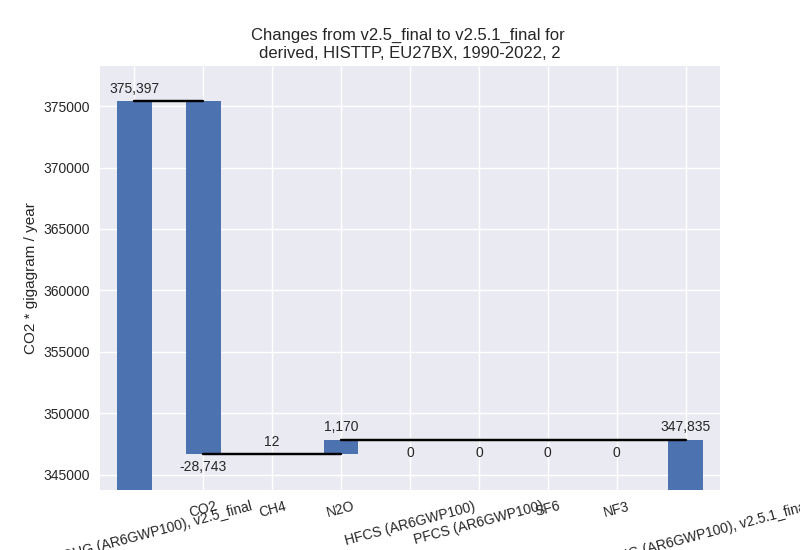
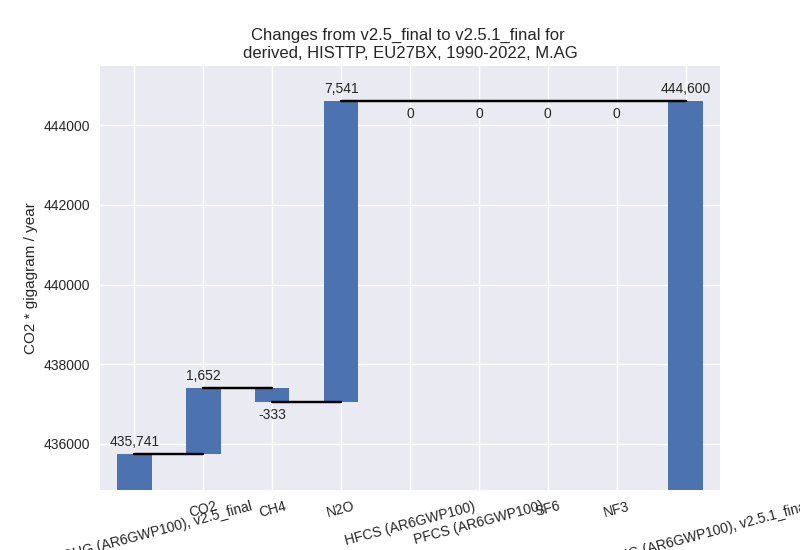
- M.AG: Total sectoral emissions in 2022 are
400179.17 Gg CO2 / year which is 11.3% of M.0.EL emissions. 2022
Emissions have changed by -0.5%
(-2112.77 Gg CO2 / year). 1990-2022 Emissions have changed by 2.0% (8859.28 Gg CO2 / year). For
1990-2022 the changes per gas
are:
The changes come from the following subsectors:- 3.A: Total sectoral emissions in 2022 are 241862.07 Gg CO2 / year which is 60.4% of category M.AG emissions. 2022 Emissions have changed by -1.7% (-4063.75 Gg CO2 / year). 1990-2022 Emissions have changed by -0.1% (-333.44 Gg CO2 / year).
- M.AG.ELV: Total sectoral emissions in 2022 are
158317.11 Gg CO2 / year which is 39.6% of category M.AG emissions. 2022
Emissions have changed by 1.2%
(1950.99 Gg CO2 / year). 1990-2022 Emissions have changed by 5.7% (9192.72 Gg CO2 / year). For
1990-2022 the changes per gas
are:

There is no subsector information available in PRIMAP-hist.
- 4: Total sectoral emissions in 2022 are 162725.41 Gg CO2 / year which is 4.6% of M.0.EL emissions. 2022 Emissions have changed by 1.9% (2973.75 Gg CO2 / year). 1990-2022 Emissions have changed by 0.0% (90.11 Gg CO2 / year).
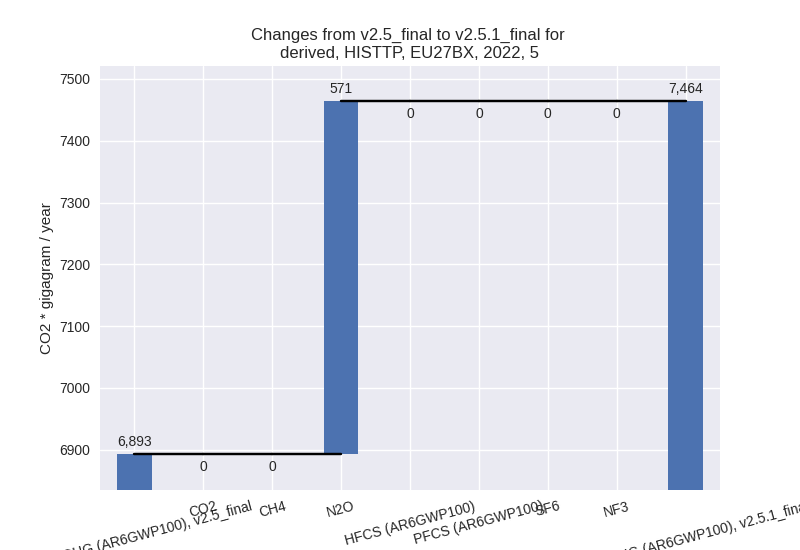
- 5: Total sectoral emissions in 2022 are 7463.74 Gg
CO2 / year which is 0.2% of M.0.EL emissions. 2022 Emissions have
changed by 8.3% (570.92 Gg CO2 /
year). 1990-2022 Emissions have changed by 0.1% (17.30 Gg CO2 / year). For 2022 the
changes per gas
are: