Changes in PRIMAP-hist v2.5.1_final compared to v2.5_final for Finland
2024-02-29
Johannes Gütschow
Change analysis for Finland for PRIMAP-hist v2.5.1_final compared to v2.5_final
Overview over emissions by sector and gas
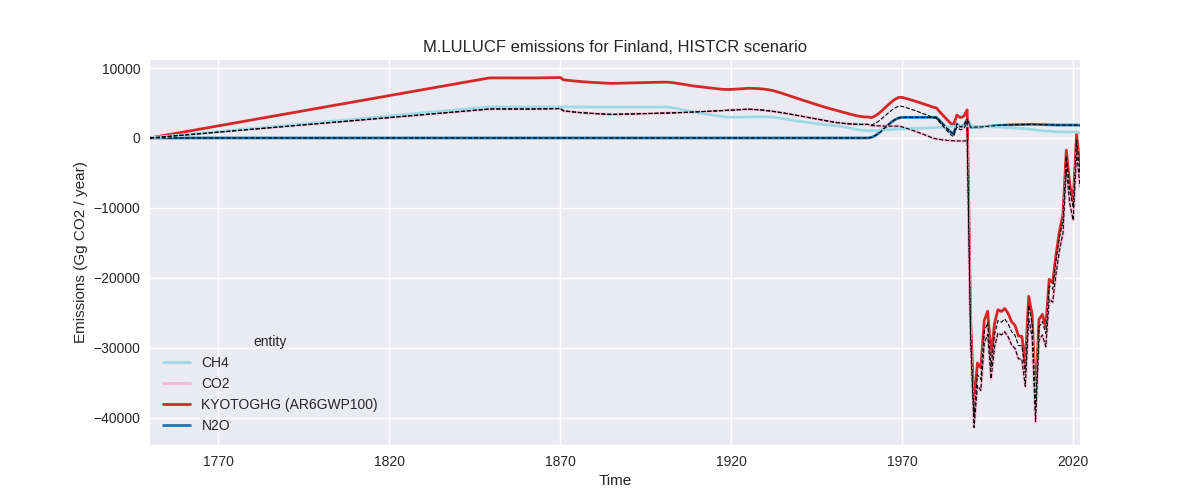
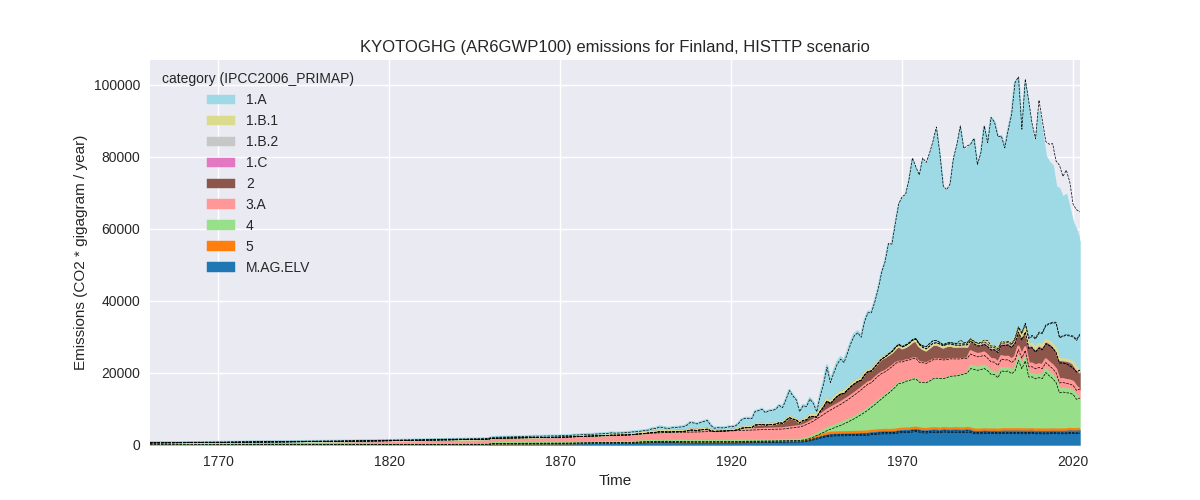
The following figures show the aggregate national total emissions excluding LULUCF AR6GWP100 for the country reported priority scenario. The dotted linesshow the v2.5_final data.


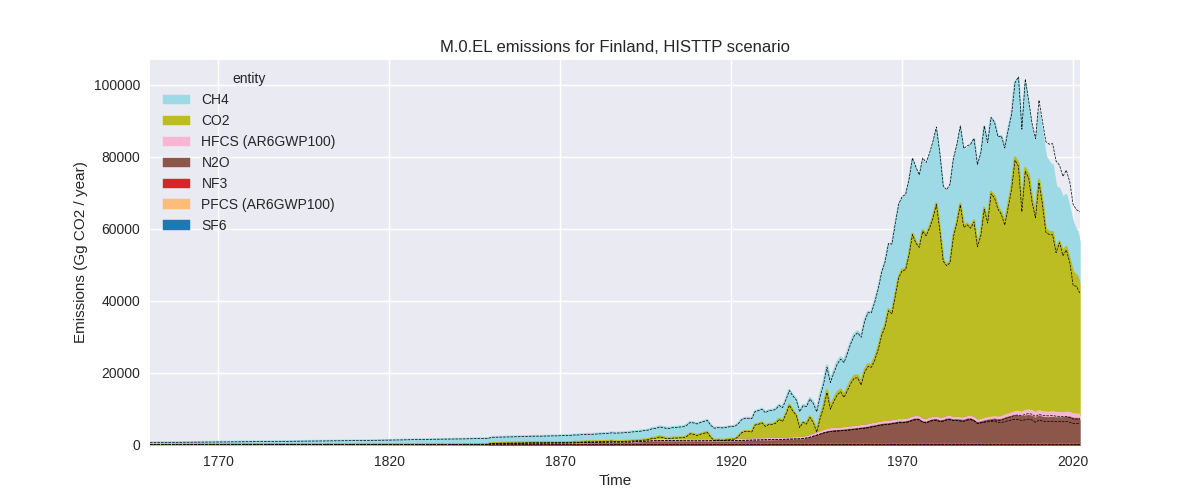
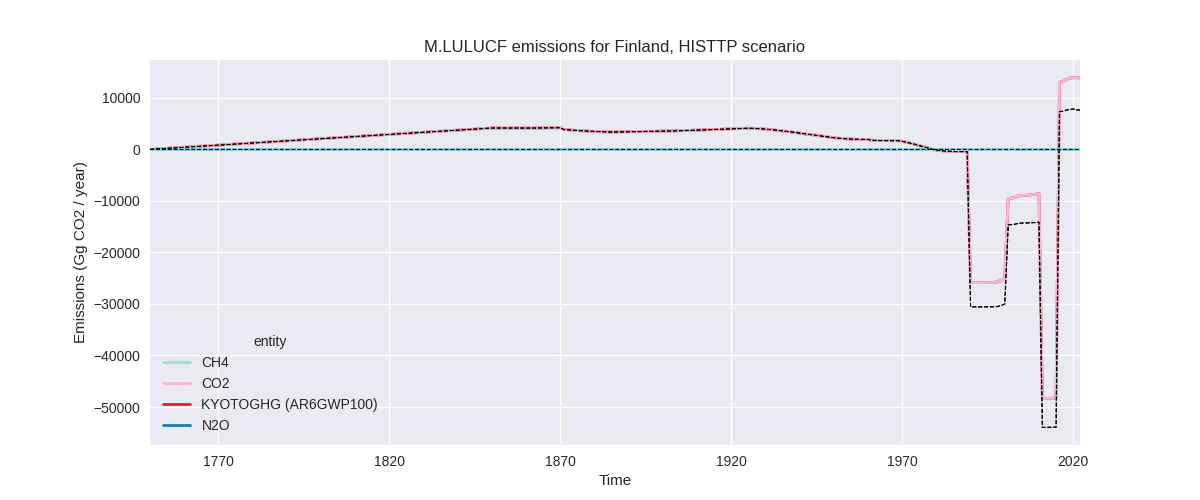
The following figures show the aggregate national total emissions excluding LULUCF AR6GWP100 for the third party priority scenario. The dotted linesshow the v2.5_final data.
Overview over changes
In the country reported priority scenario we have the following changes for aggregate Kyoto GHG and national total emissions excluding LULUCF (M.0.EL):
- Emissions in 2022 have changed by 0.3%% (137.92 Gg CO2 / year)
- Emissions in 1990-2022 have changed by 0.0%% (4.18 Gg CO2 / year)
In the third party priority scenario we have the following changes for aggregate Kyoto GHG and national total emissions excluding LULUCF (M.0.EL):
- Emissions in 2022 have changed by -12.7%% (-8222.38 Gg CO2 / year)
- Emissions in 1990-2022 have changed by -3.1%% (-2611.43 Gg CO2 / year)
Most important changes per scenario and time frame
In the country reported priority scenario the following sector-gas combinations have the highest absolute impact on national total KyotoGHG (AR6GWP100) emissions in 2022 (top 5):
- 1: 2, N2O with 224.28 Gg CO2 / year (1207.2%)
- 2: 3.A, CH4 with -123.58 Gg CO2 / year (-4.3%)
- 3: M.AG.ELV, N2O with 43.80 Gg CO2 / year (1.3%)
- 4: 1.A, N2O with 22.78 Gg CO2 / year (4.6%)
- 5: 1.B.2, CO2 with -20.37 Gg CO2 / year (-23.0%)
In the country reported priority scenario the following sector-gas combinations have the highest absolute impact on national total KyotoGHG (AR6GWP100) emissions in 1990-2022 (top 5):
- 1: 2, N2O with 6.80 Gg CO2 / year (0.8%)
- 2: 3.A, CH4 with -3.74 Gg CO2 / year (-0.1%)
- 3: M.AG.ELV, N2O with 1.33 Gg CO2 / year (0.0%)
- 4: 1.A, N2O with 0.69 Gg CO2 / year (0.1%)
- 5: 1.B.2, CO2 with -0.62 Gg CO2 / year (-0.7%)
In the third party priority scenario the following sector-gas combinations have the highest absolute impact on national total KyotoGHG (AR6GWP100) emissions in 2022 (top 5):
- 1: 1.B.2, CH4 with -9719.08 Gg CO2 / year (-99.2%)
- 2: 1.A, CO2 with 2181.30 Gg CO2 / year (6.9%)
- 3: 4, CH4 with -1176.69 Gg CO2 / year (-12.4%)
- 4: M.AG.ELV, N2O with 1065.99 Gg CO2 / year (33.8%)
- 5: 2, CO2 with -543.97 Gg CO2 / year (-18.5%)
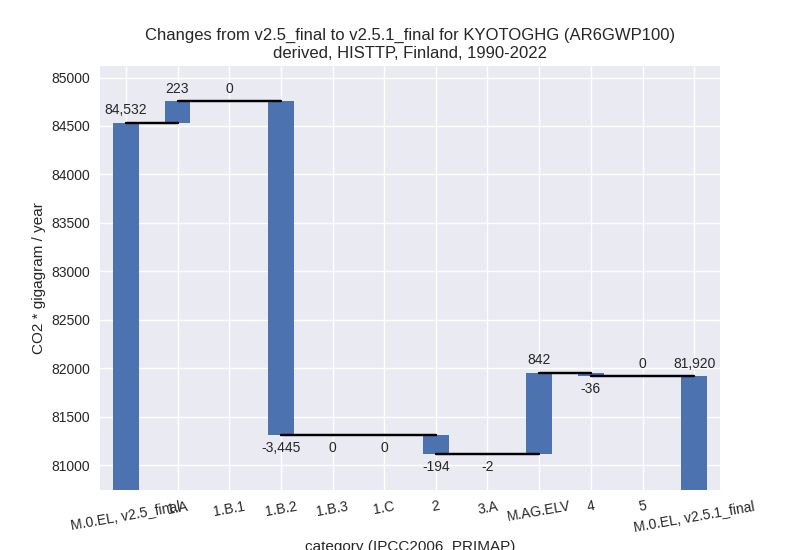
In the third party priority scenario the following sector-gas combinations have the highest absolute impact on national total KyotoGHG (AR6GWP100) emissions in 1990-2022 (top 5):
- 1: 1.B.2, CH4 with -3445.23 Gg CO2 / year (-98.4%)
- 2: M.AG.ELV, N2O with 841.57 Gg CO2 / year (26.7%)
- 3: 1.A, CO2 with 238.10 Gg CO2 / year (0.5%)
- 4: 2, CO2 with -224.90 Gg CO2 / year (-9.9%)
- 5: 4, CH4 with -35.66 Gg CO2 / year (-0.2%)
Notes on data changes
Here we list notes explaining important emissions changes for the country. ’' means that the following text only applies to the TP time series, while means that it only applies to the CR scenario. Otherwise the note applies to both scenarios.
- 2, N2O: 2022 Emissions are much higher because we now use EDGAR 8.0 2021 to 2022 growth rates instead of numerical extrapolation which factored in the steep emissions decline in 2010.
- 1.B.2, CH4: EDGAR 8.0 emissions are below 1% of emissions in EDGAR 7.0
- 1.A, CO2: The new CDIAC data changes emissions in the latest years.
- 4, CH4: EDGAR data replace extrapolation for 2022.
- M.AG.ELV, N2O: /TP/ New FAO data are higher post 1990.
Changes by sector and gas
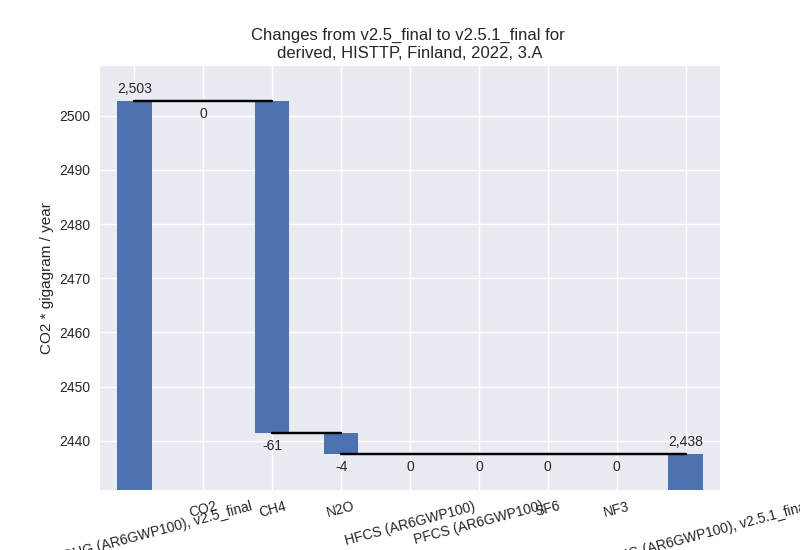
For each scenario and time frame the changes are displayed for all individual sectors and all individual gases. In the sector plot we use aggregate Kyoto GHGs in AR6GWP100. In the gas plot we usenational total emissions without LULUCF. ## country reported scenario
2022

1990-2022

third party scenario
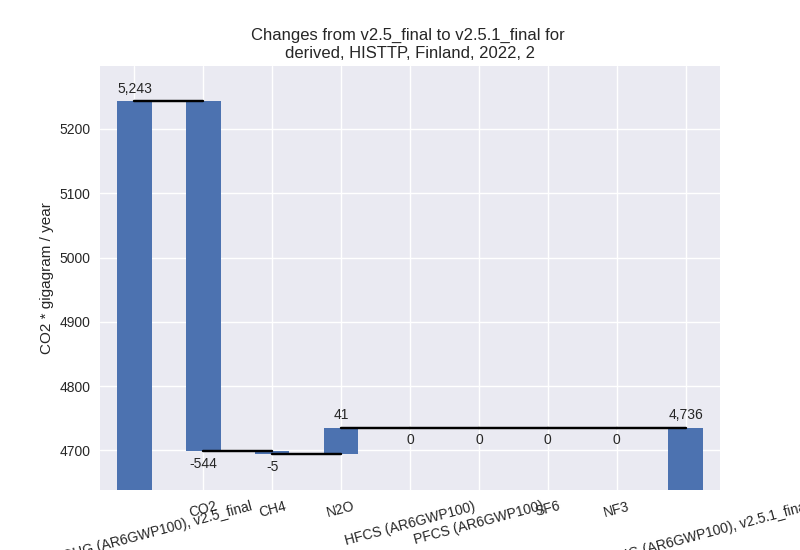
2022
1990-2022

Detailed changes for the scenarios:
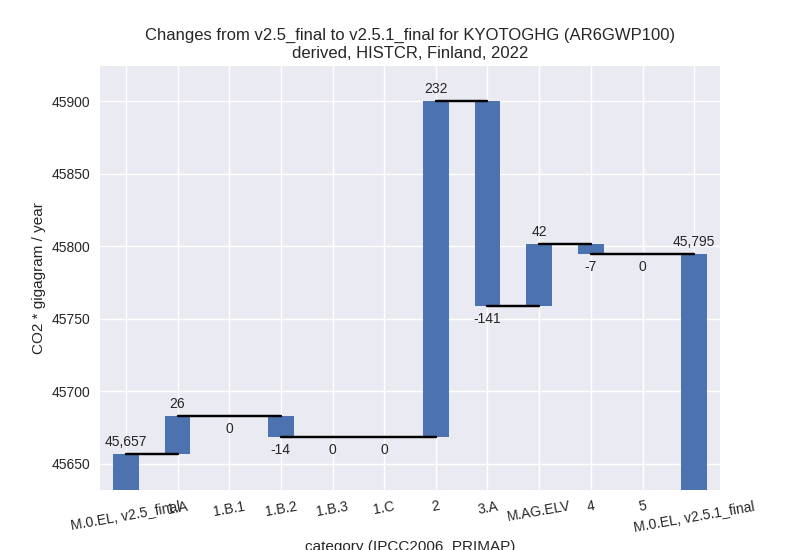
country reported scenario (HISTCR):
Most important changes per time frame
For 2022 the following sector-gas combinations have the highest absolute impact on national total KyotoGHG (AR6GWP100) emissions in 2022 (top 5):
- 1: 2, N2O with 224.28 Gg CO2 / year (1207.2%)
- 2: 3.A, CH4 with -123.58 Gg CO2 / year (-4.3%)
- 3: M.AG.ELV, N2O with 43.80 Gg CO2 / year (1.3%)
- 4: 1.A, N2O with 22.78 Gg CO2 / year (4.6%)
- 5: 1.B.2, CO2 with -20.37 Gg CO2 / year (-23.0%)
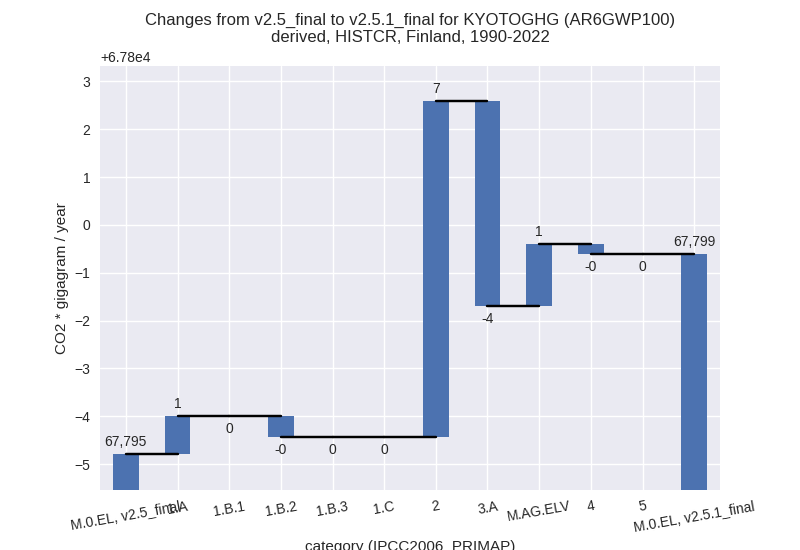
For 1990-2022 the following sector-gas combinations have the highest absolute impact on national total KyotoGHG (AR6GWP100) emissions in 1990-2022 (top 5):
- 1: 2, N2O with 6.80 Gg CO2 / year (0.8%)
- 2: 3.A, CH4 with -3.74 Gg CO2 / year (-0.1%)
- 3: M.AG.ELV, N2O with 1.33 Gg CO2 / year (0.0%)
- 4: 1.A, N2O with 0.69 Gg CO2 / year (0.1%)
- 5: 1.B.2, CO2 with -0.62 Gg CO2 / year (-0.7%)
Changes in the main sectors for aggregate KyotoGHG (AR6GWP100) are
- 1: Total sectoral emissions in 2022 are 32409.47 Gg CO2 / year which is 70.8% of M.0.EL emissions. 2022 Emissions have changed by 0.0% (11.91 Gg CO2 / year). 1990-2022 Emissions have changed by 0.0% (0.36 Gg CO2 / year).
- 2: Total sectoral emissions in 2022 are 5344.00 Gg
CO2 / year which is 11.7% of M.0.EL emissions. 2022 Emissions have
changed by 4.5% (231.62 Gg CO2 /
year). 1990-2022 Emissions have changed by 0.1% (7.02 Gg CO2 / year). For 2022 the
changes per gas
are:

- M.AG: Total sectoral emissions in 2022 are 6374.81 Gg CO2 / year which is 13.9% of M.0.EL emissions. 2022 Emissions have changed by -1.5% (-98.69 Gg CO2 / year). 1990-2022 Emissions have changed by -0.0% (-2.99 Gg CO2 / year).
- 4: Total sectoral emissions in 2022 are 1666.22 Gg CO2 / year which is 3.6% of M.0.EL emissions. 2022 Emissions have changed by -0.4% (-6.92 Gg CO2 / year). 1990-2022 Emissions have changed by -0.0% (-0.21 Gg CO2 / year).
- 5: No data
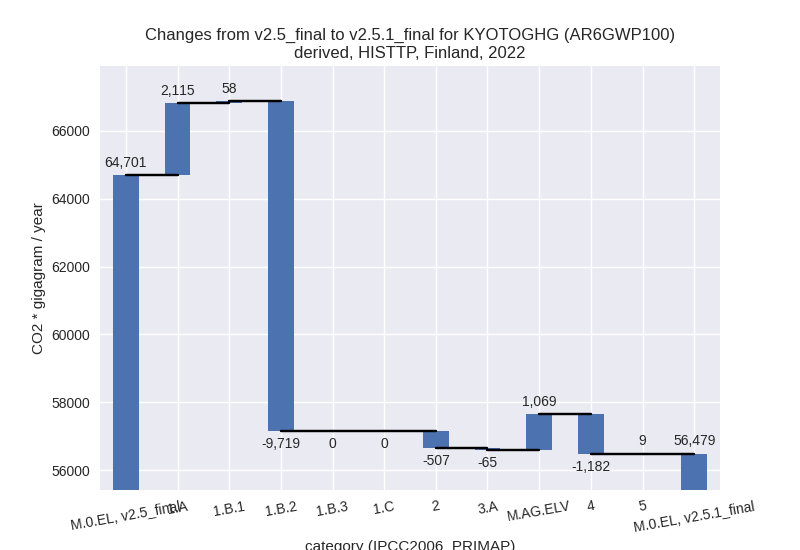
third party scenario (HISTTP):
Most important changes per time frame
For 2022 the following sector-gas combinations have the highest absolute impact on national total KyotoGHG (AR6GWP100) emissions in 2022 (top 5):
- 1: 1.B.2, CH4 with -9719.08 Gg CO2 / year (-99.2%)
- 2: 1.A, CO2 with 2181.30 Gg CO2 / year (6.9%)
- 3: 4, CH4 with -1176.69 Gg CO2 / year (-12.4%)
- 4: M.AG.ELV, N2O with 1065.99 Gg CO2 / year (33.8%)
- 5: 2, CO2 with -543.97 Gg CO2 / year (-18.5%)
For 1990-2022 the following sector-gas combinations have the highest absolute impact on national total KyotoGHG (AR6GWP100) emissions in 1990-2022 (top 5):
- 1: 1.B.2, CH4 with -3445.23 Gg CO2 / year (-98.4%)
- 2: M.AG.ELV, N2O with 841.57 Gg CO2 / year (26.7%)
- 3: 1.A, CO2 with 238.10 Gg CO2 / year (0.5%)
- 4: 2, CO2 with -224.90 Gg CO2 / year (-9.9%)
- 5: 4, CH4 with -35.66 Gg CO2 / year (-0.2%)
Changes in the main sectors for aggregate KyotoGHG (AR6GWP100) are
- 1: Total sectoral emissions in 2022 are 36352.25 Gg
CO2 / year which is 64.4% of M.0.EL emissions. 2022 Emissions have
changed by -17.2% (-7545.78 Gg CO2 /
year). 1990-2022 Emissions have changed by -5.5% (-3221.97 Gg CO2 / year). For 2022
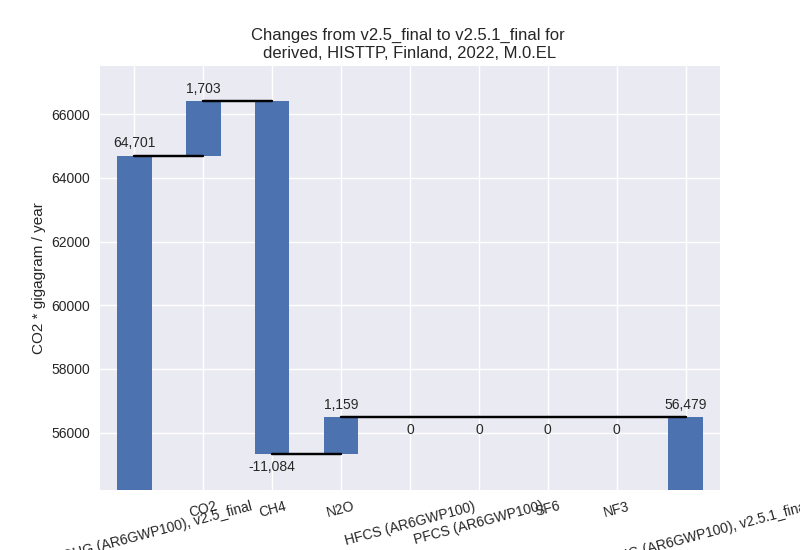
the changes per gas
are:

For 1990-2022 the changes per gas are: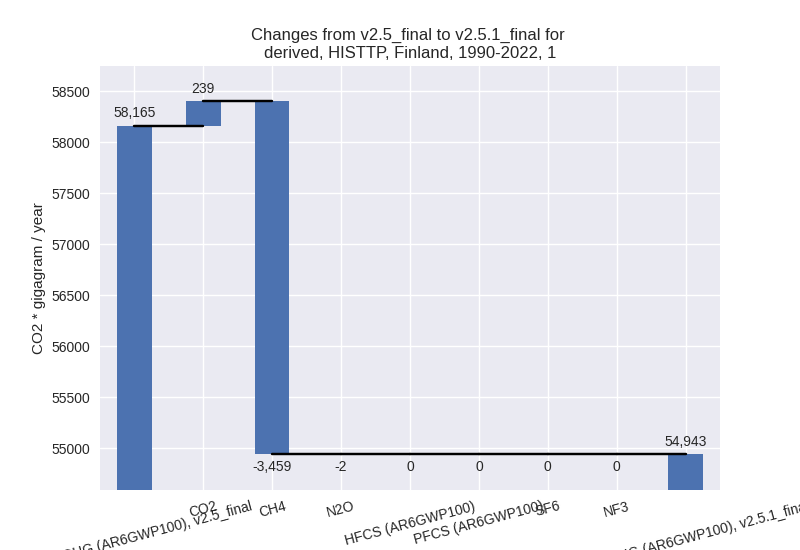
The changes come from the following subsectors:- 1.A: Total sectoral emissions in 2022 are 36002.81
Gg CO2 / year which is 99.0% of category 1 emissions. 2022 Emissions
have changed by 6.2% (2115.37 Gg CO2
/ year). 1990-2022 Emissions have changed by 0.4% (223.00 Gg CO2 / year). For 2022 the
changes per gas
are:

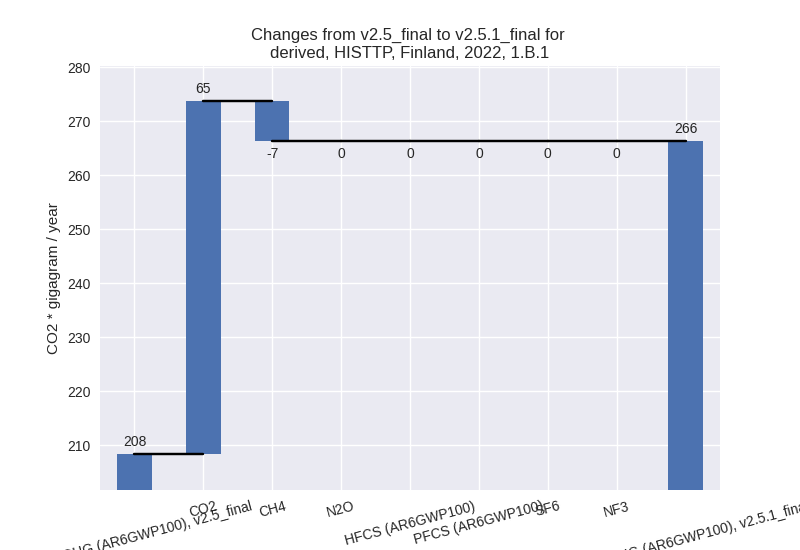
There is no subsector information available in PRIMAP-hist. - 1.B.1: Total sectoral emissions in 2022 are 266.27
Gg CO2 / year which is 0.7% of category 1 emissions. 2022 Emissions have
changed by 27.8% (57.93 Gg CO2 /
year). 1990-2022 Emissions have changed by 0.1% (0.26 Gg CO2 / year). For 2022 the
changes per gas
are:
There is no subsector information available in PRIMAP-hist. - 1.B.2: Total sectoral emissions in 2022 are 83.16
Gg CO2 / year which is 0.2% of category 1 emissions. 2022 Emissions have
changed by -99.2% (-9719.08 Gg CO2 /
year). 1990-2022 Emissions have changed by -98.1% (-3445.23 Gg CO2 / year). For 2022
the changes per gas
are:

For 1990-2022 the changes per gas are: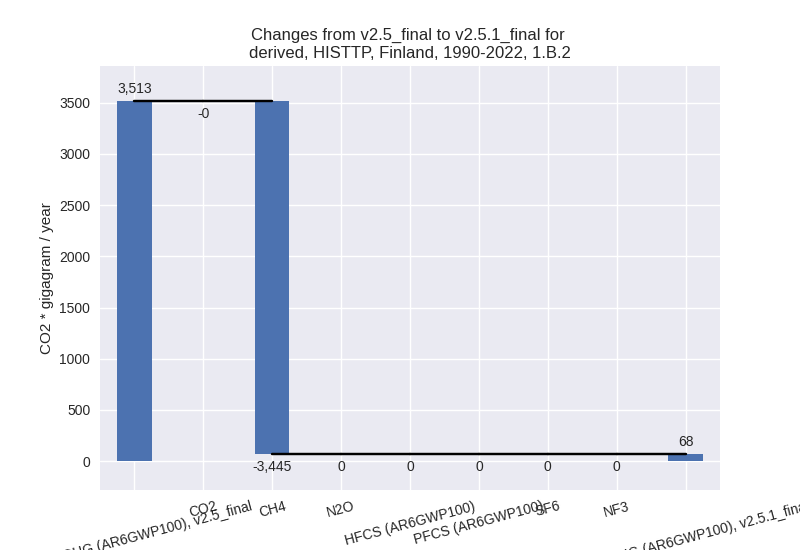
There is no subsector information available in PRIMAP-hist.
- 1.A: Total sectoral emissions in 2022 are 36002.81
Gg CO2 / year which is 99.0% of category 1 emissions. 2022 Emissions
have changed by 6.2% (2115.37 Gg CO2
/ year). 1990-2022 Emissions have changed by 0.4% (223.00 Gg CO2 / year). For 2022 the
changes per gas
are:
- 2: Total sectoral emissions in 2022 are 4735.68 Gg
CO2 / year which is 8.4% of M.0.EL emissions. 2022 Emissions have
changed by -9.7% (-507.22 Gg CO2 /
year). 1990-2022 Emissions have changed by -4.3% (-194.08 Gg CO2 / year). For 2022
the changes per gas
are:
For 1990-2022 the changes per gas are: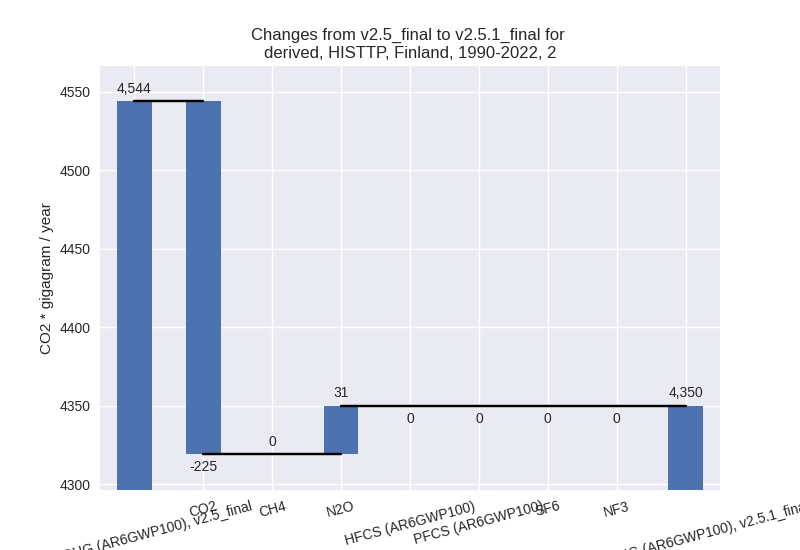
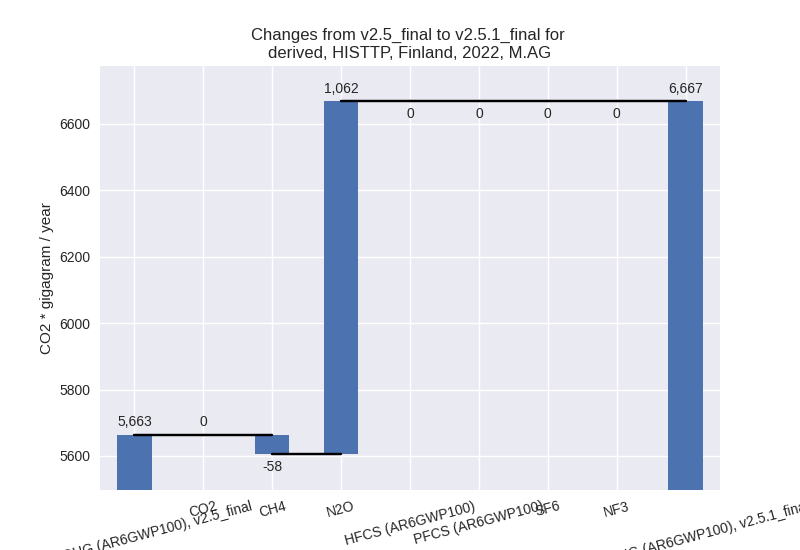
- M.AG: Total sectoral emissions in 2022 are 6667.35
Gg CO2 / year which is 11.8% of M.0.EL emissions. 2022 Emissions have
changed by 17.7% (1004.10 Gg CO2 /
year). 1990-2022 Emissions have changed by 13.6% (840.19 Gg CO2 / year). For 2022 the
changes per gas
are:
For 1990-2022 the changes per gas are: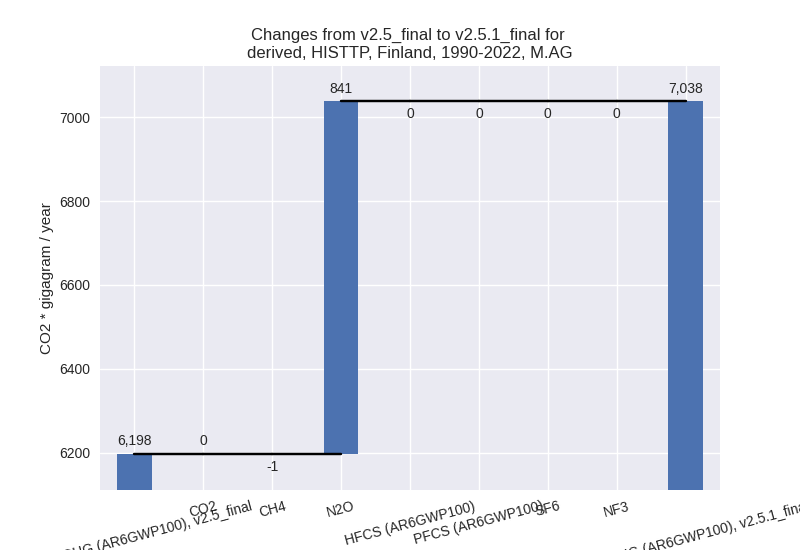
The changes come from the following subsectors:- 3.A: Total sectoral emissions in 2022 are 2437.52
Gg CO2 / year which is 36.6% of category M.AG emissions. 2022 Emissions
have changed by -2.6% (-65.14 Gg CO2
/ year). 1990-2022 Emissions have changed by -0.1% (-1.55 Gg CO2 / year). For 2022 the
changes per gas
are:
There is no subsector information available in PRIMAP-hist. - M.AG.ELV: Total sectoral emissions in 2022 are
4229.83 Gg CO2 / year which is 63.4% of category M.AG emissions. 2022
Emissions have changed by 33.8%
(1069.23 Gg CO2 / year). 1990-2022 Emissions have changed by 26.7% (841.74 Gg CO2 / year). For 2022 the
changes per gas
are:

For 1990-2022 the changes per gas are:
There is no subsector information available in PRIMAP-hist.
- 3.A: Total sectoral emissions in 2022 are 2437.52
Gg CO2 / year which is 36.6% of category M.AG emissions. 2022 Emissions
have changed by -2.6% (-65.14 Gg CO2
/ year). 1990-2022 Emissions have changed by -0.1% (-1.55 Gg CO2 / year). For 2022 the
changes per gas
are:
- 4: Total sectoral emissions in 2022 are 8501.02 Gg
CO2 / year which is 15.1% of M.0.EL emissions. 2022 Emissions have
changed by -12.2% (-1182.15 Gg CO2 /
year). 1990-2022 Emissions have changed by -0.2% (-35.82 Gg CO2 / year). For 2022 the
changes per gas
are:

- 5: Total sectoral emissions in 2022 are 222.39 Gg
CO2 / year which is 0.4% of M.0.EL emissions. 2022 Emissions have
changed by 4.1% (8.68 Gg CO2 /
year). 1990-2022 Emissions have changed by 0.1% (0.26 Gg CO2 / year). For 2022 the
changes per gas
are:
