Changes in PRIMAP-hist v2.5.1_final compared to v2.5_final for Gabon
2024-02-29
Johannes Gütschow
Change analysis for Gabon for PRIMAP-hist v2.5.1_final compared to v2.5_final
Overview over emissions by sector and gas
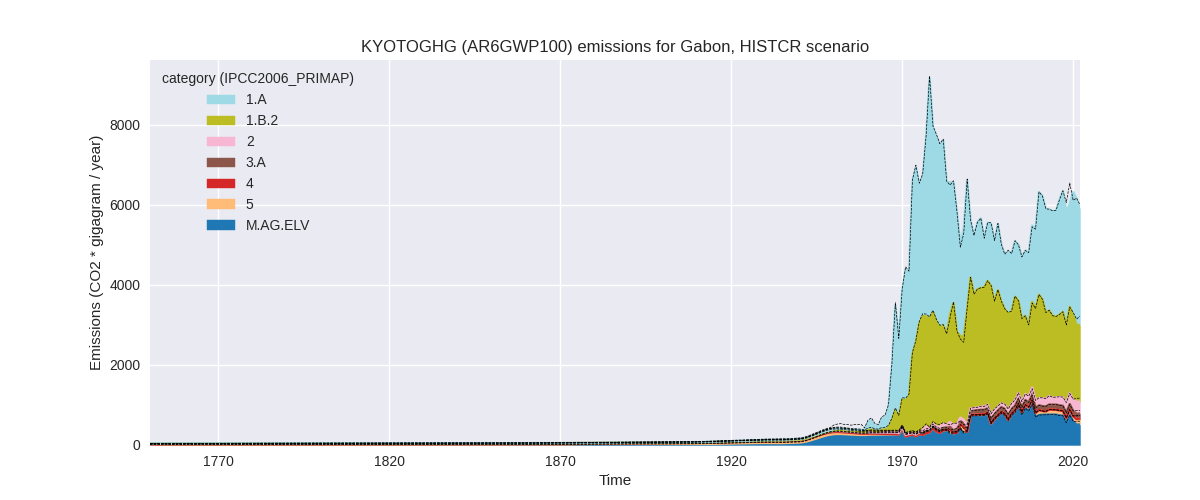
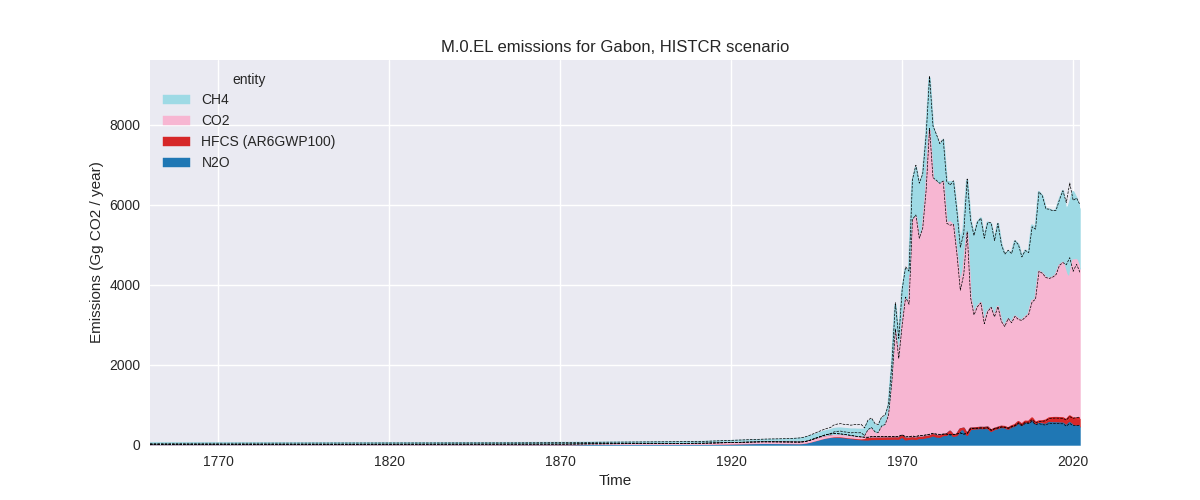
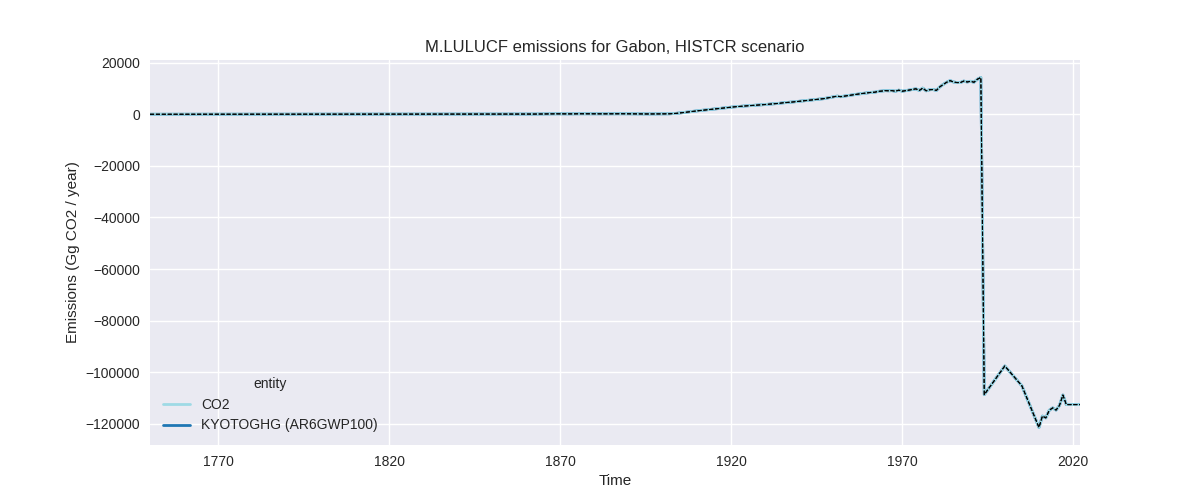
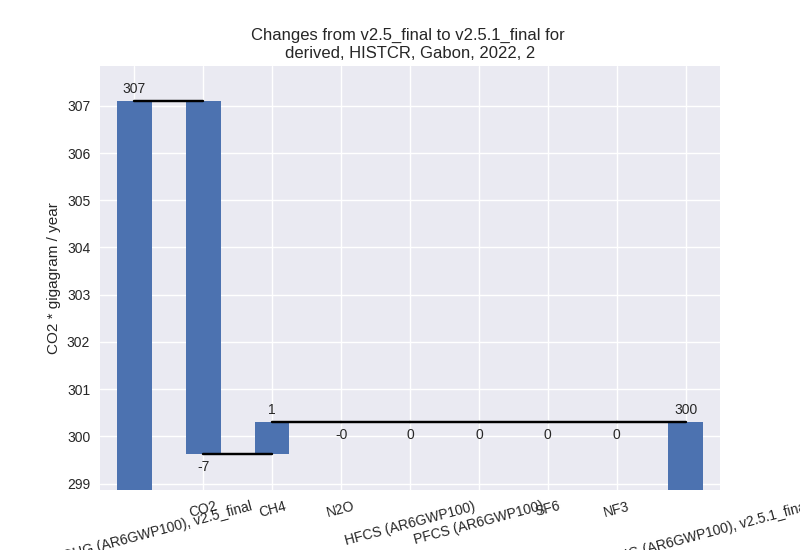
The following figures show the aggregate national total emissions excluding LULUCF AR6GWP100 for the country reported priority scenario. The dotted linesshow the v2.5_final data.
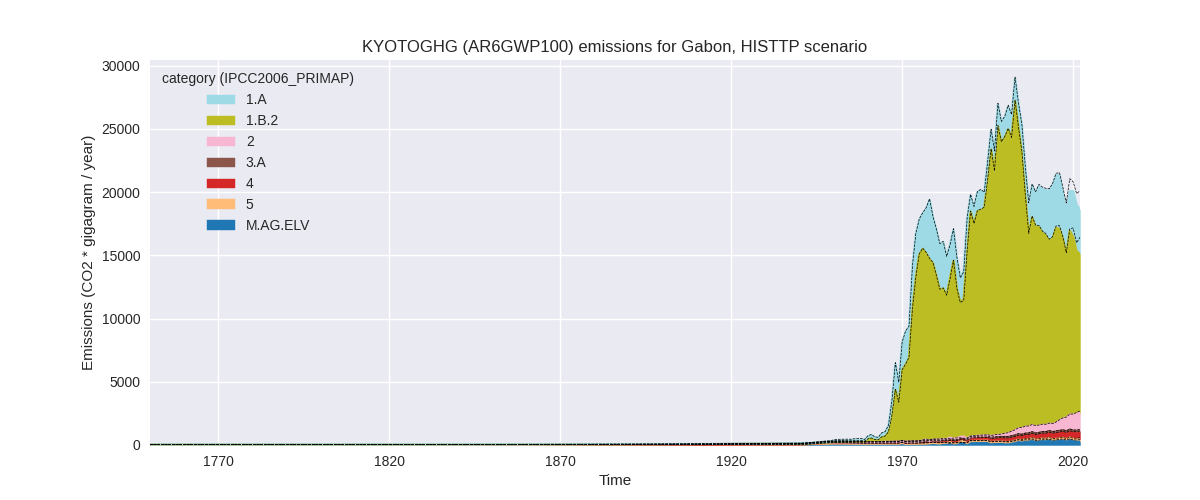
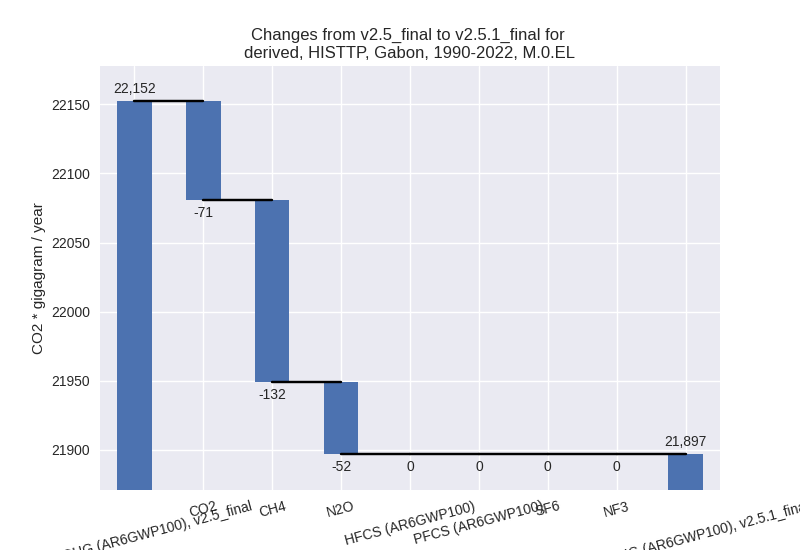
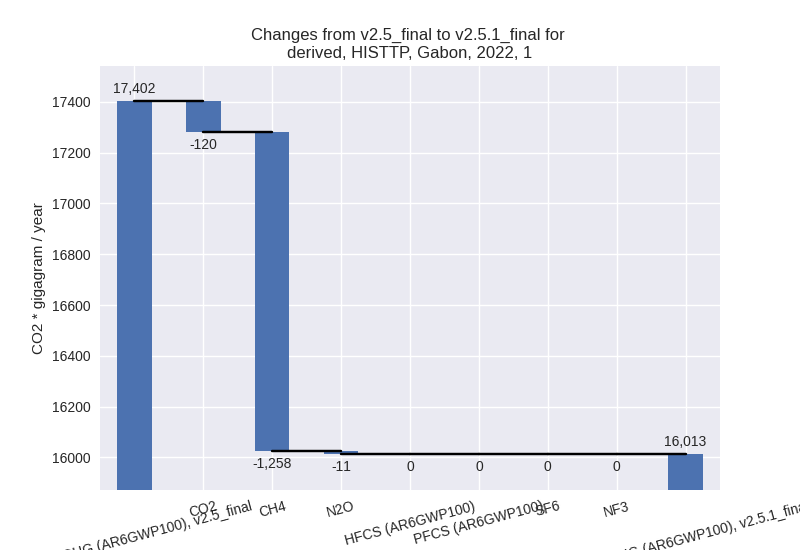
The following figures show the aggregate national total emissions excluding LULUCF AR6GWP100 for the third party priority scenario. The dotted linesshow the v2.5_final data.

Overview over changes
In the country reported priority scenario we have the following changes for aggregate Kyoto GHG and national total emissions excluding LULUCF (M.0.EL):
- Emissions in 2022 have changed by -1.7%% (-104.77 Gg CO2 / year)
- Emissions in 1990-2022 have changed by -0.5%% (-28.98 Gg CO2 / year)
In the third party priority scenario we have the following changes for aggregate Kyoto GHG and national total emissions excluding LULUCF (M.0.EL):
- Emissions in 2022 have changed by -7.6%% (-1517.79 Gg CO2 / year)
- Emissions in 1990-2022 have changed by -1.2%% (-255.36 Gg CO2 / year)
Most important changes per scenario and time frame
In the country reported priority scenario the following sector-gas combinations have the highest absolute impact on national total KyotoGHG (AR6GWP100) emissions in 2022 (top 5):
- 1: 1.B.2, CH4 with -146.22 Gg CO2 / year (-11.3%)
- 2: 1.A, CO2 with 124.05 Gg CO2 / year (4.5%)
- 3: M.AG.ELV, CH4 with -45.22 Gg CO2 / year (-16.7%)
- 4: M.AG.ELV, N2O with -40.06 Gg CO2 / year (-12.4%)
- 5: 5, N2O with 9.90 Gg CO2 / year (7.3%)
In the country reported priority scenario the following sector-gas combinations have the highest absolute impact on national total KyotoGHG (AR6GWP100) emissions in 1990-2022 (top 5):
- 1: 2, CO2 with -9.00 Gg CO2 / year (-8.7%)
- 2: 1.B.2, CH4 with -8.33 Gg CO2 / year (-0.6%)
- 3: 1.A, CO2 with -5.95 Gg CO2 / year (-0.3%)
- 4: M.AG.ELV, CH4 with -3.60 Gg CO2 / year (-1.0%)
- 5: M.AG.ELV, N2O with -2.07 Gg CO2 / year (-0.6%)
In the third party priority scenario the following sector-gas combinations have the highest absolute impact on national total KyotoGHG (AR6GWP100) emissions in 2022 (top 5):
- 1: 1.B.2, CH4 with -1222.69 Gg CO2 / year (-11.1%)
- 2: 1.A, CO2 with -165.46 Gg CO2 / year (-5.6%)
- 3: M.AG.ELV, N2O with -93.79 Gg CO2 / year (-30.9%)
- 4: 1.B.2, CO2 with 45.05 Gg CO2 / year (1.6%)
- 5: 1.A, CH4 with -35.39 Gg CO2 / year (-6.8%)
In the third party priority scenario the following sector-gas combinations have the highest absolute impact on national total KyotoGHG (AR6GWP100) emissions in 1990-2022 (top 5):
- 1: 1.B.2, CH4 with -132.71 Gg CO2 / year (-0.9%)
- 2: 1.A, CO2 with -58.48 Gg CO2 / year (-2.8%)
- 3: M.AG.ELV, N2O with -52.30 Gg CO2 / year (-20.6%)
- 4: 2, CO2 with -9.00 Gg CO2 / year (-7.4%)
- 5: 1.B.2, CO2 with -4.19 Gg CO2 / year (-0.1%)
Notes on data changes
Here we list notes explaining important emissions changes for the country. ’' means that the following text only applies to the TP time series, while means that it only applies to the CR scenario. Otherwise the note applies to both scenarios.
- 1.A, CO2: CDIAC 2023 emissions have a high emissions decrease in 2019 with a bounce-back in 2020 leading to changes in the latest years.
Changes by sector and gas
For each scenario and time frame the changes are displayed for all individual sectors and all individual gases. In the sector plot we use aggregate Kyoto GHGs in AR6GWP100. In the gas plot we usenational total emissions without LULUCF. ## country reported scenario
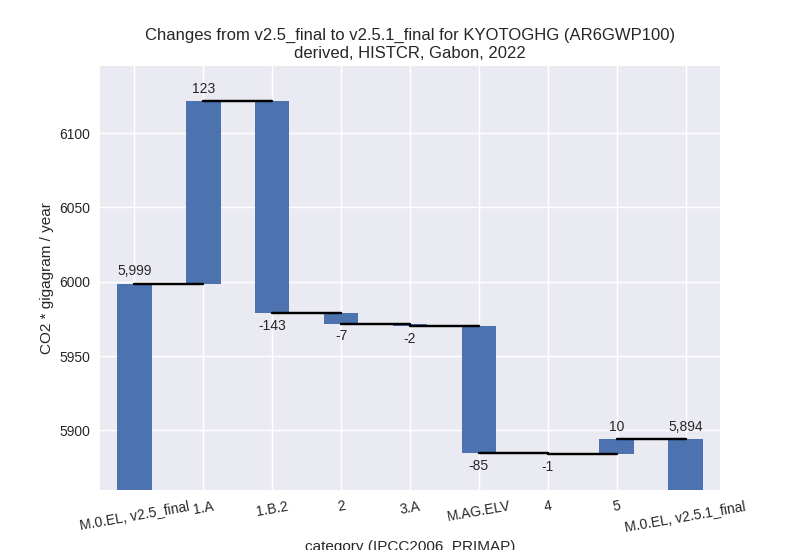
2022

1990-2022


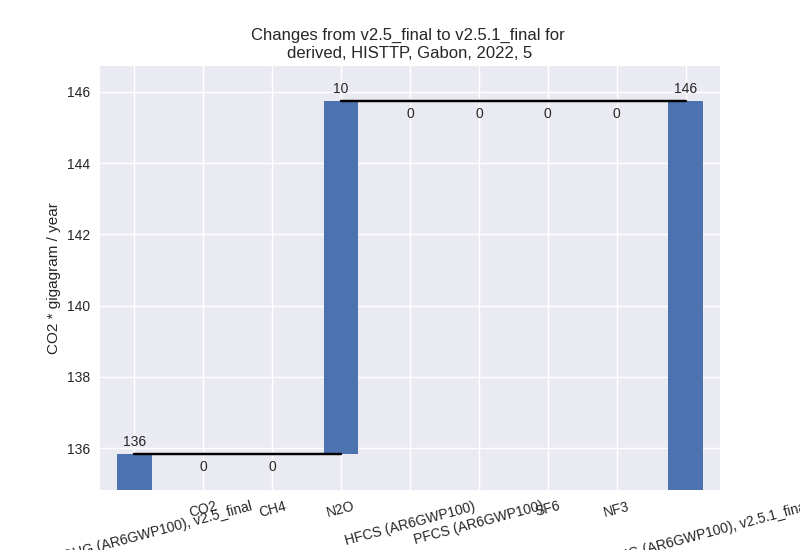
third party scenario
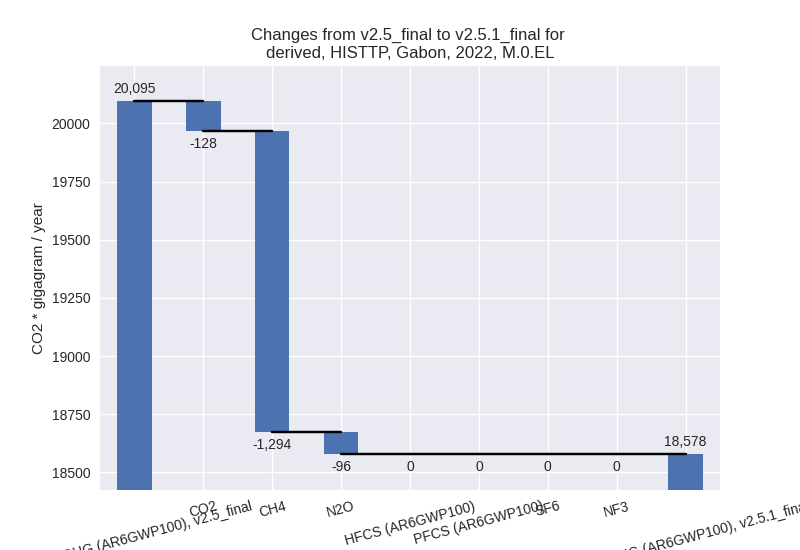
2022

1990-2022

Detailed changes for the scenarios:
country reported scenario (HISTCR):
Most important changes per time frame
For 2022 the following sector-gas combinations have the highest absolute impact on national total KyotoGHG (AR6GWP100) emissions in 2022 (top 5):
- 1: 1.B.2, CH4 with -146.22 Gg CO2 / year (-11.3%)
- 2: 1.A, CO2 with 124.05 Gg CO2 / year (4.5%)
- 3: M.AG.ELV, CH4 with -45.22 Gg CO2 / year (-16.7%)
- 4: M.AG.ELV, N2O with -40.06 Gg CO2 / year (-12.4%)
- 5: 5, N2O with 9.90 Gg CO2 / year (7.3%)
For 1990-2022 the following sector-gas combinations have the highest absolute impact on national total KyotoGHG (AR6GWP100) emissions in 1990-2022 (top 5):
- 1: 2, CO2 with -9.00 Gg CO2 / year (-8.7%)
- 2: 1.B.2, CH4 with -8.33 Gg CO2 / year (-0.6%)
- 3: 1.A, CO2 with -5.95 Gg CO2 / year (-0.3%)
- 4: M.AG.ELV, CH4 with -3.60 Gg CO2 / year (-1.0%)
- 5: M.AG.ELV, N2O with -2.07 Gg CO2 / year (-0.6%)
Changes in the main sectors for aggregate KyotoGHG (AR6GWP100) are
- 1: Total sectoral emissions in 2022 are 4807.05 Gg CO2 / year which is 81.6% of M.0.EL emissions. 2022 Emissions have changed by -0.4% (-19.92 Gg CO2 / year). 1990-2022 Emissions have changed by -0.3% (-14.68 Gg CO2 / year).
- 2: Total sectoral emissions in 2022 are 300.30 Gg
CO2 / year which is 5.1% of M.0.EL emissions. 2022 Emissions have
changed by -2.2% (-6.80 Gg CO2 /
year). 1990-2022 Emissions have changed by -5.3% (-8.80 Gg CO2 / year). For 2022 the
changes per gas
are:
For 1990-2022 the changes per gas are:
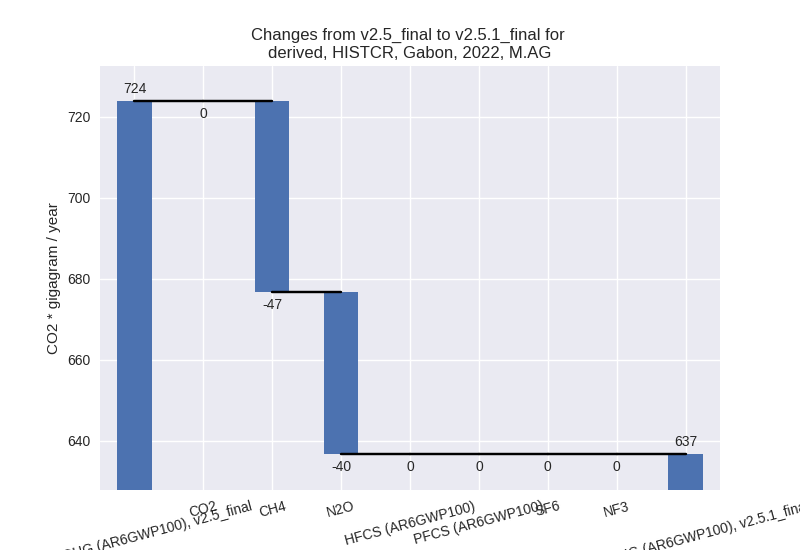
- M.AG: Total sectoral emissions in 2022 are 636.70
Gg CO2 / year which is 10.8% of M.0.EL emissions. 2022 Emissions have
changed by -12.0% (-87.07 Gg CO2 /
year). 1990-2022 Emissions have changed by -0.7% (-5.77 Gg CO2 / year). For 2022 the
changes per gas
are:
The changes come from the following subsectors:- 3.A: Total sectoral emissions in 2022 are 127.69 Gg CO2 / year which is 20.1% of category M.AG emissions. 2022 Emissions have changed by -1.4% (-1.80 Gg CO2 / year). 1990-2022 Emissions have changed by -0.1% (-0.09 Gg CO2 / year).
- M.AG.ELV: Total sectoral emissions in 2022 are
509.01 Gg CO2 / year which is 79.9% of category M.AG emissions. 2022
Emissions have changed by -14.3%
(-85.28 Gg CO2 / year). 1990-2022 Emissions have changed by -0.8% (-5.67 Gg CO2 / year). For 2022 the
changes per gas
are:

There is no subsector information available in PRIMAP-hist.
- 4: Total sectoral emissions in 2022 are 4.08 Gg CO2
/ year which is 0.1% of M.0.EL emissions. 2022 Emissions have changed by
-17.7% (-0.88 Gg CO2 / year).
1990-2022 Emissions have changed by -1.2% (-0.03 Gg CO2 / year). For 2022 the
changes per gas
are:

- 5: Total sectoral emissions in 2022 are 145.73 Gg
CO2 / year which is 2.5% of M.0.EL emissions. 2022 Emissions have
changed by 7.3% (9.90 Gg CO2 /
year). 1990-2022 Emissions have changed by 0.4% (0.30 Gg CO2 / year). For 2022 the
changes per gas
are:

third party scenario (HISTTP):
Most important changes per time frame
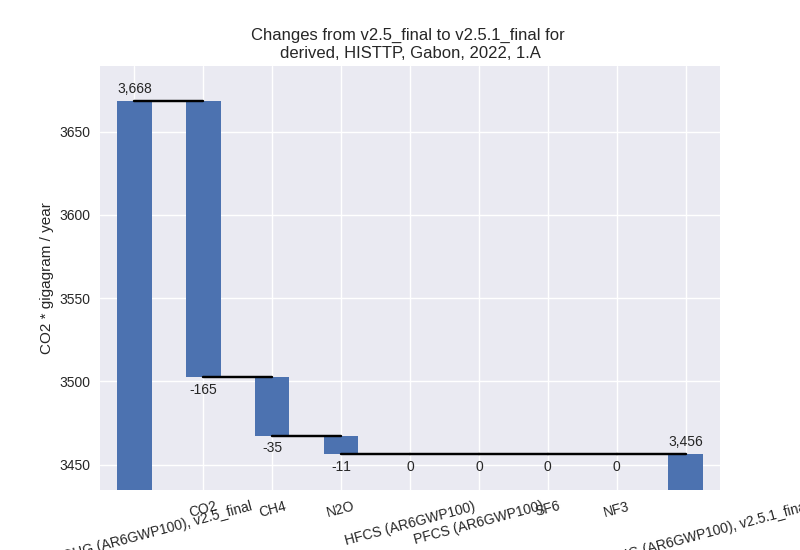
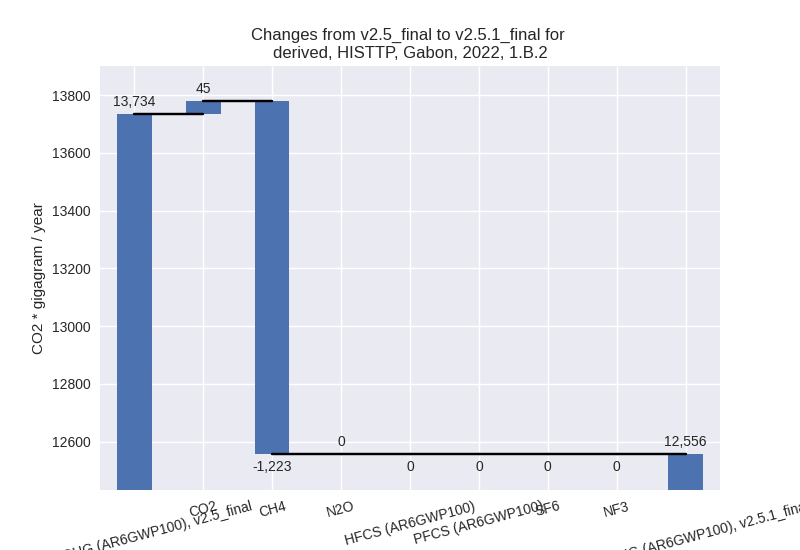
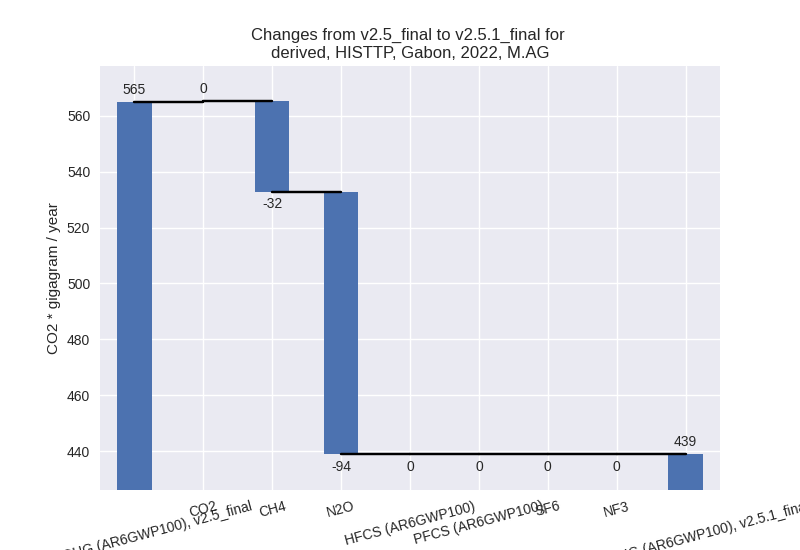
For 2022 the following sector-gas combinations have the highest absolute impact on national total KyotoGHG (AR6GWP100) emissions in 2022 (top 5):
- 1: 1.B.2, CH4 with -1222.69 Gg CO2 / year (-11.1%)
- 2: 1.A, CO2 with -165.46 Gg CO2 / year (-5.6%)
- 3: M.AG.ELV, N2O with -93.79 Gg CO2 / year (-30.9%)
- 4: 1.B.2, CO2 with 45.05 Gg CO2 / year (1.6%)
- 5: 1.A, CH4 with -35.39 Gg CO2 / year (-6.8%)
For 1990-2022 the following sector-gas combinations have the highest absolute impact on national total KyotoGHG (AR6GWP100) emissions in 1990-2022 (top 5):
- 1: 1.B.2, CH4 with -132.71 Gg CO2 / year (-0.9%)
- 2: 1.A, CO2 with -58.48 Gg CO2 / year (-2.8%)
- 3: M.AG.ELV, N2O with -52.30 Gg CO2 / year (-20.6%)
- 4: 2, CO2 with -9.00 Gg CO2 / year (-7.4%)
- 5: 1.B.2, CO2 with -4.19 Gg CO2 / year (-0.1%)
Changes in the main sectors for aggregate KyotoGHG (AR6GWP100) are
- 1: Total sectoral emissions in 2022 are 16012.53 Gg
CO2 / year which is 86.2% of M.0.EL emissions. 2022 Emissions have
changed by -8.0% (-1389.55 Gg CO2 /
year). 1990-2022 Emissions have changed by -0.9% (-193.94 Gg CO2 / year). For 2022
the changes per gas
are:
The changes come from the following subsectors:- 1.A: Total sectoral emissions in 2022 are 3456.23
Gg CO2 / year which is 21.6% of category 1 emissions. 2022 Emissions
have changed by -5.8% (-212.07 Gg
CO2 / year). 1990-2022 Emissions have changed by -2.2% (-57.02 Gg CO2 / year). For 2022 the
changes per gas
are:
For 1990-2022 the changes per gas are: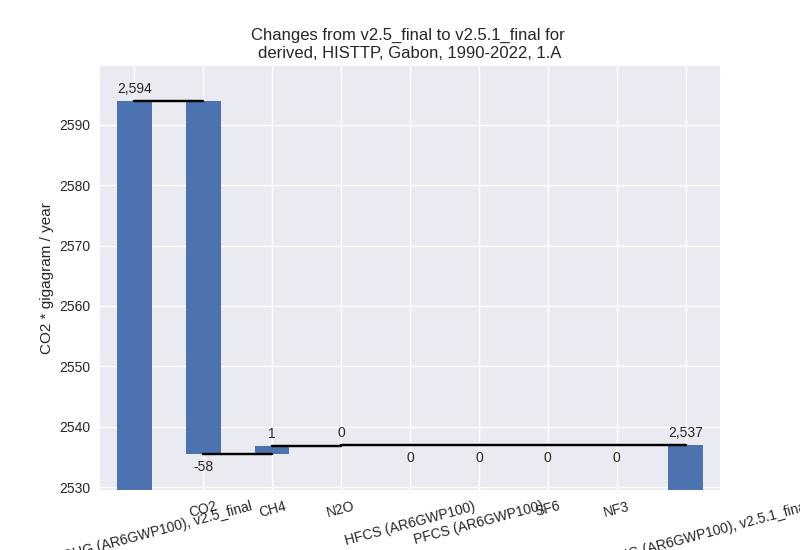
There is no subsector information available in PRIMAP-hist. - 1.B.2: Total sectoral emissions in 2022 are
12556.30 Gg CO2 / year which is 78.4% of category 1 emissions. 2022
Emissions have changed by -8.6%
(-1177.48 Gg CO2 / year). 1990-2022 Emissions have changed by -0.8% (-136.92 Gg CO2 / year). For 2022
the changes per gas
are:
There is no subsector information available in PRIMAP-hist.
- 1.A: Total sectoral emissions in 2022 are 3456.23
Gg CO2 / year which is 21.6% of category 1 emissions. 2022 Emissions
have changed by -5.8% (-212.07 Gg
CO2 / year). 1990-2022 Emissions have changed by -2.2% (-57.02 Gg CO2 / year). For 2022 the
changes per gas
are:
- 2: Total sectoral emissions in 2022 are 1440.47 Gg CO2 / year which is 7.8% of M.0.EL emissions. 2022 Emissions have changed by -0.5% (-6.80 Gg CO2 / year). 1990-2022 Emissions have changed by -1.7% (-8.80 Gg CO2 / year).
- M.AG: Total sectoral emissions in 2022 are 438.94
Gg CO2 / year which is 2.4% of M.0.EL emissions. 2022 Emissions have
changed by -22.3% (-125.88 Gg CO2 /
year). 1990-2022 Emissions have changed by -10.9% (-52.76 Gg CO2 / year). For 2022
the changes per gas
are:
For 1990-2022 the changes per gas are:
The changes come from the following subsectors:- 3.A: Total sectoral emissions in 2022 are 131.37 Gg CO2 / year which is 29.9% of category M.AG emissions. 2022 Emissions have changed by -1.3% (-1.69 Gg CO2 / year). 1990-2022 Emissions have changed by -0.0% (-0.04 Gg CO2 / year).
- M.AG.ELV: Total sectoral emissions in 2022 are
307.57 Gg CO2 / year which is 70.1% of category M.AG emissions. 2022
Emissions have changed by -28.8%
(-124.19 Gg CO2 / year). 1990-2022 Emissions have changed by -14.4% (-52.72 Gg CO2 / year). For 2022
the changes per gas
are:

For 1990-2022 the changes per gas are: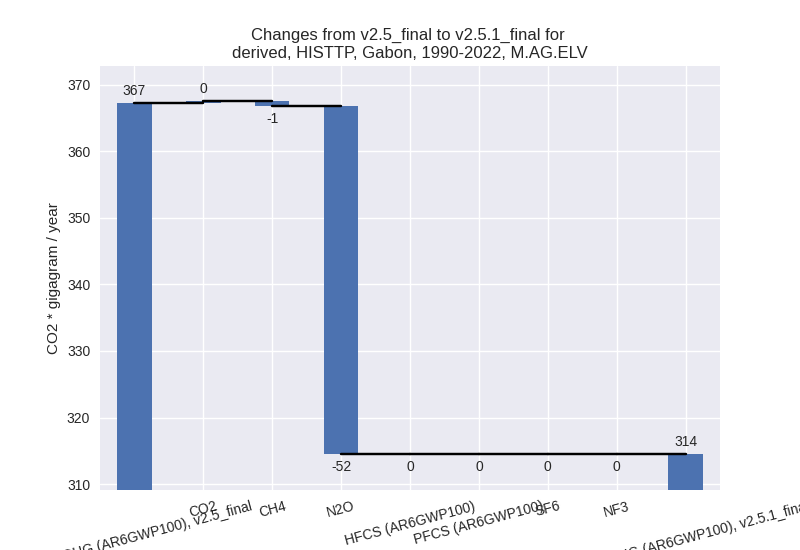
There is no subsector information available in PRIMAP-hist.
- 4: Total sectoral emissions in 2022 are 540.00 Gg CO2 / year which is 2.9% of M.0.EL emissions. 2022 Emissions have changed by -1.0% (-5.46 Gg CO2 / year). 1990-2022 Emissions have changed by -0.0% (-0.17 Gg CO2 / year).
- 5: Total sectoral emissions in 2022 are 145.73 Gg
CO2 / year which is 0.8% of M.0.EL emissions. 2022 Emissions have
changed by 7.3% (9.90 Gg CO2 /
year). 1990-2022 Emissions have changed by 0.4% (0.30 Gg CO2 / year). For 2022 the
changes per gas
are: