Changes in PRIMAP-hist v2.5.1_final compared to v2.5_final for United Kingdom
2024-02-29
Johannes Gütschow
Change analysis for United Kingdom for PRIMAP-hist v2.5.1_final compared to v2.5_final
Overview over emissions by sector and gas
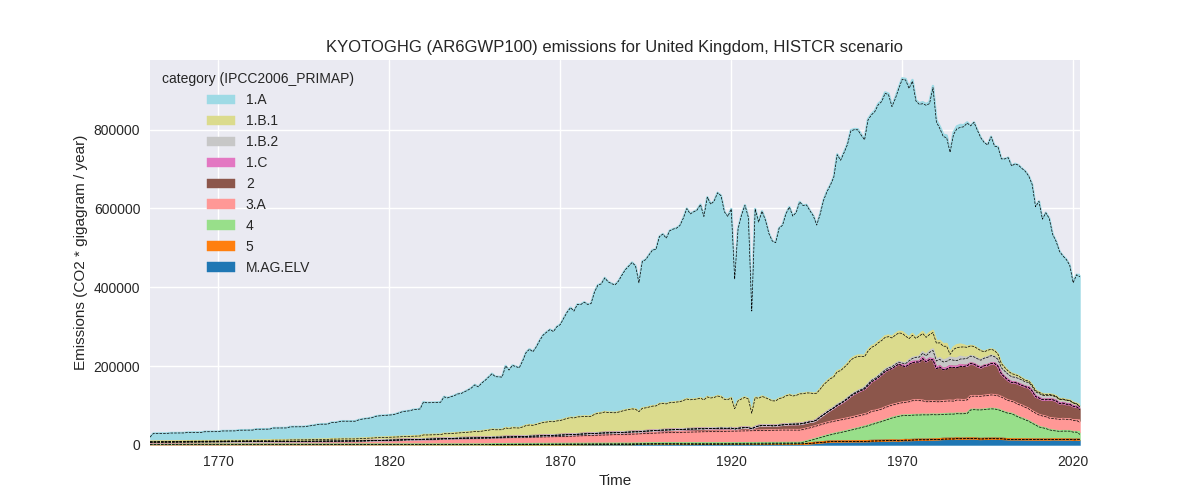
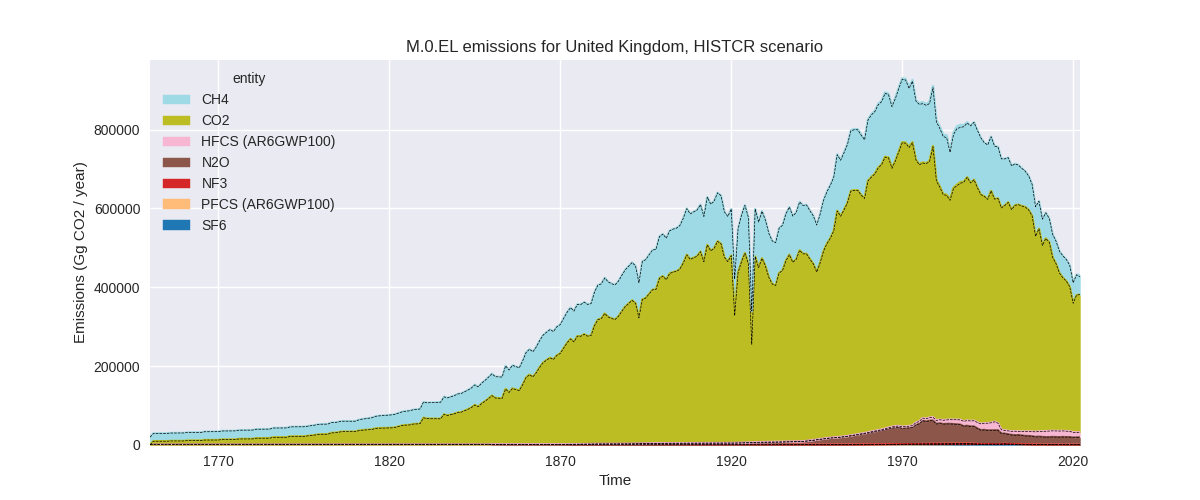
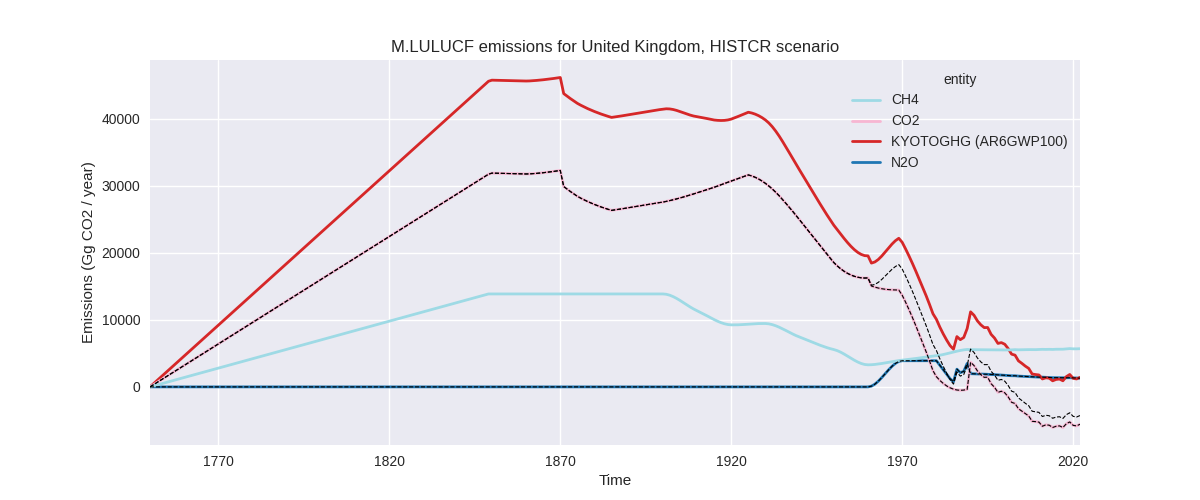
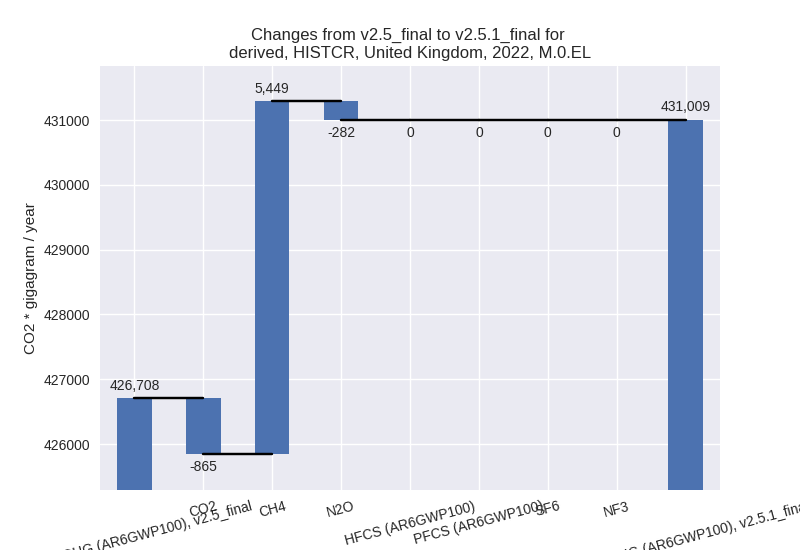
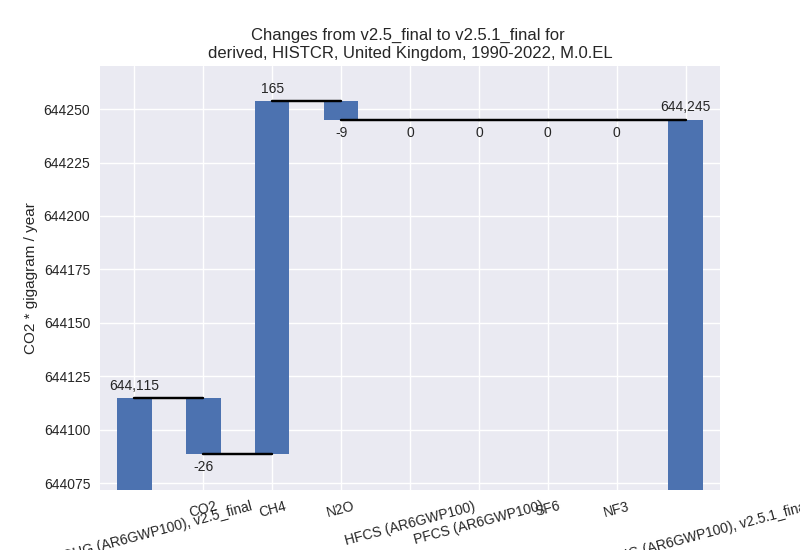
The following figures show the aggregate national total emissions excluding LULUCF AR6GWP100 for the country reported priority scenario. The dotted linesshow the v2.5_final data.
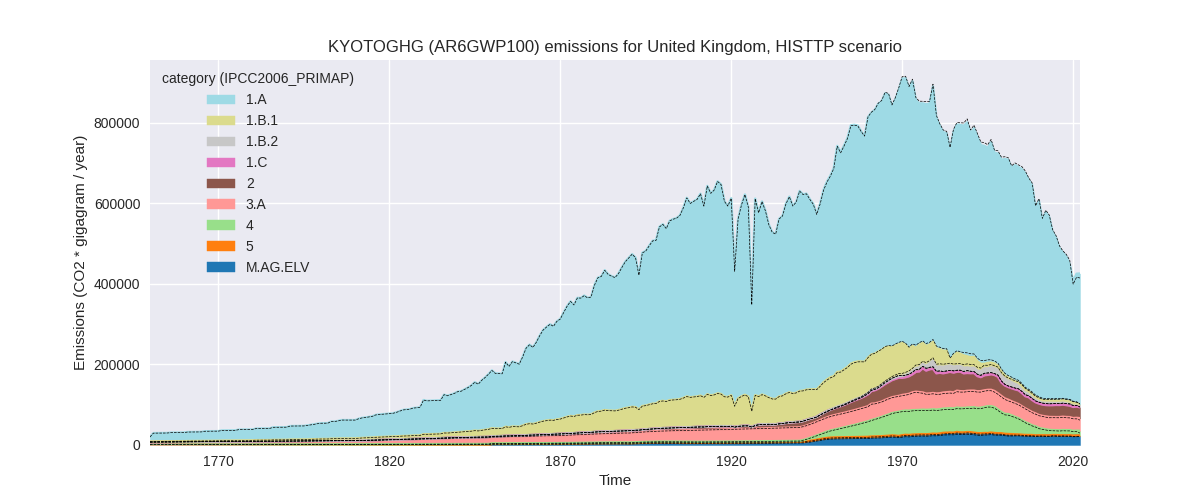
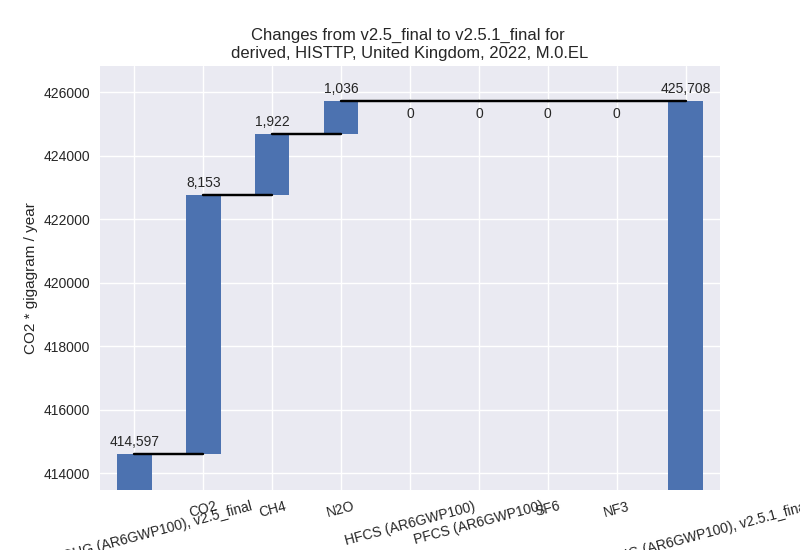
The following figures show the aggregate national total emissions excluding LULUCF AR6GWP100 for the third party priority scenario. The dotted linesshow the v2.5_final data.


Overview over changes
In the country reported priority scenario we have the following changes for aggregate Kyoto GHG and national total emissions excluding LULUCF (M.0.EL):
- Emissions in 2022 have changed by 1.0%% (4301.72 Gg CO2 / year)
- Emissions in 1990-2022 have changed by 0.0%% (130.36 Gg CO2 / year)
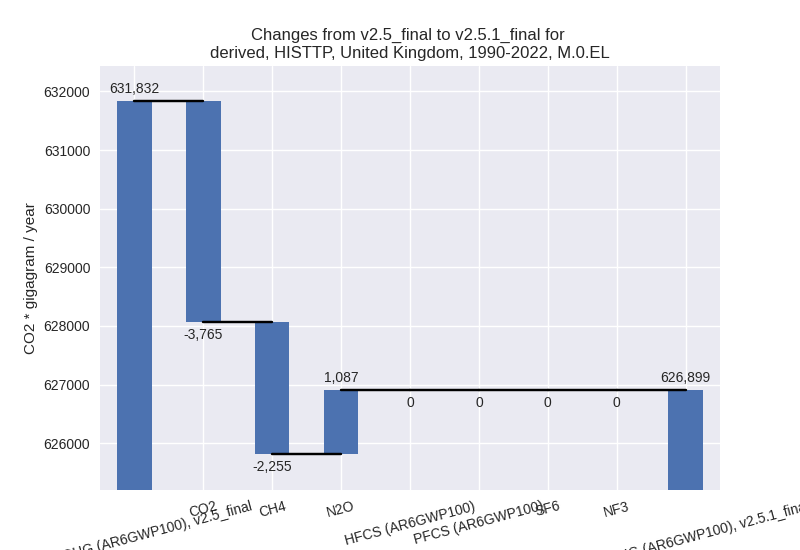
In the third party priority scenario we have the following changes for aggregate Kyoto GHG and national total emissions excluding LULUCF (M.0.EL):
- Emissions in 2022 have changed by 2.7%% (11111.03 Gg CO2 / year)
- Emissions in 1990-2022 have changed by -0.8%% (-4932.70 Gg CO2 / year)
Most important changes per scenario and time frame
In the country reported priority scenario the following sector-gas combinations have the highest absolute impact on national total KyotoGHG (AR6GWP100) emissions in 2022 (top 5):
- 1: 4, CH4 with 5766.38 Gg CO2 / year (51.8%)
- 2: 2, CO2 with -932.62 Gg CO2 / year (-4.9%)
- 3: 3.A, CH4 with -679.64 Gg CO2 / year (-2.4%)
- 4: M.AG.ELV, N2O with -357.85 Gg CO2 / year (-2.9%)
- 5: 1.B.2, CH4 with 280.36 Gg CO2 / year (6.3%)
In the country reported priority scenario the following sector-gas combinations have the highest absolute impact on national total KyotoGHG (AR6GWP100) emissions in 1990-2022 (top 5):
- 1: 4, CH4 with 174.74 Gg CO2 / year (0.4%)
- 2: 2, CO2 with -28.26 Gg CO2 / year (-0.1%)
- 3: 3.A, CH4 with -20.60 Gg CO2 / year (-0.1%)
- 4: M.AG.ELV, N2O with -10.84 Gg CO2 / year (-0.1%)
- 5: 1.B.2, CH4 with 8.50 Gg CO2 / year (0.1%)
In the third party priority scenario the following sector-gas combinations have the highest absolute impact on national total KyotoGHG (AR6GWP100) emissions in 2022 (top 5):
- 1: 1.A, CO2 with 12933.70 Gg CO2 / year (4.2%)
- 2: 2, CO2 with -5574.30 Gg CO2 / year (-33.5%)
- 3: 4, CH4 with 3846.19 Gg CO2 / year (63.0%)
- 4: M.AG.ELV, N2O with 914.72 Gg CO2 / year (4.6%)
- 5: 3.A, CH4 with -841.60 Gg CO2 / year (-2.8%)
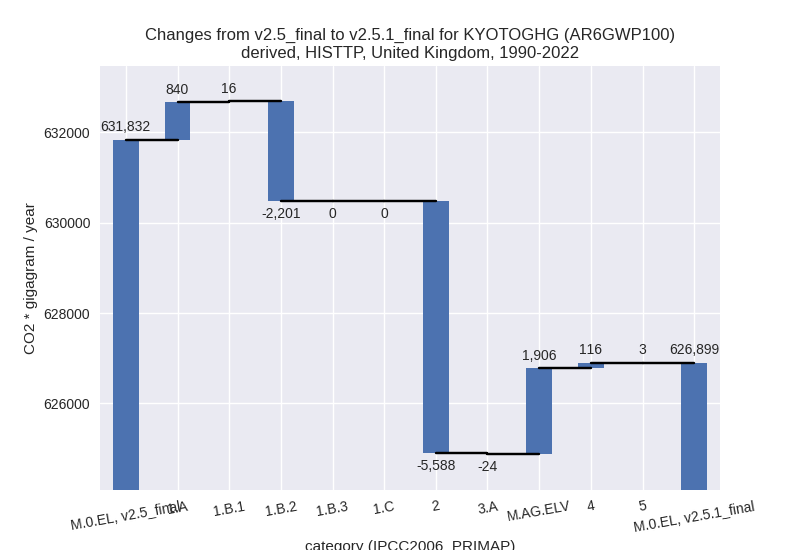
In the third party priority scenario the following sector-gas combinations have the highest absolute impact on national total KyotoGHG (AR6GWP100) emissions in 1990-2022 (top 5):
- 1: 2, CO2 with -5600.95 Gg CO2 / year (-28.6%)
- 2: 1.B.2, CH4 with -2200.73 Gg CO2 / year (-19.1%)
- 3: M.AG.ELV, N2O with 1105.03 Gg CO2 / year (5.2%)
- 4: 1.A, CO2 with 1048.52 Gg CO2 / year (0.2%)
- 5: M.AG.ELV, CO2 with 800.59 Gg CO2 / year (67.4%)
Notes on data changes
No country specific notes present for this changelog.
Changes by sector and gas
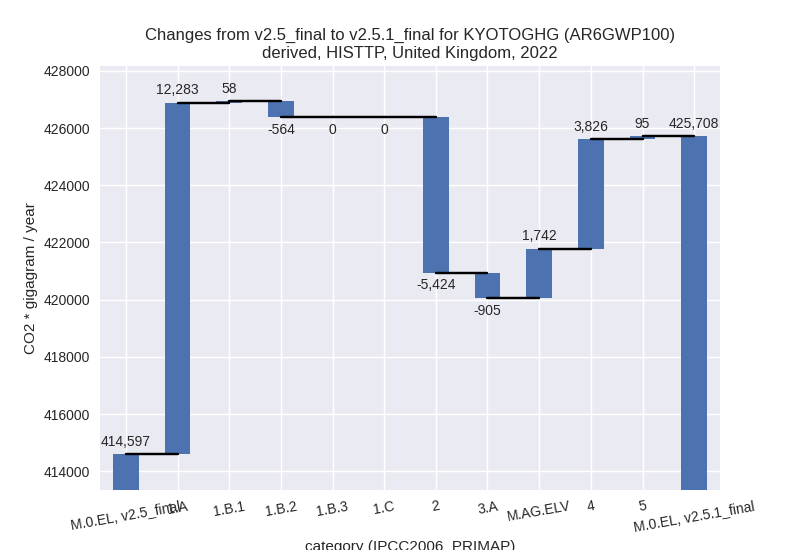
For each scenario and time frame the changes are displayed for all individual sectors and all individual gases. In the sector plot we use aggregate Kyoto GHGs in AR6GWP100. In the gas plot we usenational total emissions without LULUCF. ## country reported scenario
2022

1990-2022

third party scenario
2022
1990-2022
Detailed changes for the scenarios:
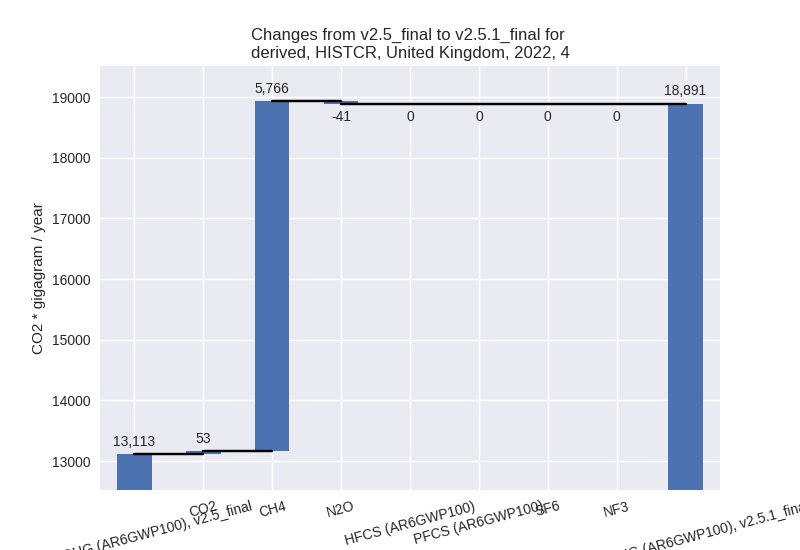
country reported scenario (HISTCR):
Most important changes per time frame
For 2022 the following sector-gas combinations have the highest absolute impact on national total KyotoGHG (AR6GWP100) emissions in 2022 (top 5):
- 1: 4, CH4 with 5766.38 Gg CO2 / year (51.8%)
- 2: 2, CO2 with -932.62 Gg CO2 / year (-4.9%)
- 3: 3.A, CH4 with -679.64 Gg CO2 / year (-2.4%)
- 4: M.AG.ELV, N2O with -357.85 Gg CO2 / year (-2.9%)
- 5: 1.B.2, CH4 with 280.36 Gg CO2 / year (6.3%)
For 1990-2022 the following sector-gas combinations have the highest absolute impact on national total KyotoGHG (AR6GWP100) emissions in 1990-2022 (top 5):
- 1: 4, CH4 with 174.74 Gg CO2 / year (0.4%)
- 2: 2, CO2 with -28.26 Gg CO2 / year (-0.1%)
- 3: 3.A, CH4 with -20.60 Gg CO2 / year (-0.1%)
- 4: M.AG.ELV, N2O with -10.84 Gg CO2 / year (-0.1%)
- 5: 1.B.2, CH4 with 8.50 Gg CO2 / year (0.1%)
Changes in the main sectors for aggregate KyotoGHG (AR6GWP100) are
- 1: Total sectoral emissions in 2022 are 336914.44 Gg CO2 / year which is 78.2% of M.0.EL emissions. 2022 Emissions have changed by 0.1% (386.38 Gg CO2 / year). 1990-2022 Emissions have changed by 0.0% (11.71 Gg CO2 / year).
- 2: Total sectoral emissions in 2022 are 32495.10 Gg
CO2 / year which is 7.5% of M.0.EL emissions. 2022 Emissions have
changed by -2.8% (-948.47 Gg CO2 /
year). 1990-2022 Emissions have changed by -0.1% (-28.74 Gg CO2 / year). For 2022 the
changes per gas
are:

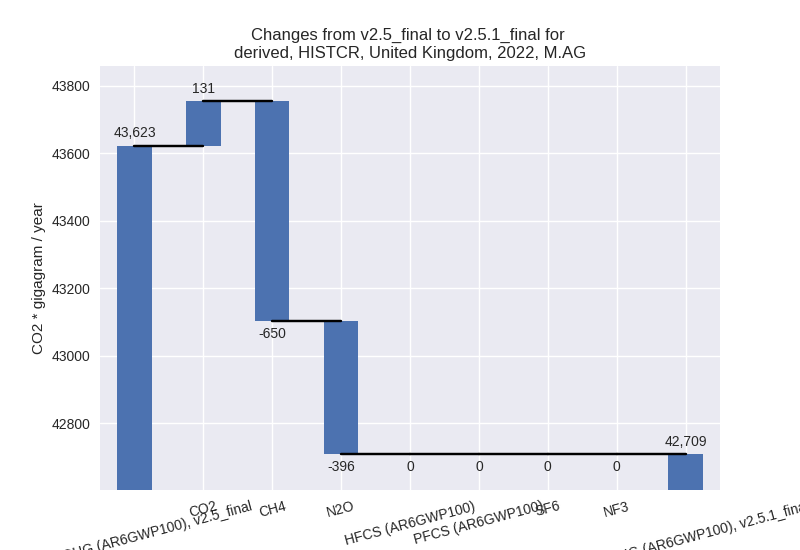
- M.AG: Total sectoral emissions in 2022 are 42708.74
Gg CO2 / year which is 9.9% of M.0.EL emissions. 2022 Emissions have
changed by -2.1% (-914.34 Gg CO2 /
year). 1990-2022 Emissions have changed by -0.1% (-27.71 Gg CO2 / year). For 2022 the
changes per gas
are:
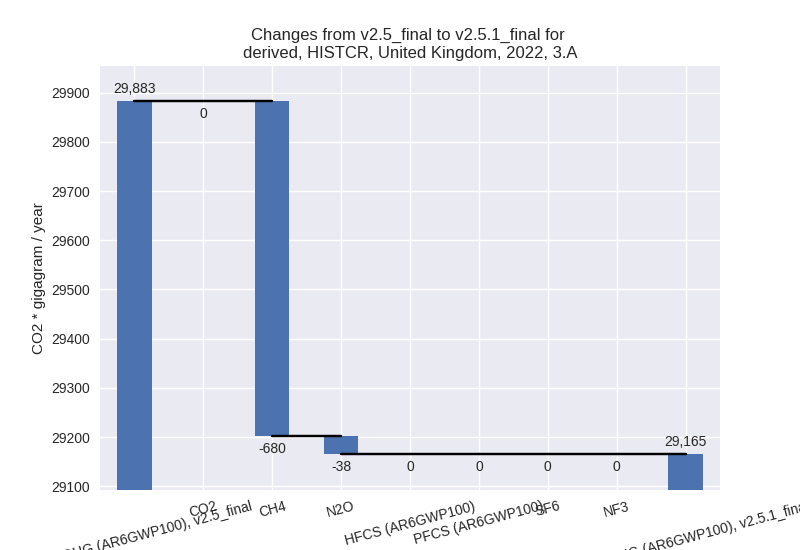
The changes come from the following subsectors:- 3.A: Total sectoral emissions in 2022 are 29165.04
Gg CO2 / year which is 68.3% of category M.AG emissions. 2022 Emissions
have changed by -2.4% (-717.49 Gg
CO2 / year). 1990-2022 Emissions have changed by -0.1% (-21.74 Gg CO2 / year). For 2022 the
changes per gas
are:
There is no subsector information available in PRIMAP-hist. - M.AG.ELV: Total sectoral emissions in 2022 are 13543.70 Gg CO2 / year which is 31.7% of category M.AG emissions. 2022 Emissions have changed by -1.4% (-196.85 Gg CO2 / year). 1990-2022 Emissions have changed by -0.0% (-5.97 Gg CO2 / year).
- 3.A: Total sectoral emissions in 2022 are 29165.04
Gg CO2 / year which is 68.3% of category M.AG emissions. 2022 Emissions
have changed by -2.4% (-717.49 Gg
CO2 / year). 1990-2022 Emissions have changed by -0.1% (-21.74 Gg CO2 / year). For 2022 the
changes per gas
are:
- 4: Total sectoral emissions in 2022 are 18891.17 Gg
CO2 / year which is 4.4% of M.0.EL emissions. 2022 Emissions have
changed by 44.1% (5778.16 Gg CO2 /
year). 1990-2022 Emissions have changed by 0.4% (175.10 Gg CO2 / year). For 2022 the
changes per gas
are:
- 5: No data
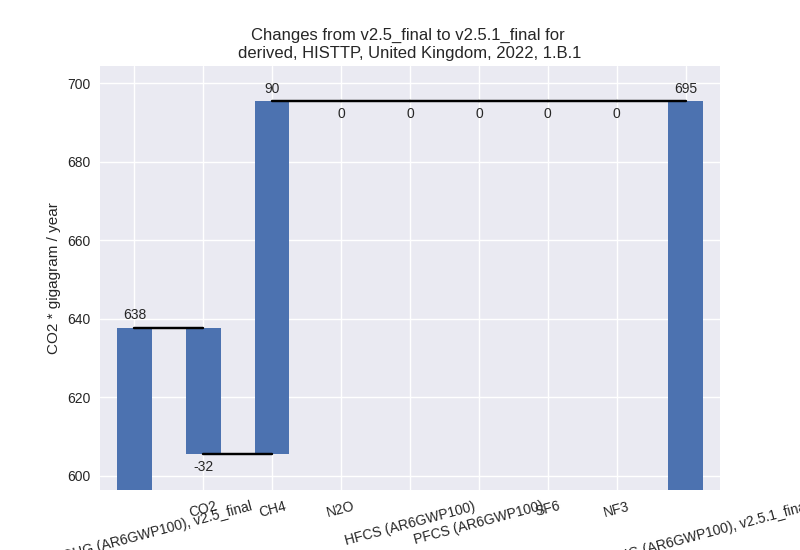
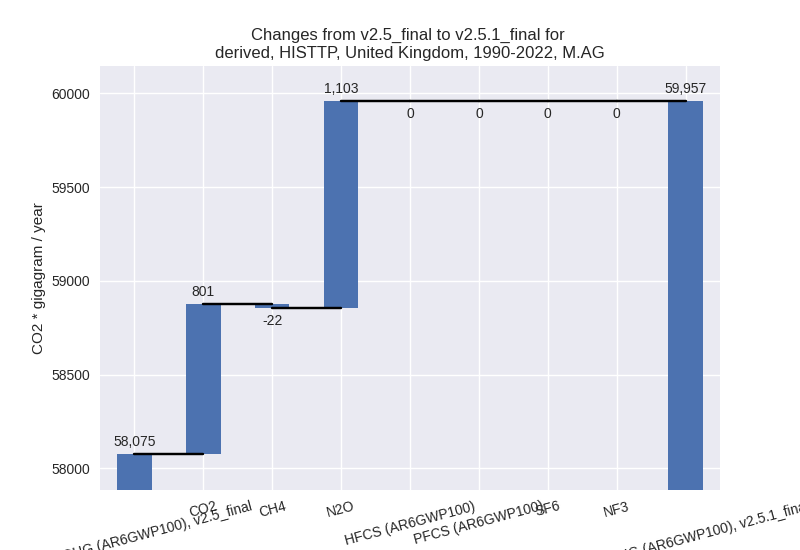
third party scenario (HISTTP):
Most important changes per time frame
For 2022 the following sector-gas combinations have the highest absolute impact on national total KyotoGHG (AR6GWP100) emissions in 2022 (top 5):
- 1: 1.A, CO2 with 12933.70 Gg CO2 / year (4.2%)
- 2: 2, CO2 with -5574.30 Gg CO2 / year (-33.5%)
- 3: 4, CH4 with 3846.19 Gg CO2 / year (63.0%)
- 4: M.AG.ELV, N2O with 914.72 Gg CO2 / year (4.6%)
- 5: 3.A, CH4 with -841.60 Gg CO2 / year (-2.8%)
For 1990-2022 the following sector-gas combinations have the highest absolute impact on national total KyotoGHG (AR6GWP100) emissions in 1990-2022 (top 5):
- 1: 2, CO2 with -5600.95 Gg CO2 / year (-28.6%)
- 2: 1.B.2, CH4 with -2200.73 Gg CO2 / year (-19.1%)
- 3: M.AG.ELV, N2O with 1105.03 Gg CO2 / year (5.2%)
- 4: 1.A, CO2 with 1048.52 Gg CO2 / year (0.2%)
- 5: M.AG.ELV, CO2 with 800.59 Gg CO2 / year (67.4%)
Changes in the main sectors for aggregate KyotoGHG (AR6GWP100) are
- 1: Total sectoral emissions in 2022 are 332072.55
Gg CO2 / year which is 78.0% of M.0.EL emissions. 2022 Emissions have
changed by 3.7% (11777.19 Gg CO2 /
year). 1990-2022 Emissions have changed by -0.3% (-1345.26 Gg CO2 / year). For 2022
the changes per gas
are:

The changes come from the following subsectors:- 1.A: Total sectoral emissions in 2022 are 324585.84
Gg CO2 / year which is 97.8% of category 1 emissions. 2022 Emissions
have changed by 3.9% (12283.44 Gg
CO2 / year). 1990-2022 Emissions have changed by 0.2% (840.06 Gg CO2 / year). For 2022 the
changes per gas
are:

There is no subsector information available in PRIMAP-hist. - 1.B.1: Total sectoral emissions in 2022 are 695.35
Gg CO2 / year which is 0.2% of category 1 emissions. 2022 Emissions have
changed by 9.0% (57.70 Gg CO2 /
year). 1990-2022 Emissions have changed by 0.2% (15.55 Gg CO2 / year). For 2022 the
changes per gas
are:
There is no subsector information available in PRIMAP-hist. - 1.B.2: Total sectoral emissions in 2022 are 6763.31
Gg CO2 / year which is 2.0% of category 1 emissions. 2022 Emissions have
changed by -7.7% (-563.95 Gg CO2 /
year). 1990-2022 Emissions have changed by -15.1% (-2200.86 Gg CO2 / year). For 2022
the changes per gas
are:

For 1990-2022 the changes per gas are:
There is no subsector information available in PRIMAP-hist.
- 1.A: Total sectoral emissions in 2022 are 324585.84
Gg CO2 / year which is 97.8% of category 1 emissions. 2022 Emissions
have changed by 3.9% (12283.44 Gg
CO2 / year). 1990-2022 Emissions have changed by 0.2% (840.06 Gg CO2 / year). For 2022 the
changes per gas
are:
- 2: Total sectoral emissions in 2022 are 27120.98 Gg
CO2 / year which is 6.4% of M.0.EL emissions. 2022 Emissions have
changed by -16.7% (-5423.59 Gg CO2 /
year). 1990-2022 Emissions have changed by -14.5% (-5588.12 Gg CO2 / year). For 2022
the changes per gas
are:

For 1990-2022 the changes per gas are: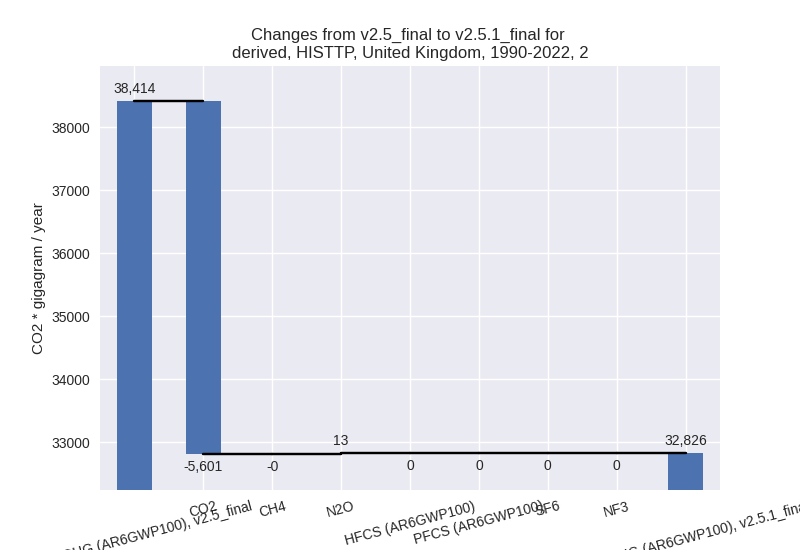
- M.AG: Total sectoral emissions in 2022 are 53998.83
Gg CO2 / year which is 12.7% of M.0.EL emissions. 2022 Emissions have
changed by 1.6% (836.97 Gg CO2 /
year). 1990-2022 Emissions have changed by 3.2% (1881.88 Gg CO2 / year). For
1990-2022 the changes per gas
are:
The changes come from the following subsectors:- 3.A: Total sectoral emissions in 2022 are 31251.31
Gg CO2 / year which is 57.9% of category M.AG emissions. 2022 Emissions
have changed by -2.8% (-905.46 Gg
CO2 / year). 1990-2022 Emissions have changed by -0.1% (-24.18 Gg CO2 / year). For 2022 the
changes per gas
are:

There is no subsector information available in PRIMAP-hist. - M.AG.ELV: Total sectoral emissions in 2022 are
22747.52 Gg CO2 / year which is 42.1% of category M.AG emissions. 2022
Emissions have changed by 8.3%
(1742.43 Gg CO2 / year). 1990-2022 Emissions have changed by 8.5% (1906.06 Gg CO2 / year). For 2022 the
changes per gas
are:

For 1990-2022 the changes per gas are: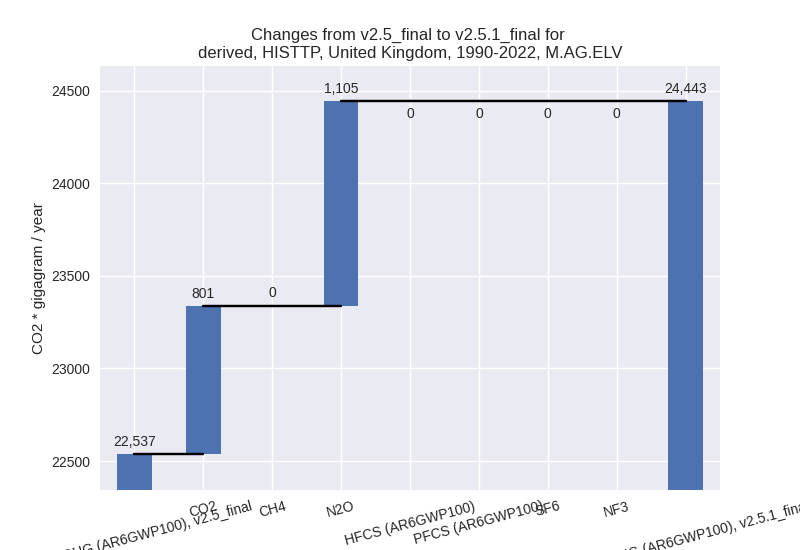
There is no subsector information available in PRIMAP-hist.
- 3.A: Total sectoral emissions in 2022 are 31251.31
Gg CO2 / year which is 57.9% of category M.AG emissions. 2022 Emissions
have changed by -2.8% (-905.46 Gg
CO2 / year). 1990-2022 Emissions have changed by -0.1% (-24.18 Gg CO2 / year). For 2022 the
changes per gas
are:
- 4: Total sectoral emissions in 2022 are 11584.06 Gg
CO2 / year which is 2.7% of M.0.EL emissions. 2022 Emissions have
changed by 49.3% (3825.90 Gg CO2 /
year). 1990-2022 Emissions have changed by 0.3% (115.94 Gg CO2 / year). For 2022 the
changes per gas
are:

- 5: Total sectoral emissions in 2022 are 931.13 Gg
CO2 / year which is 0.2% of M.0.EL emissions. 2022 Emissions have
changed by 11.3% (94.57 Gg CO2 /
year). 1990-2022 Emissions have changed by 0.2% (2.87 Gg CO2 / year). For 2022 the
changes per gas
are:
