Changes in PRIMAP-hist v2.5.1_final compared to v2.5_final for Ghana
2024-02-29
Johannes Gütschow
Change analysis for Ghana for PRIMAP-hist v2.5.1_final compared to v2.5_final
Overview over emissions by sector and gas
The following figures show the aggregate national total emissions excluding LULUCF AR6GWP100 for the country reported priority scenario. The dotted linesshow the v2.5_final data.
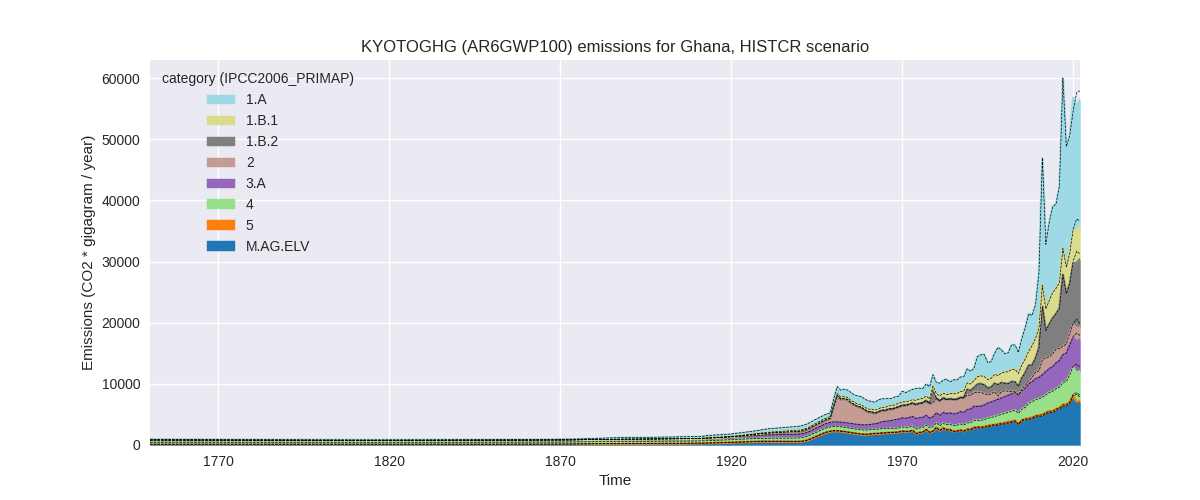

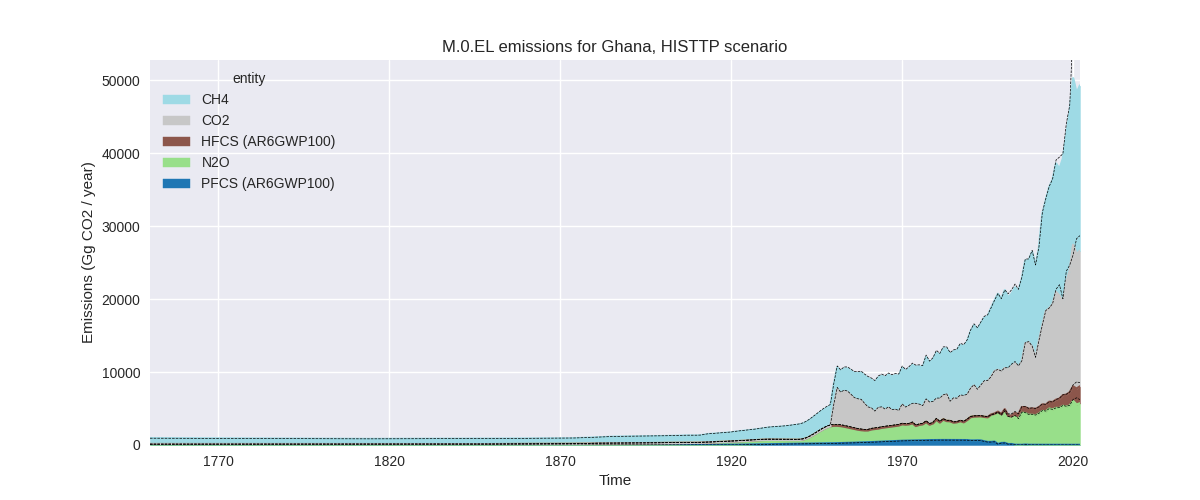
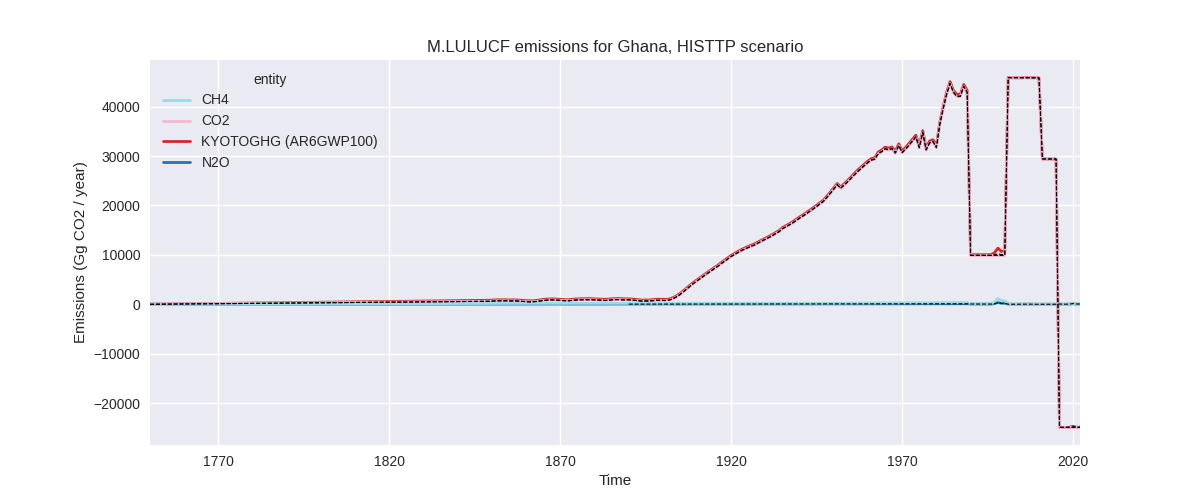
The following figures show the aggregate national total emissions excluding LULUCF AR6GWP100 for the third party priority scenario. The dotted linesshow the v2.5_final data.

Overview over changes
In the country reported priority scenario we have the following changes for aggregate Kyoto GHG and national total emissions excluding LULUCF (M.0.EL):
- Emissions in 2022 have changed by -2.5%% (-1419.74 Gg CO2 / year)
- Emissions in 1990-2022 have changed by -0.2%% (-46.76 Gg CO2 / year)
In the third party priority scenario we have the following changes for aggregate Kyoto GHG and national total emissions excluding LULUCF (M.0.EL):
- Emissions in 2022 have changed by -17.1%% (-10171.56 Gg CO2 / year)
- Emissions in 1990-2022 have changed by -5.1%% (-1493.65 Gg CO2 / year)
Most important changes per scenario and time frame
In the country reported priority scenario the following sector-gas combinations have the highest absolute impact on national total KyotoGHG (AR6GWP100) emissions in 2022 (top 5):
- 1: M.AG.ELV, N2O with -703.09 Gg CO2 / year (-10.3%)
- 2: 1.A, CO2 with -425.47 Gg CO2 / year (-2.1%)
- 3: M.AG.ELV, CH4 with -212.30 Gg CO2 / year (-21.4%)
- 4: 1.B.2, CH4 with -195.57 Gg CO2 / year (-59.6%)
- 5: 4, CH4 with 176.95 Gg CO2 / year (4.5%)
In the country reported priority scenario the following sector-gas combinations have the highest absolute impact on national total KyotoGHG (AR6GWP100) emissions in 1990-2022 (top 5):
- 1: M.AG.ELV, N2O with -65.05 Gg CO2 / year (-1.7%)
- 2: 1.A, CO2 with 57.01 Gg CO2 / year (0.7%)
- 3: 1.B.2, CH4 with -26.10 Gg CO2 / year (-23.8%)
- 4: M.AG.ELV, CH4 with -13.00 Gg CO2 / year (-2.2%)
- 5: 4, CH4 with 5.36 Gg CO2 / year (0.3%)
In the third party priority scenario the following sector-gas combinations have the highest absolute impact on national total KyotoGHG (AR6GWP100) emissions in 2022 (top 5):
- 1: 1.B.2, CH4 with -7381.41 Gg CO2 / year (-58.2%)
- 2: 1.A, CO2 with -1159.23 Gg CO2 / year (-6.3%)
- 3: M.AG.ELV, N2O with -563.08 Gg CO2 / year (-11.0%)
- 4: M.AG.ELV, CH4 with -553.71 Gg CO2 / year (-21.7%)
- 5: 1.B.2, CO2 with -373.42 Gg CO2 / year (-27.2%)
In the third party priority scenario the following sector-gas combinations have the highest absolute impact on national total KyotoGHG (AR6GWP100) emissions in 1990-2022 (top 5):
- 1: 1.B.2, CH4 with -1050.50 Gg CO2 / year (-43.1%)
- 2: 1.A, CO2 with -144.71 Gg CO2 / year (-1.6%)
- 3: M.AG.ELV, N2O with -121.79 Gg CO2 / year (-3.3%)
- 4: M.AG.ELV, CH4 with -107.37 Gg CO2 / year (-4.5%)
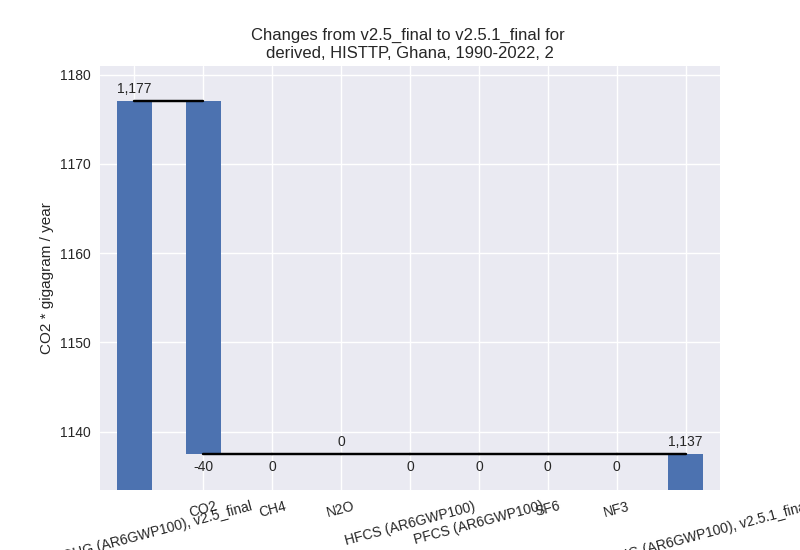
- 5: 2, CO2 with -39.53 Gg CO2 / year (-16.0%)
Notes on data changes
Here we list notes explaining important emissions changes for the country. ’' means that the following text only applies to the TP time series, while means that it only applies to the CR scenario. Otherwise the note applies to both scenarios.
- 1.B.2, CH4: EDGAR 7.0 has very high 2020 and 2021 emissions which are not present in EDGAR 8.0 leading to much lower emissions for the last years.
- 1.A, CO2: New CDIAC data have changed the emissions for the last years. The effect on the CR time-series is small as country reported data cover the period until 2019.
- M.AG.ELV, N2O: New FAO data has a steep decline in 2021 after a steep increase in 2020 which was also present in FAO 2022 data. Thus after extending the time series with EDGAR data the latest years have lower emissions in the new PRIMAP-hist version.
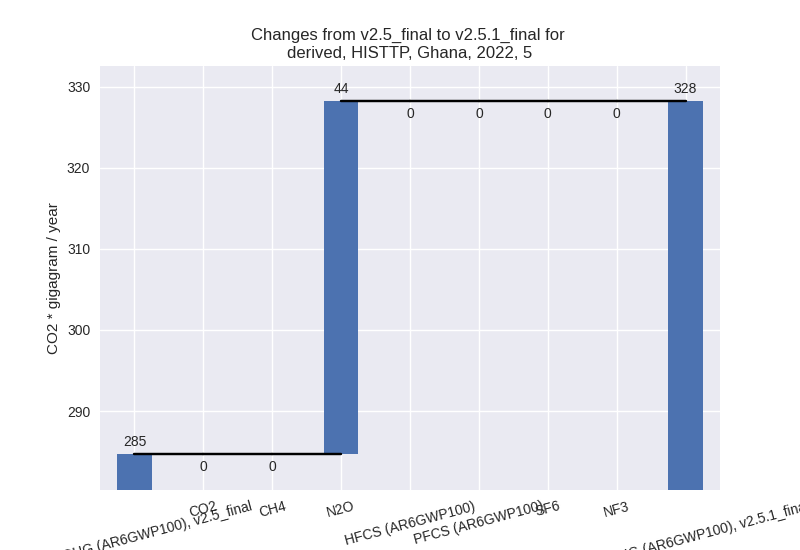
Changes by sector and gas
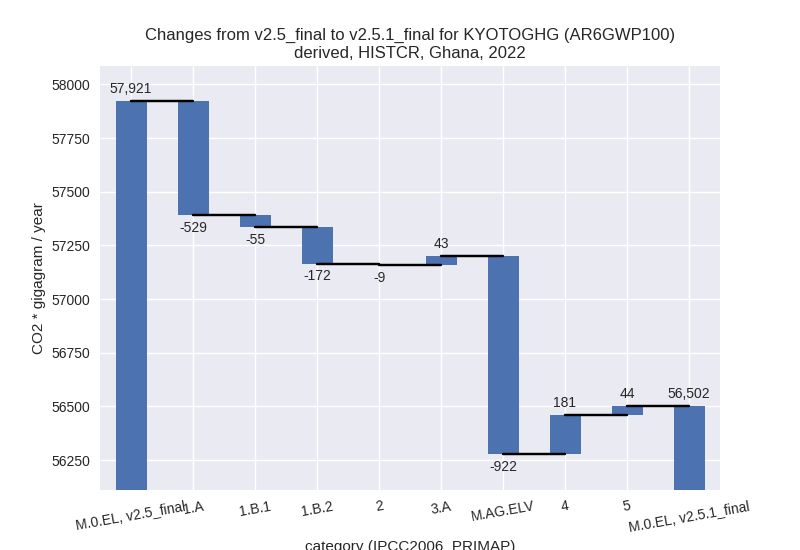
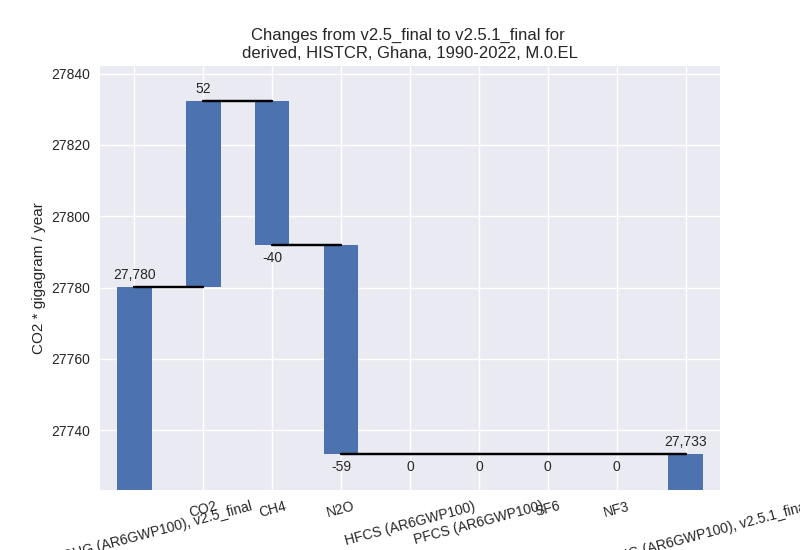
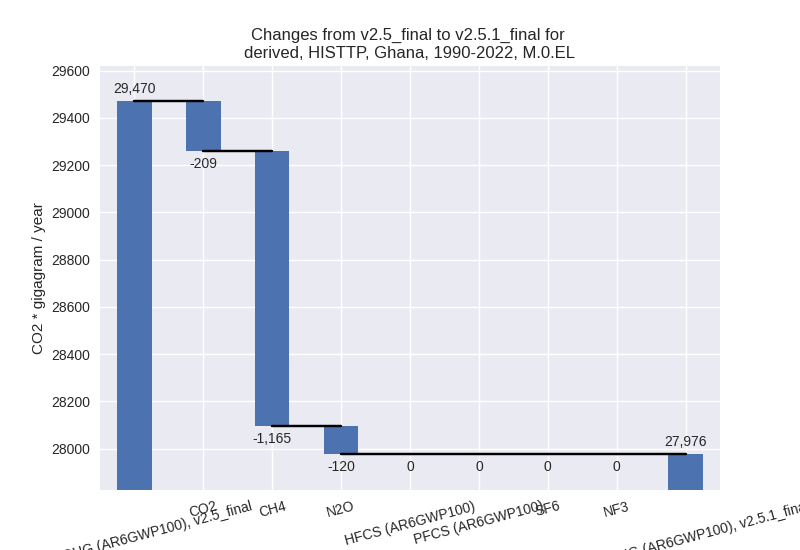
For each scenario and time frame the changes are displayed for all individual sectors and all individual gases. In the sector plot we use aggregate Kyoto GHGs in AR6GWP100. In the gas plot we usenational total emissions without LULUCF. ## country reported scenario
2022

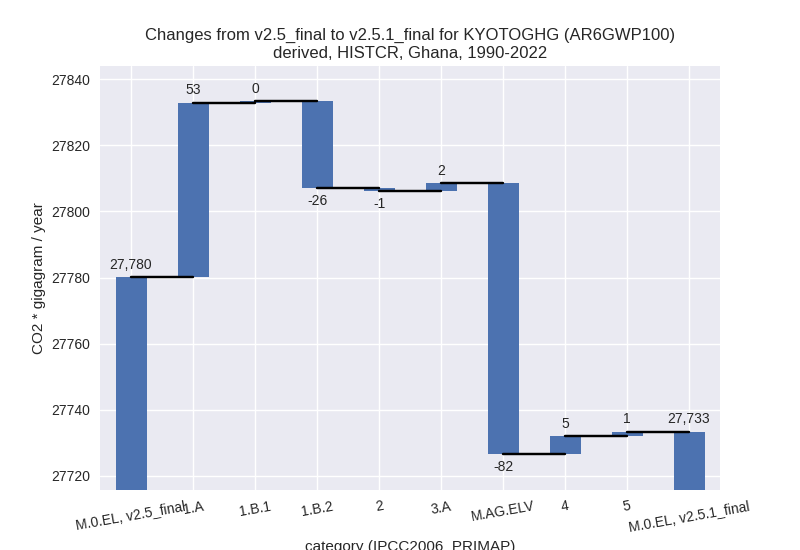
1990-2022
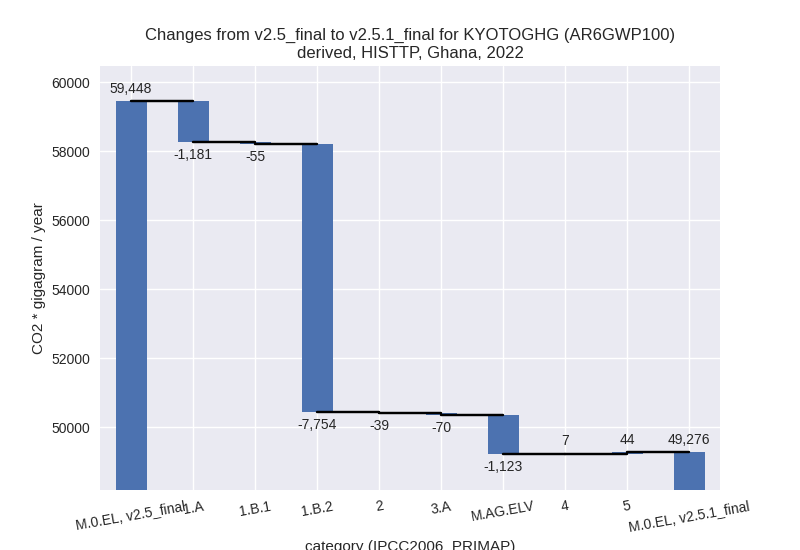
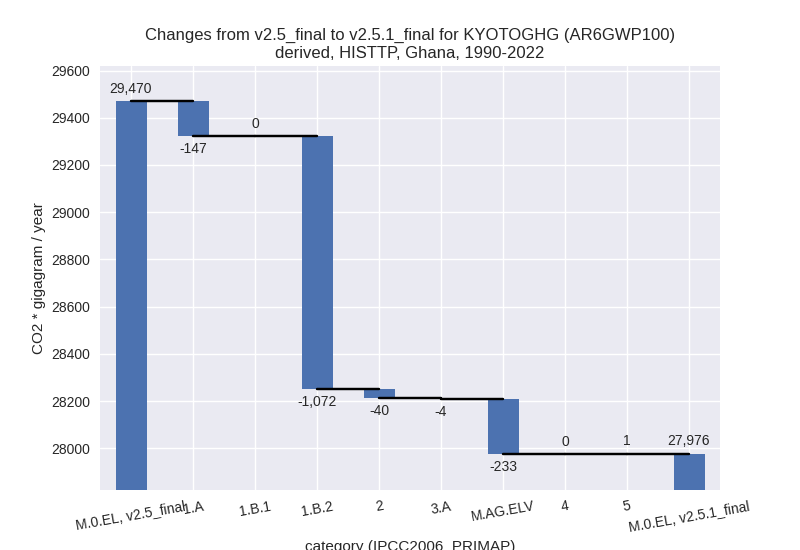
third party scenario
2022

1990-2022
Detailed changes for the scenarios:
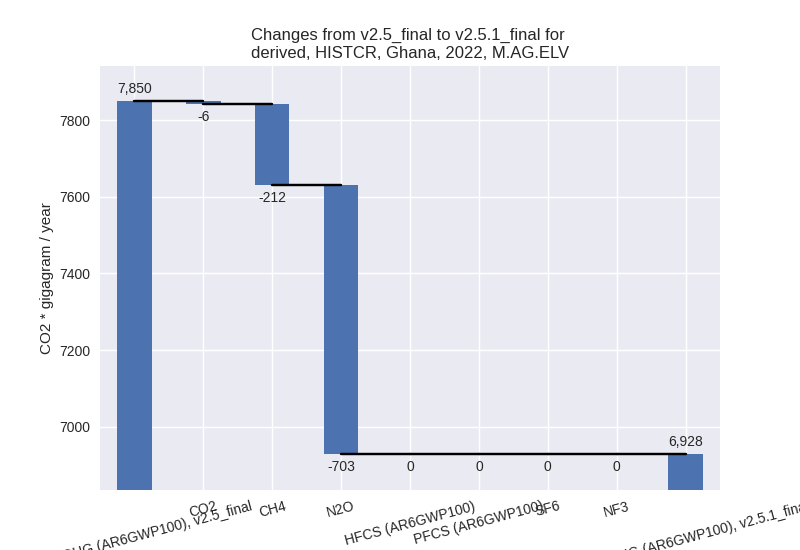
country reported scenario (HISTCR):
Most important changes per time frame
For 2022 the following sector-gas combinations have the highest absolute impact on national total KyotoGHG (AR6GWP100) emissions in 2022 (top 5):
- 1: M.AG.ELV, N2O with -703.09 Gg CO2 / year (-10.3%)
- 2: 1.A, CO2 with -425.47 Gg CO2 / year (-2.1%)
- 3: M.AG.ELV, CH4 with -212.30 Gg CO2 / year (-21.4%)
- 4: 1.B.2, CH4 with -195.57 Gg CO2 / year (-59.6%)
- 5: 4, CH4 with 176.95 Gg CO2 / year (4.5%)
For 1990-2022 the following sector-gas combinations have the highest absolute impact on national total KyotoGHG (AR6GWP100) emissions in 1990-2022 (top 5):
- 1: M.AG.ELV, N2O with -65.05 Gg CO2 / year (-1.7%)
- 2: 1.A, CO2 with 57.01 Gg CO2 / year (0.7%)
- 3: 1.B.2, CH4 with -26.10 Gg CO2 / year (-23.8%)
- 4: M.AG.ELV, CH4 with -13.00 Gg CO2 / year (-2.2%)
- 5: 4, CH4 with 5.36 Gg CO2 / year (0.3%)
Changes in the main sectors for aggregate KyotoGHG (AR6GWP100) are
- 1: Total sectoral emissions in 2022 are 37318.79 Gg CO2 / year which is 66.0% of M.0.EL emissions. 2022 Emissions have changed by -2.0% (-755.71 Gg CO2 / year). 1990-2022 Emissions have changed by 0.2% (27.01 Gg CO2 / year).
- 2: Total sectoral emissions in 2022 are 1915.76 Gg CO2 / year which is 3.4% of M.0.EL emissions. 2022 Emissions have changed by -0.5% (-8.99 Gg CO2 / year). 1990-2022 Emissions have changed by -0.1% (-0.79 Gg CO2 / year).
- M.AG: Total sectoral emissions in 2022 are 12147.27
Gg CO2 / year which is 21.5% of M.0.EL emissions. 2022 Emissions have
changed by -6.7% (-879.11 Gg CO2 /
year). 1990-2022 Emissions have changed by -1.0% (-79.77 Gg CO2 / year). For 2022 the
changes per gas
are:

The changes come from the following subsectors:- 3.A: Total sectoral emissions in 2022 are 5219.39 Gg CO2 / year which is 43.0% of category M.AG emissions. 2022 Emissions have changed by 0.8% (42.76 Gg CO2 / year). 1990-2022 Emissions have changed by 0.1% (2.34 Gg CO2 / year).
- M.AG.ELV: Total sectoral emissions in 2022 are
6927.88 Gg CO2 / year which is 57.0% of category M.AG emissions. 2022
Emissions have changed by -11.7%
(-921.87 Gg CO2 / year). 1990-2022 Emissions have changed by -1.8% (-82.11 Gg CO2 / year). For 2022 the
changes per gas
are:
There is no subsector information available in PRIMAP-hist.
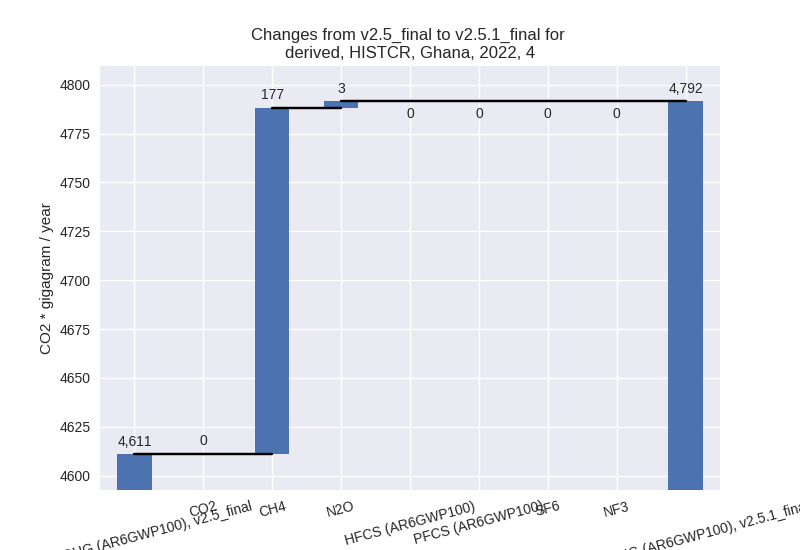
- 4: Total sectoral emissions in 2022 are 4791.52 Gg
CO2 / year which is 8.5% of M.0.EL emissions. 2022 Emissions have
changed by 3.9% (180.54 Gg CO2 /
year). 1990-2022 Emissions have changed by 0.2% (5.47 Gg CO2 / year). For 2022 the
changes per gas
are:
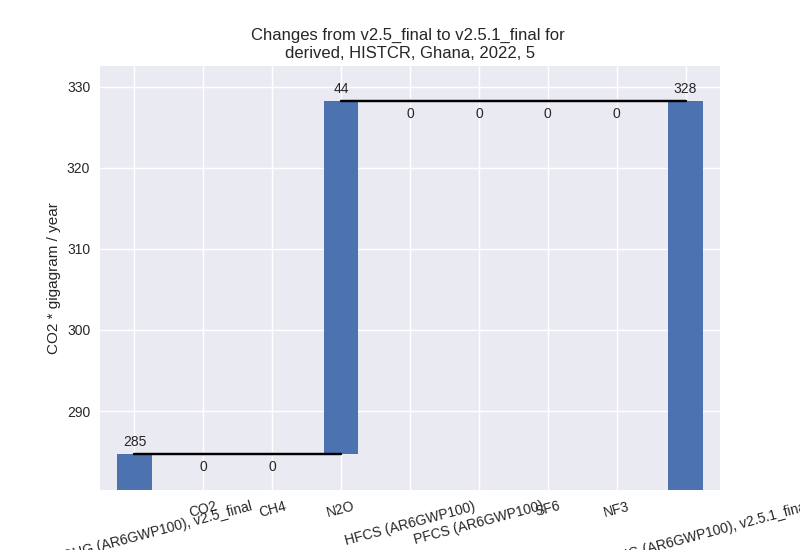
- 5: Total sectoral emissions in 2022 are 328.20 Gg
CO2 / year which is 0.6% of M.0.EL emissions. 2022 Emissions have
changed by 15.3% (43.53 Gg CO2 /
year). 1990-2022 Emissions have changed by 0.7% (1.32 Gg CO2 / year). For 2022 the
changes per gas
are:
third party scenario (HISTTP):
Most important changes per time frame
For 2022 the following sector-gas combinations have the highest absolute impact on national total KyotoGHG (AR6GWP100) emissions in 2022 (top 5):
- 1: 1.B.2, CH4 with -7381.41 Gg CO2 / year (-58.2%)
- 2: 1.A, CO2 with -1159.23 Gg CO2 / year (-6.3%)
- 3: M.AG.ELV, N2O with -563.08 Gg CO2 / year (-11.0%)
- 4: M.AG.ELV, CH4 with -553.71 Gg CO2 / year (-21.7%)
- 5: 1.B.2, CO2 with -373.42 Gg CO2 / year (-27.2%)
For 1990-2022 the following sector-gas combinations have the highest absolute impact on national total KyotoGHG (AR6GWP100) emissions in 1990-2022 (top 5):
- 1: 1.B.2, CH4 with -1050.50 Gg CO2 / year (-43.1%)
- 2: 1.A, CO2 with -144.71 Gg CO2 / year (-1.6%)
- 3: M.AG.ELV, N2O with -121.79 Gg CO2 / year (-3.3%)
- 4: M.AG.ELV, CH4 with -107.37 Gg CO2 / year (-4.5%)
- 5: 2, CO2 with -39.53 Gg CO2 / year (-16.0%)
Changes in the main sectors for aggregate KyotoGHG (AR6GWP100) are
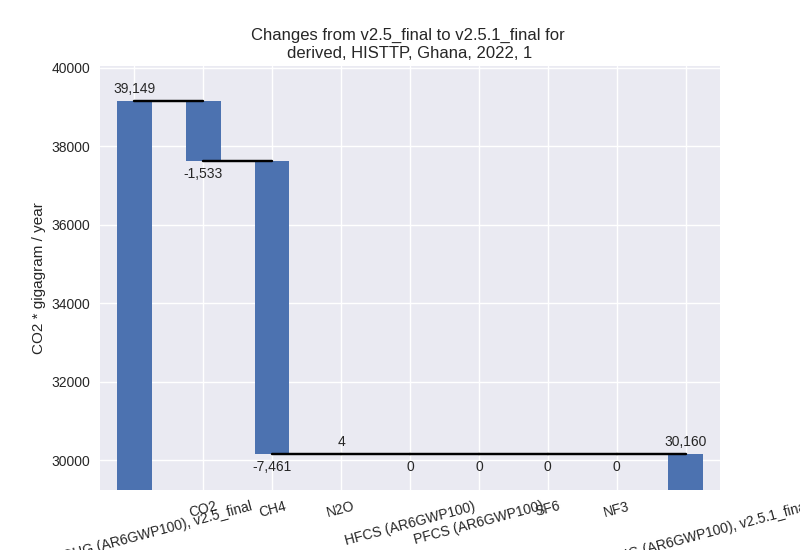
- 1: Total sectoral emissions in 2022 are 30159.74 Gg
CO2 / year which is 61.2% of M.0.EL emissions. 2022 Emissions have
changed by -23.0% (-8989.73 Gg CO2 /
year). 1990-2022 Emissions have changed by -7.8% (-1218.67 Gg CO2 / year). For 2022
the changes per gas
are:
For 1990-2022 the changes per gas are: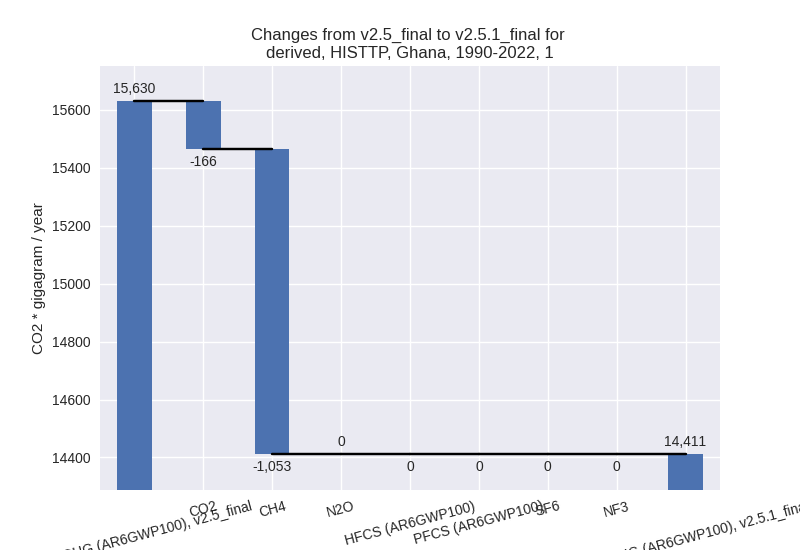
The changes come from the following subsectors:- 1.A: Total sectoral emissions in 2022 are 18505.07
Gg CO2 / year which is 61.4% of category 1 emissions. 2022 Emissions
have changed by -6.0% (-1180.74 Gg
CO2 / year). 1990-2022 Emissions have changed by -1.5% (-147.41 Gg CO2 / year). For 2022
the changes per gas
are:

There is no subsector information available in PRIMAP-hist. - 1.B.1: Total sectoral emissions in 2022 are 5360.60 Gg CO2 / year which is 17.8% of category 1 emissions. 2022 Emissions have changed by -1.0% (-54.66 Gg CO2 / year). 1990-2022 Emissions have changed by 0.0% (0.49 Gg CO2 / year).
- 1.B.2: Total sectoral emissions in 2022 are 6294.08
Gg CO2 / year which is 20.9% of category 1 emissions. 2022 Emissions
have changed by -55.2% (-7754.33 Gg
CO2 / year). 1990-2022 Emissions have changed by -40.6% (-1071.75 Gg CO2 / year). For 2022
the changes per gas
are:

For 1990-2022 the changes per gas are: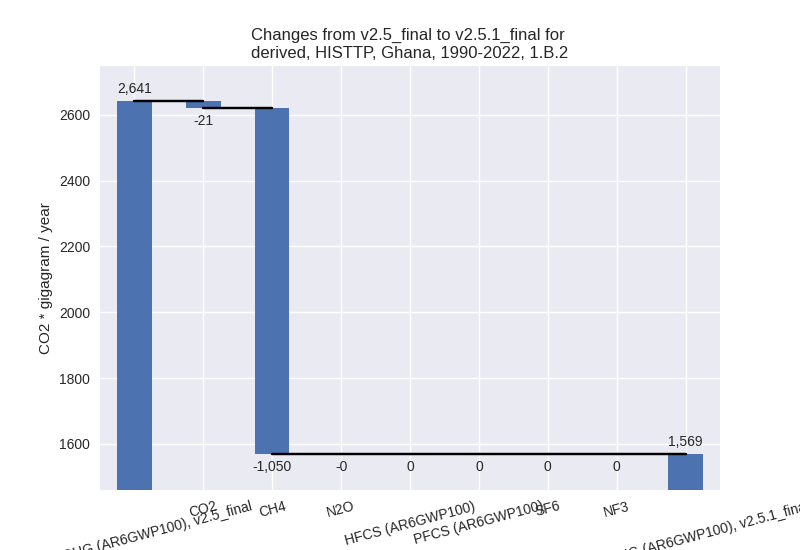
There is no subsector information available in PRIMAP-hist.
- 1.A: Total sectoral emissions in 2022 are 18505.07
Gg CO2 / year which is 61.4% of category 1 emissions. 2022 Emissions
have changed by -6.0% (-1180.74 Gg
CO2 / year). 1990-2022 Emissions have changed by -1.5% (-147.41 Gg CO2 / year). For 2022
the changes per gas
are:
- 2: Total sectoral emissions in 2022 are 2549.42 Gg
CO2 / year which is 5.2% of M.0.EL emissions. 2022 Emissions have
changed by -1.5% (-39.46 Gg CO2 /
year). 1990-2022 Emissions have changed by -3.4% (-39.53 Gg CO2 / year). For
1990-2022 the changes per gas
are:
- M.AG: Total sectoral emissions in 2022 are 10824.85
Gg CO2 / year which is 22.0% of M.0.EL emissions. 2022 Emissions have
changed by -9.9% (-1192.89 Gg CO2 /
year). 1990-2022 Emissions have changed by -2.7% (-236.99 Gg CO2 / year). For 2022
the changes per gas
are:

For 1990-2022 the changes per gas are: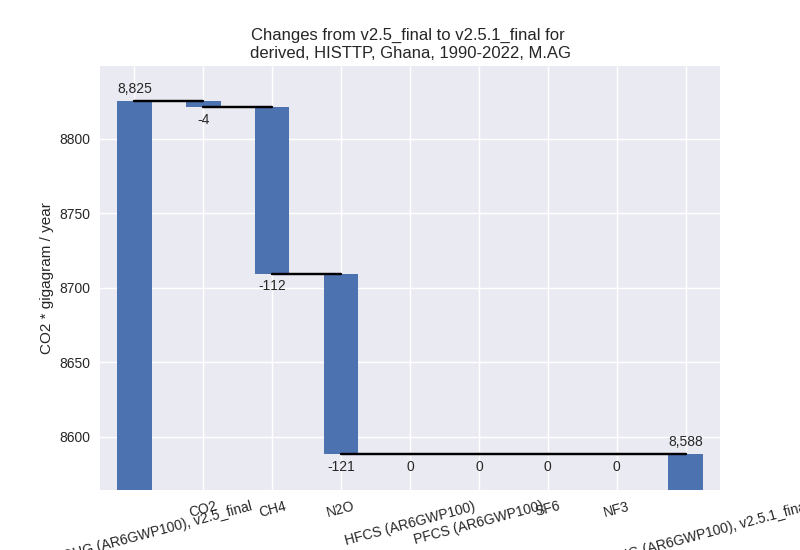
The changes come from the following subsectors:- 3.A: Total sectoral emissions in 2022 are 4290.51 Gg CO2 / year which is 39.6% of category M.AG emissions. 2022 Emissions have changed by -1.6% (-69.63 Gg CO2 / year). 1990-2022 Emissions have changed by -0.1% (-3.77 Gg CO2 / year).
- M.AG.ELV: Total sectoral emissions in 2022 are
6534.34 Gg CO2 / year which is 60.4% of category M.AG emissions. 2022
Emissions have changed by -14.7%
(-1123.26 Gg CO2 / year). 1990-2022 Emissions have changed by -3.8% (-233.22 Gg CO2 / year). For 2022
the changes per gas
are:

For 1990-2022 the changes per gas are:
There is no subsector information available in PRIMAP-hist.
- 4: Total sectoral emissions in 2022 are 5414.14 Gg CO2 / year which is 11.0% of M.0.EL emissions. 2022 Emissions have changed by 0.1% (7.00 Gg CO2 / year). 1990-2022 Emissions have changed by 0.0% (0.21 Gg CO2 / year).
- 5: Total sectoral emissions in 2022 are 328.20 Gg
CO2 / year which is 0.7% of M.0.EL emissions. 2022 Emissions have
changed by 15.3% (43.53 Gg CO2 /
year). 1990-2022 Emissions have changed by 0.7% (1.32 Gg CO2 / year). For 2022 the
changes per gas
are: