Changes in PRIMAP-hist v2.5.1_final compared to v2.5_final for Guinea
2024-02-29
Johannes Gütschow
Change analysis for Guinea for PRIMAP-hist v2.5.1_final compared to v2.5_final
Overview over emissions by sector and gas
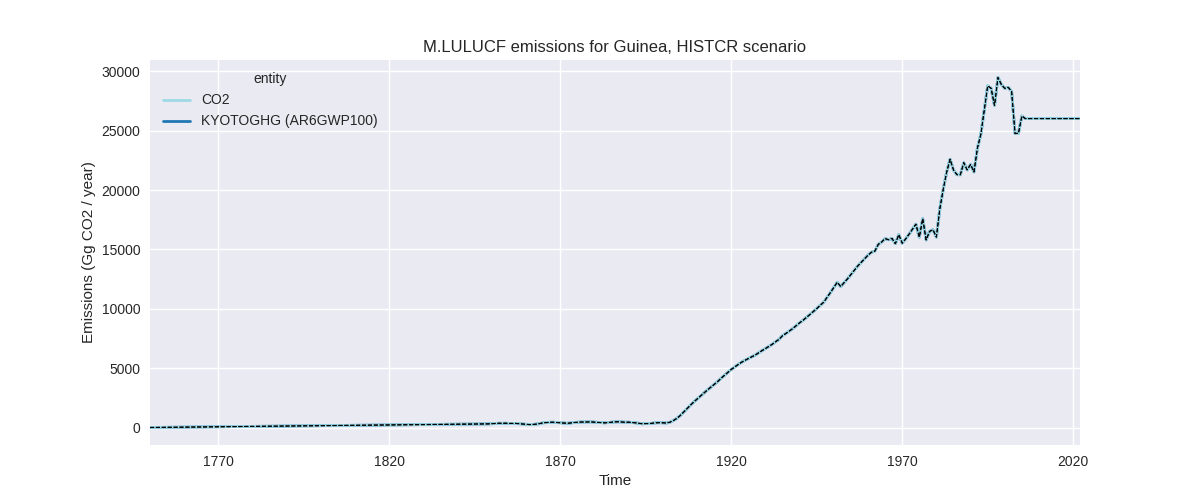
The following figures show the aggregate national total emissions excluding LULUCF AR6GWP100 for the country reported priority scenario. The dotted linesshow the v2.5_final data.


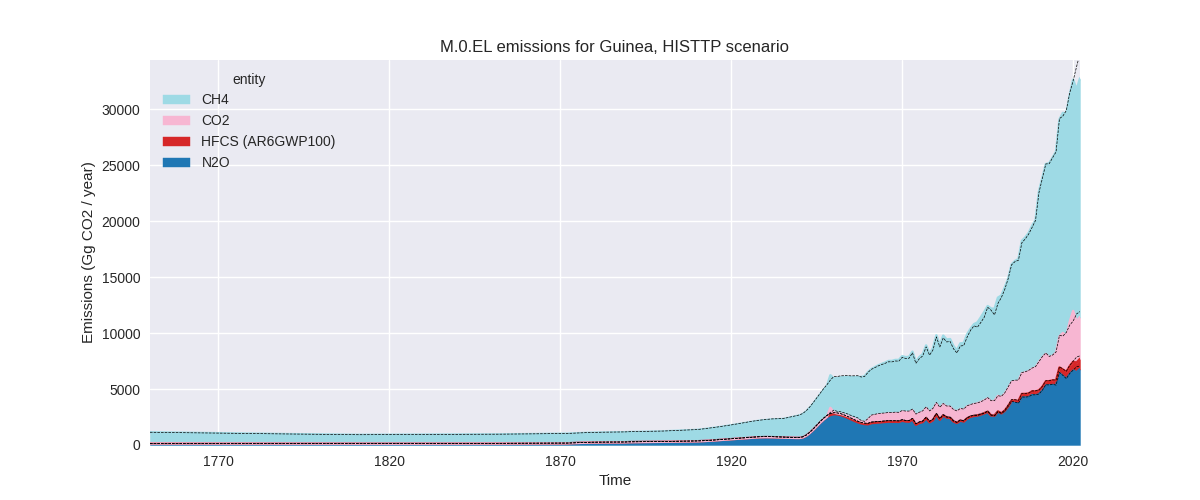
The following figures show the aggregate national total emissions excluding LULUCF AR6GWP100 for the third party priority scenario. The dotted linesshow the v2.5_final data.


Overview over changes
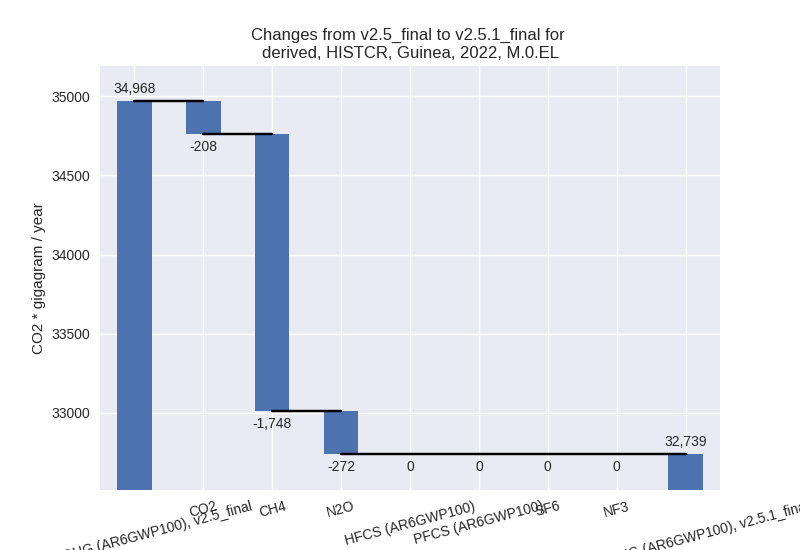
In the country reported priority scenario we have the following changes for aggregate Kyoto GHG and national total emissions excluding LULUCF (M.0.EL):
- Emissions in 2022 have changed by -6.4%% (-2228.77 Gg CO2 / year)
- Emissions in 1990-2022 have changed by -0.0%% (-7.95 Gg CO2 / year)
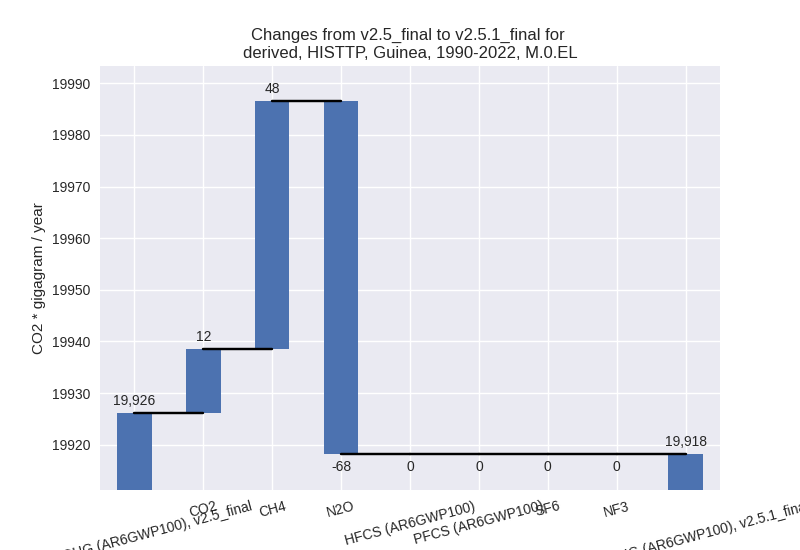
In the third party priority scenario we have the following changes for aggregate Kyoto GHG and national total emissions excluding LULUCF (M.0.EL):
- Emissions in 2022 have changed by -6.4%% (-2228.77 Gg CO2 / year)
- Emissions in 1990-2022 have changed by -0.0%% (-7.95 Gg CO2 / year)
Most important changes per scenario and time frame
In the country reported priority scenario the following sector-gas combinations have the highest absolute impact on national total KyotoGHG (AR6GWP100) emissions in 2022 (top 5):
- 1: M.AG.ELV, CH4 with -2179.68 Gg CO2 / year (-25.4%)
- 2: 3.A, CH4 with 433.77 Gg CO2 / year (4.7%)
- 3: M.AG.ELV, N2O with -318.65 Gg CO2 / year (-4.9%)
- 4: 1.A, CH4 with 220.46 Gg CO2 / year (14.5%)
- 5: 1.A, CO2 with -189.86 Gg CO2 / year (-4.9%)
In the country reported priority scenario the following sector-gas combinations have the highest absolute impact on national total KyotoGHG (AR6GWP100) emissions in 1990-2022 (top 5):
- 1: 1.A, CH4 with 298.16 Gg CO2 / year (25.3%)
- 2: M.AG.ELV, CH4 with -171.20 Gg CO2 / year (-3.5%)
- 3: M.AG.ELV, N2O with -103.38 Gg CO2 / year (-2.6%)
- 4: 1.B.2, CH4 with -53.78 Gg CO2 / year (-63.9%)
- 5: 1.B.1, CH4 with -47.73 Gg CO2 / year (-13.7%)
In the third party priority scenario the following sector-gas combinations have the highest absolute impact on national total KyotoGHG (AR6GWP100) emissions in 2022 (top 5):
- 1: M.AG.ELV, CH4 with -2179.68 Gg CO2 / year (-25.4%)
- 2: 3.A, CH4 with 433.77 Gg CO2 / year (4.7%)
- 3: M.AG.ELV, N2O with -318.65 Gg CO2 / year (-4.9%)
- 4: 1.A, CH4 with 220.46 Gg CO2 / year (14.5%)
- 5: 1.A, CO2 with -189.86 Gg CO2 / year (-4.9%)
In the third party priority scenario the following sector-gas combinations have the highest absolute impact on national total KyotoGHG (AR6GWP100) emissions in 1990-2022 (top 5):
- 1: 1.A, CH4 with 298.16 Gg CO2 / year (25.3%)
- 2: M.AG.ELV, CH4 with -171.20 Gg CO2 / year (-3.5%)
- 3: M.AG.ELV, N2O with -103.38 Gg CO2 / year (-2.6%)
- 4: 1.B.2, CH4 with -53.78 Gg CO2 / year (-63.9%)
- 5: 1.B.1, CH4 with -47.73 Gg CO2 / year (-13.7%)
Notes on data changes
Here we list notes explaining important emissions changes for the country. ’' means that the following text only applies to the TP time series, while means that it only applies to the CR scenario. Otherwise the note applies to both scenarios.
General note: We have no country reported data for Guinea, thus the CR and TP time-series are identical except for LULUCF.
- M.AG.ELV, CH4: FAO 2023 data corrects 2019 and 2020 growth rates downwards and leads to lower 2022 emission in PRIMAP-hist.
- 3.A, CH4: New FAO data leads to slightly higher 2022 emissions.
- 1.A, CH4: EDGAR 8.0 data are higher than EDGAR 7.0 for all years.
Changes by sector and gas
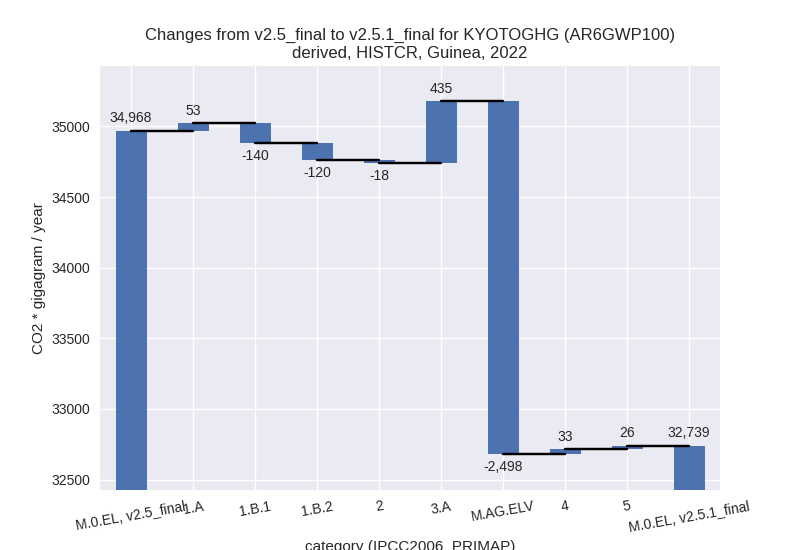
For each scenario and time frame the changes are displayed for all individual sectors and all individual gases. In the sector plot we use aggregate Kyoto GHGs in AR6GWP100. In the gas plot we usenational total emissions without LULUCF. ## country reported scenario
2022
1990-2022


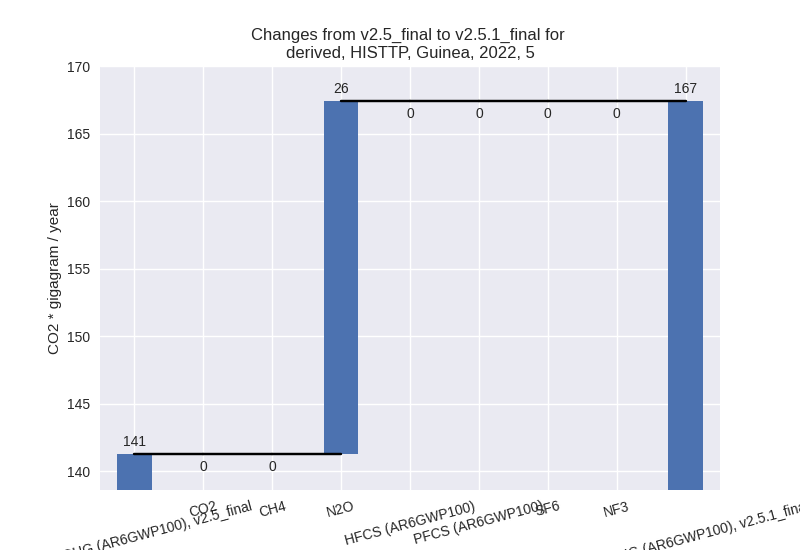
third party scenario
2022


1990-2022

Detailed changes for the scenarios:
country reported scenario (HISTCR):
Most important changes per time frame
For 2022 the following sector-gas combinations have the highest absolute impact on national total KyotoGHG (AR6GWP100) emissions in 2022 (top 5):
- 1: M.AG.ELV, CH4 with -2179.68 Gg CO2 / year (-25.4%)
- 2: 3.A, CH4 with 433.77 Gg CO2 / year (4.7%)
- 3: M.AG.ELV, N2O with -318.65 Gg CO2 / year (-4.9%)
- 4: 1.A, CH4 with 220.46 Gg CO2 / year (14.5%)
- 5: 1.A, CO2 with -189.86 Gg CO2 / year (-4.9%)
For 1990-2022 the following sector-gas combinations have the highest absolute impact on national total KyotoGHG (AR6GWP100) emissions in 1990-2022 (top 5):
- 1: 1.A, CH4 with 298.16 Gg CO2 / year (25.3%)
- 2: M.AG.ELV, CH4 with -171.20 Gg CO2 / year (-3.5%)
- 3: M.AG.ELV, N2O with -103.38 Gg CO2 / year (-2.6%)
- 4: 1.B.2, CH4 with -53.78 Gg CO2 / year (-63.9%)
- 5: 1.B.1, CH4 with -47.73 Gg CO2 / year (-13.7%)
Changes in the main sectors for aggregate KyotoGHG (AR6GWP100) are
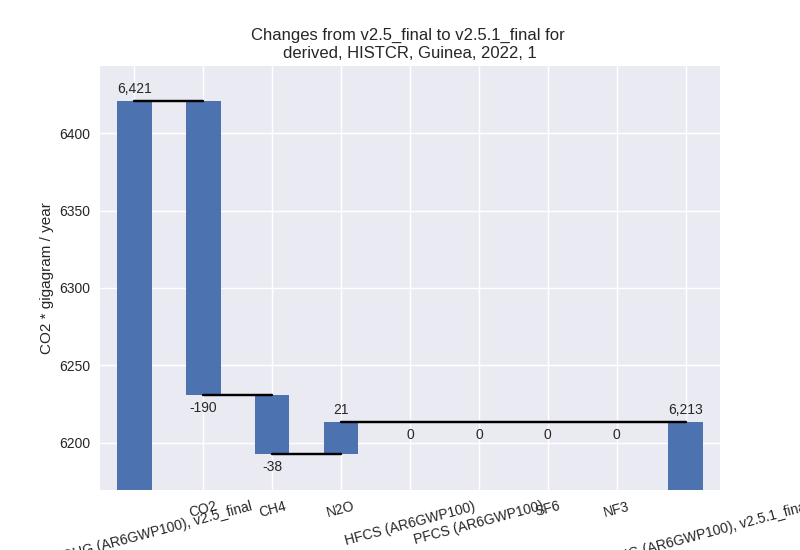
- 1: Total sectoral emissions in 2022 are 6213.29 Gg
CO2 / year which is 19.0% of M.0.EL emissions. 2022 Emissions have
changed by -3.2% (-207.22 Gg CO2 /
year). 1990-2022 Emissions have changed by 6.9% (264.06 Gg CO2 / year). For 2022 the
changes per gas
are:
For 1990-2022 the changes per gas are:
The changes come from the following subsectors:- 1.A: Total sectoral emissions in 2022 are 5687.31
Gg CO2 / year which is 91.5% of category 1 emissions. 2022 Emissions
have changed by 0.9% (53.00 Gg CO2 /
year). 1990-2022 Emissions have changed by 10.8% (366.20 Gg CO2 / year). For
1990-2022 the changes per gas
are:

There is no subsector information available in PRIMAP-hist. - 1.B.1: Total sectoral emissions in 2022 are 466.62
Gg CO2 / year which is 7.5% of category 1 emissions. 2022 Emissions have
changed by -23.1% (-140.02 Gg CO2 /
year). 1990-2022 Emissions have changed by -13.7% (-48.36 Gg CO2 / year). For 2022
the changes per gas
are:

For 1990-2022 the changes per gas are:
There is no subsector information available in PRIMAP-hist. - 1.B.2: Total sectoral emissions in 2022 are 59.36
Gg CO2 / year which is 1.0% of category 1 emissions. 2022 Emissions have
changed by -66.9% (-120.20 Gg CO2 /
year). 1990-2022 Emissions have changed by -63.9% (-53.78 Gg CO2 / year). For 2022
the changes per gas
are:

For 1990-2022 the changes per gas are: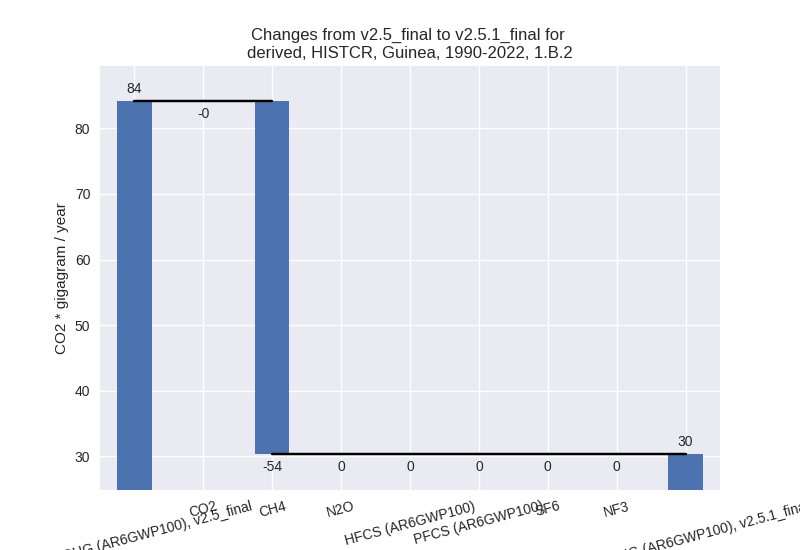
There is no subsector information available in PRIMAP-hist.
- 1.A: Total sectoral emissions in 2022 are 5687.31
Gg CO2 / year which is 91.5% of category 1 emissions. 2022 Emissions
have changed by 0.9% (53.00 Gg CO2 /
year). 1990-2022 Emissions have changed by 10.8% (366.20 Gg CO2 / year). For
1990-2022 the changes per gas
are:
- 2: Total sectoral emissions in 2022 are 959.76 Gg
CO2 / year which is 2.9% of M.0.EL emissions. 2022 Emissions have
changed by -1.9% (-18.17 Gg CO2 /
year). 1990-2022 Emissions have changed by -5.8% (-20.54 Gg CO2 / year). For
1990-2022 the changes per gas
are:

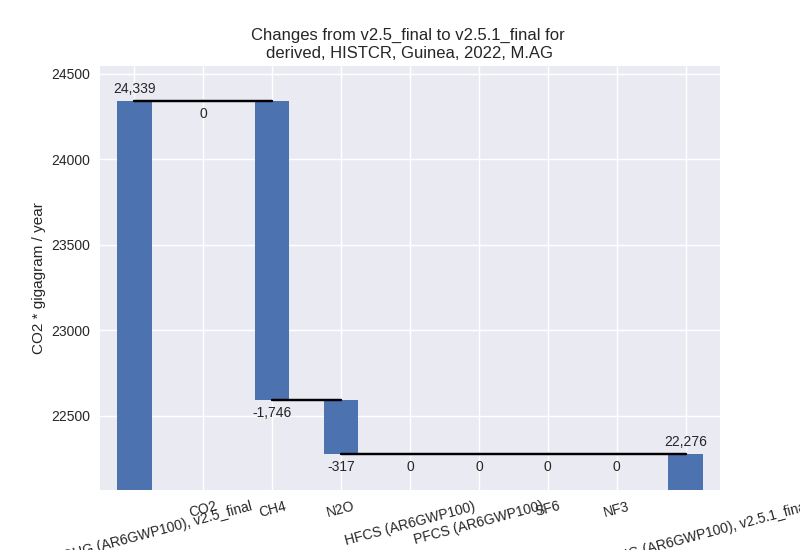
- M.AG: Total sectoral emissions in 2022 are 22275.62
Gg CO2 / year which is 68.0% of M.0.EL emissions. 2022 Emissions have
changed by -8.5% (-2062.90 Gg CO2 /
year). 1990-2022 Emissions have changed by -1.9% (-253.28 Gg CO2 / year). For 2022
the changes per gas
are:
The changes come from the following subsectors:- 3.A: Total sectoral emissions in 2022 are 9760.83
Gg CO2 / year which is 43.8% of category M.AG emissions. 2022 Emissions
have changed by 4.7% (435.43 Gg CO2
/ year). 1990-2022 Emissions have changed by 0.5% (21.54 Gg CO2 / year). For 2022 the
changes per gas
are:

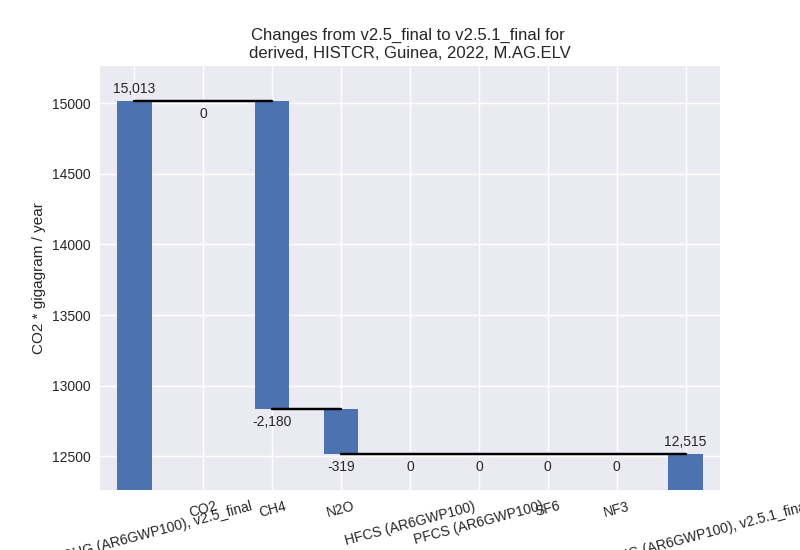
There is no subsector information available in PRIMAP-hist. - M.AG.ELV: Total sectoral emissions in 2022 are
12514.79 Gg CO2 / year which is 56.2% of category M.AG emissions. 2022
Emissions have changed by -16.6%
(-2498.33 Gg CO2 / year). 1990-2022 Emissions have changed by -3.1% (-274.81 Gg CO2 / year). For 2022
the changes per gas
are:
For 1990-2022 the changes per gas are: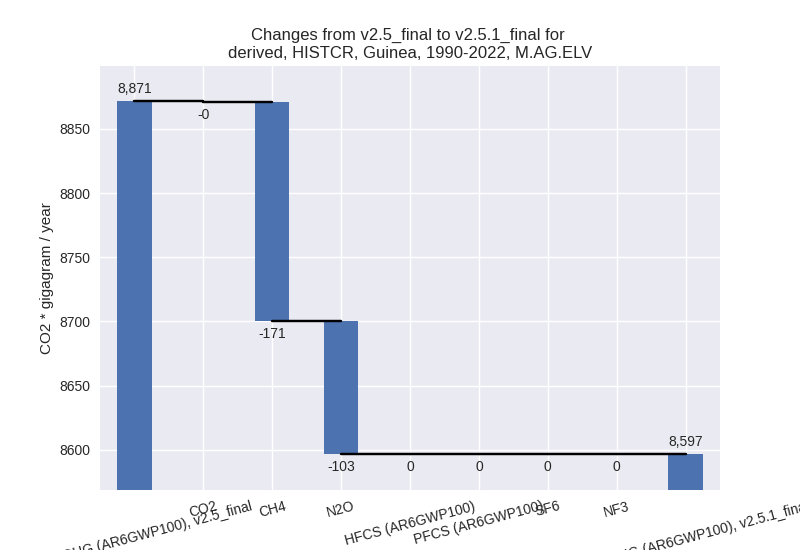
There is no subsector information available in PRIMAP-hist.
- 3.A: Total sectoral emissions in 2022 are 9760.83
Gg CO2 / year which is 43.8% of category M.AG emissions. 2022 Emissions
have changed by 4.7% (435.43 Gg CO2
/ year). 1990-2022 Emissions have changed by 0.5% (21.54 Gg CO2 / year). For 2022 the
changes per gas
are:
- 4: Total sectoral emissions in 2022 are 3123.25 Gg CO2 / year which is 9.5% of M.0.EL emissions. 2022 Emissions have changed by 1.1% (33.39 Gg CO2 / year). 1990-2022 Emissions have changed by 0.0% (1.01 Gg CO2 / year).
- 5: Total sectoral emissions in 2022 are 167.39 Gg
CO2 / year which is 0.5% of M.0.EL emissions. 2022 Emissions have
changed by 18.5% (26.12 Gg CO2 /
year). 1990-2022 Emissions have changed by 0.8% (0.79 Gg CO2 / year). For 2022 the
changes per gas
are:

third party scenario (HISTTP):
Most important changes per time frame
For 2022 the following sector-gas combinations have the highest absolute impact on national total KyotoGHG (AR6GWP100) emissions in 2022 (top 5):
- 1: M.AG.ELV, CH4 with -2179.68 Gg CO2 / year (-25.4%)
- 2: 3.A, CH4 with 433.77 Gg CO2 / year (4.7%)
- 3: M.AG.ELV, N2O with -318.65 Gg CO2 / year (-4.9%)
- 4: 1.A, CH4 with 220.46 Gg CO2 / year (14.5%)
- 5: 1.A, CO2 with -189.86 Gg CO2 / year (-4.9%)
For 1990-2022 the following sector-gas combinations have the highest absolute impact on national total KyotoGHG (AR6GWP100) emissions in 1990-2022 (top 5):
- 1: 1.A, CH4 with 298.16 Gg CO2 / year (25.3%)
- 2: M.AG.ELV, CH4 with -171.20 Gg CO2 / year (-3.5%)
- 3: M.AG.ELV, N2O with -103.38 Gg CO2 / year (-2.6%)
- 4: 1.B.2, CH4 with -53.78 Gg CO2 / year (-63.9%)
- 5: 1.B.1, CH4 with -47.73 Gg CO2 / year (-13.7%)
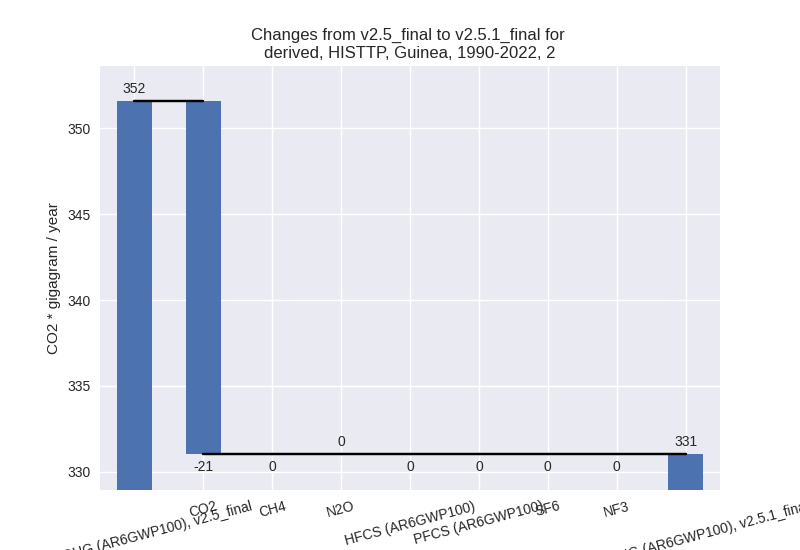
Changes in the main sectors for aggregate KyotoGHG (AR6GWP100) are
- 1: Total sectoral emissions in 2022 are 6213.29 Gg
CO2 / year which is 19.0% of M.0.EL emissions. 2022 Emissions have
changed by -3.2% (-207.22 Gg CO2 /
year). 1990-2022 Emissions have changed by 6.9% (264.06 Gg CO2 / year). For 2022 the
changes per gas
are:

For 1990-2022 the changes per gas are: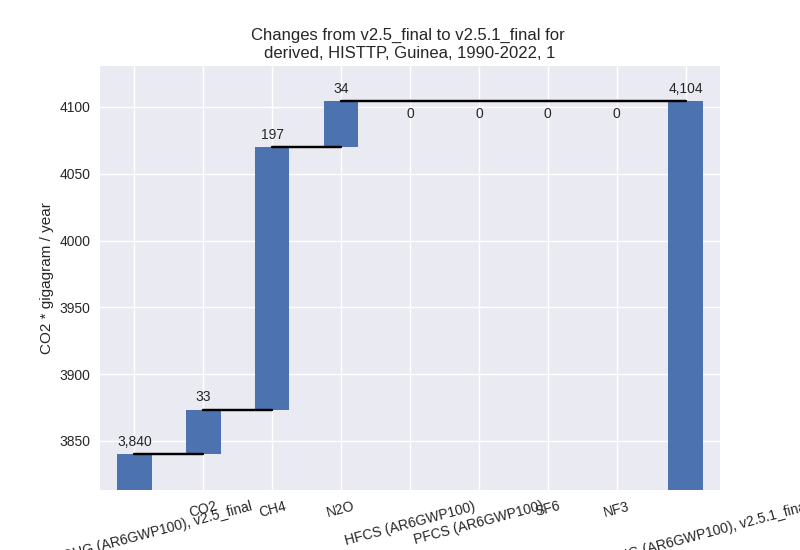
The changes come from the following subsectors:- 1.A: Total sectoral emissions in 2022 are 5687.31
Gg CO2 / year which is 91.5% of category 1 emissions. 2022 Emissions
have changed by 0.9% (53.00 Gg CO2 /
year). 1990-2022 Emissions have changed by 10.8% (366.20 Gg CO2 / year). For
1990-2022 the changes per gas
are:

There is no subsector information available in PRIMAP-hist. - 1.B.1: Total sectoral emissions in 2022 are 466.62
Gg CO2 / year which is 7.5% of category 1 emissions. 2022 Emissions have
changed by -23.1% (-140.02 Gg CO2 /
year). 1990-2022 Emissions have changed by -13.7% (-48.36 Gg CO2 / year). For 2022
the changes per gas
are:

For 1990-2022 the changes per gas are: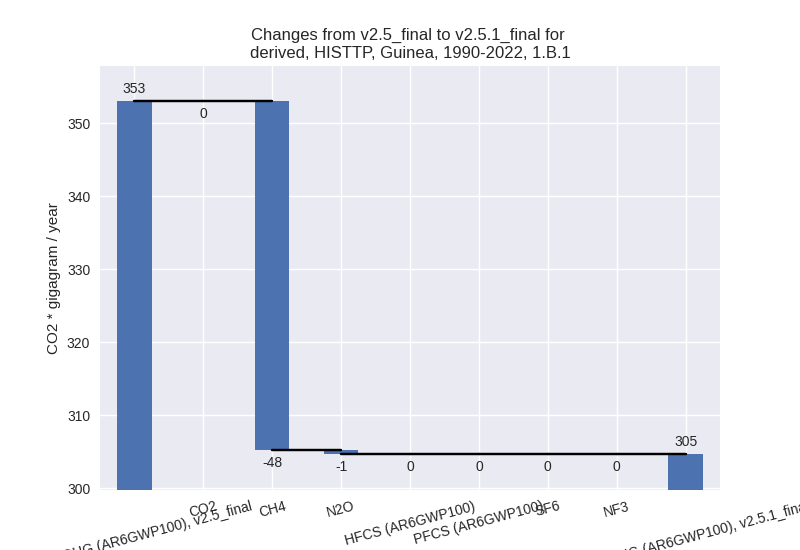
There is no subsector information available in PRIMAP-hist. - 1.B.2: Total sectoral emissions in 2022 are 59.36
Gg CO2 / year which is 1.0% of category 1 emissions. 2022 Emissions have
changed by -66.9% (-120.20 Gg CO2 /
year). 1990-2022 Emissions have changed by -63.9% (-53.78 Gg CO2 / year). For 2022
the changes per gas
are:

For 1990-2022 the changes per gas are:
There is no subsector information available in PRIMAP-hist.
- 1.A: Total sectoral emissions in 2022 are 5687.31
Gg CO2 / year which is 91.5% of category 1 emissions. 2022 Emissions
have changed by 0.9% (53.00 Gg CO2 /
year). 1990-2022 Emissions have changed by 10.8% (366.20 Gg CO2 / year). For
1990-2022 the changes per gas
are:
- 2: Total sectoral emissions in 2022 are 959.76 Gg
CO2 / year which is 2.9% of M.0.EL emissions. 2022 Emissions have
changed by -1.9% (-18.17 Gg CO2 /
year). 1990-2022 Emissions have changed by -5.8% (-20.54 Gg CO2 / year). For
1990-2022 the changes per gas
are:
- M.AG: Total sectoral emissions in 2022 are 22275.62
Gg CO2 / year which is 68.0% of M.0.EL emissions. 2022 Emissions have
changed by -8.5% (-2062.90 Gg CO2 /
year). 1990-2022 Emissions have changed by -1.9% (-253.28 Gg CO2 / year). For 2022
the changes per gas
are:

The changes come from the following subsectors:- 3.A: Total sectoral emissions in 2022 are 9760.83
Gg CO2 / year which is 43.8% of category M.AG emissions. 2022 Emissions
have changed by 4.7% (435.43 Gg CO2
/ year). 1990-2022 Emissions have changed by 0.5% (21.54 Gg CO2 / year). For 2022 the
changes per gas
are:
There is no subsector information available in PRIMAP-hist. - M.AG.ELV: Total sectoral emissions in 2022 are
12514.79 Gg CO2 / year which is 56.2% of category M.AG emissions. 2022
Emissions have changed by -16.6%
(-2498.33 Gg CO2 / year). 1990-2022 Emissions have changed by -3.1% (-274.81 Gg CO2 / year). For 2022
the changes per gas
are:

For 1990-2022 the changes per gas are:
There is no subsector information available in PRIMAP-hist.
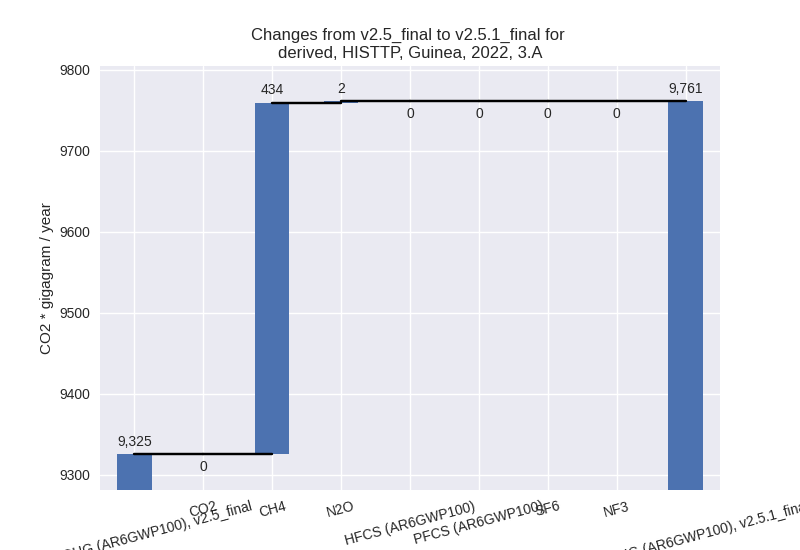
- 3.A: Total sectoral emissions in 2022 are 9760.83
Gg CO2 / year which is 43.8% of category M.AG emissions. 2022 Emissions
have changed by 4.7% (435.43 Gg CO2
/ year). 1990-2022 Emissions have changed by 0.5% (21.54 Gg CO2 / year). For 2022 the
changes per gas
are:
- 4: Total sectoral emissions in 2022 are 3123.25 Gg CO2 / year which is 9.5% of M.0.EL emissions. 2022 Emissions have changed by 1.1% (33.39 Gg CO2 / year). 1990-2022 Emissions have changed by 0.0% (1.01 Gg CO2 / year).
- 5: Total sectoral emissions in 2022 are 167.39 Gg
CO2 / year which is 0.5% of M.0.EL emissions. 2022 Emissions have
changed by 18.5% (26.12 Gg CO2 /
year). 1990-2022 Emissions have changed by 0.8% (0.79 Gg CO2 / year). For 2022 the
changes per gas
are: