Changes in PRIMAP-hist v2.5.1_final compared to v2.5_final for Gambia
2024-02-29
Johannes Gütschow
Change analysis for Gambia for PRIMAP-hist v2.5.1_final compared to v2.5_final
Overview over emissions by sector and gas
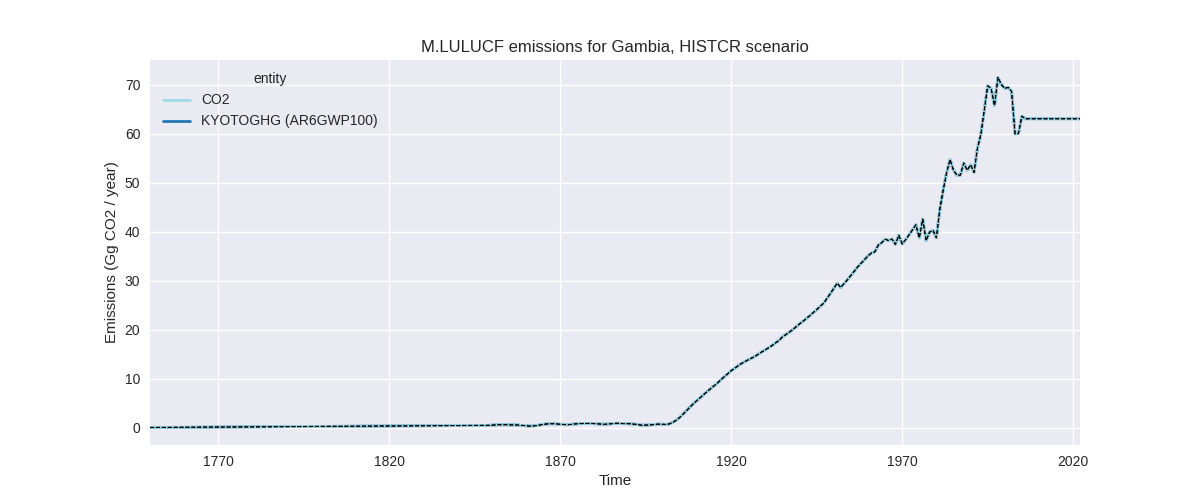
The following figures show the aggregate national total emissions excluding LULUCF AR6GWP100 for the country reported priority scenario. The dotted linesshow the v2.5_final data.


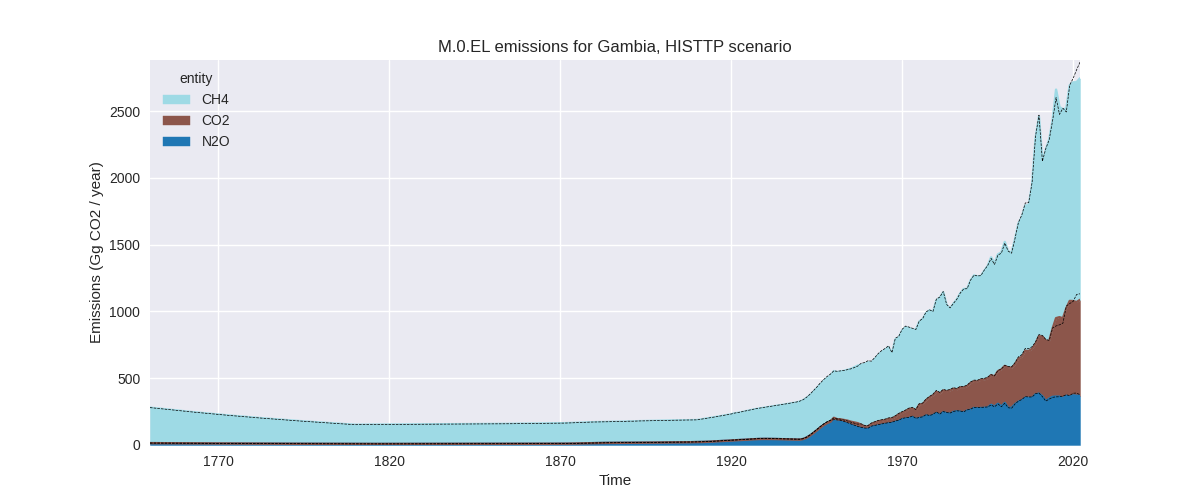
The following figures show the aggregate national total emissions excluding LULUCF AR6GWP100 for the third party priority scenario. The dotted linesshow the v2.5_final data.


Overview over changes
In the country reported priority scenario we have the following changes for aggregate Kyoto GHG and national total emissions excluding LULUCF (M.0.EL):
- Emissions in 2022 have changed by -5.2%% (-158.06 Gg CO2 / year)
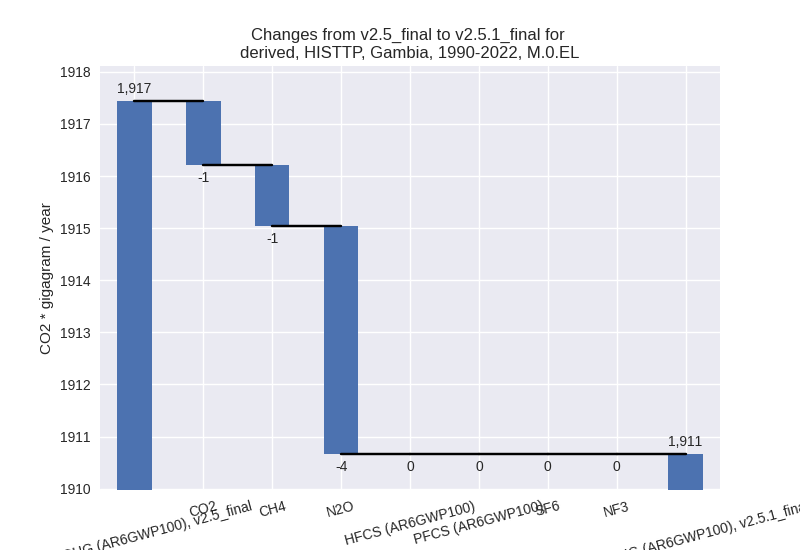
- Emissions in 1990-2022 have changed by -1.2%% (-24.46 Gg CO2 / year)
In the third party priority scenario we have the following changes for aggregate Kyoto GHG and national total emissions excluding LULUCF (M.0.EL):
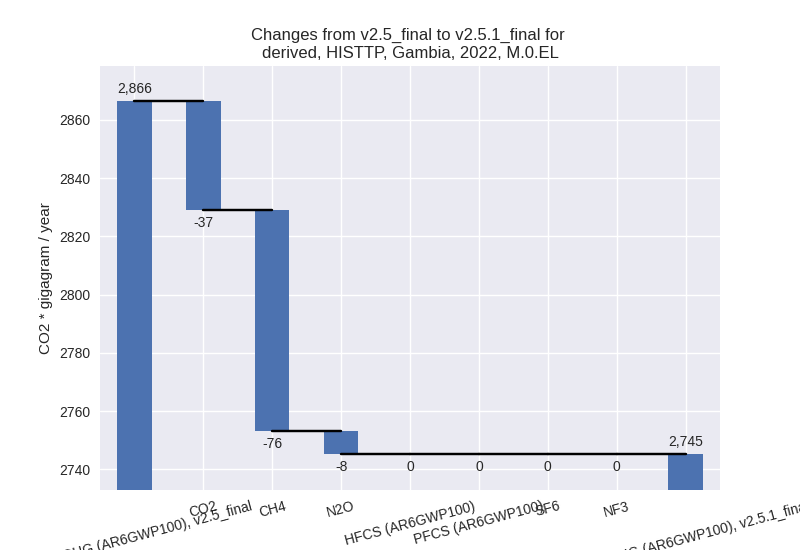
- Emissions in 2022 have changed by -4.2%% (-121.21 Gg CO2 / year)
- Emissions in 1990-2022 have changed by -0.4%% (-6.77 Gg CO2 / year)
Most important changes per scenario and time frame
In the country reported priority scenario the following sector-gas combinations have the highest absolute impact on national total KyotoGHG (AR6GWP100) emissions in 2022 (top 5):
- 1: M.AG.ELV, CH4 with -43.20 Gg CO2 / year (-7.9%)
- 2: 1.A, CO2 with -27.05 Gg CO2 / year (-3.6%)
- 3: 1.A, CH4 with -24.88 Gg CO2 / year (-10.6%)
- 4: 3.A, CH4 with -23.42 Gg CO2 / year (-4.3%)
- 5: 1.B.1, CH4 with -23.35 Gg CO2 / year (-23.2%)
In the country reported priority scenario the following sector-gas combinations have the highest absolute impact on national total KyotoGHG (AR6GWP100) emissions in 1990-2022 (top 5):
- 1: 1.B.1, CH4 with -7.52 Gg CO2 / year (-11.7%)
- 2: 1.A, CO2 with 6.32 Gg CO2 / year (1.7%)
- 3: M.AG.ELV, N2O with -5.70 Gg CO2 / year (-2.0%)
- 4: 2, CO2 with -4.68 Gg CO2 / year (-53.7%)
- 5: 1.A, CH4 with -4.52 Gg CO2 / year (-3.0%)
In the third party priority scenario the following sector-gas combinations have the highest absolute impact on national total KyotoGHG (AR6GWP100) emissions in 2022 (top 5):
- 1: M.AG.ELV, CH4 with -43.20 Gg CO2 / year (-7.9%)
- 2: 1.A, CO2 with -32.66 Gg CO2 / year (-4.4%)
- 3: 3.A, CH4 with -23.42 Gg CO2 / year (-4.3%)
- 4: 1.B.1, CH4 with -23.35 Gg CO2 / year (-23.2%)
- 5: 1.A, CH4 with 13.90 Gg CO2 / year (13.8%)
In the third party priority scenario the following sector-gas combinations have the highest absolute impact on national total KyotoGHG (AR6GWP100) emissions in 1990-2022 (top 5):
- 1: 1.A, CH4 with 13.95 Gg CO2 / year (19.7%)
- 2: 1.B.1, CH4 with -7.52 Gg CO2 / year (-11.7%)
- 3: M.AG.ELV, N2O with -5.70 Gg CO2 / year (-2.0%)
- 4: 2, CO2 with -4.68 Gg CO2 / year (-53.7%)
- 5: 3.A, CH4 with -4.32 Gg CO2 / year (-0.9%)
Notes on data changes
Here we list notes explaining important emissions changes for the country. ’' means that the following text only applies to the TP time series, while means that it only applies to the CR scenario. Otherwise the note applies to both scenarios.
- 1.B.1, CH4: EDGAR 8.0 data are lower than EDGAR 7.0
- M.AG.ELV, CH4: New FAO and EDGAR data replace numerical extrapolation leading to lower 2022 emissions.
- 1.A, CO2: CDIAC 2023 growth rates differ from EI 2023 leading to some changes in PRIMAP-hist for the last years
- 1.A, CH4: EDGAR 8.0 emissions are higher than EDGAR 7.0 emissions leading to higher PRIMAP-hist emissions. Growth rates of EDGAR 8.0 post 2010 are lower than in EDGAR 7.0 leading to lower emissions in PRIMAP-hist.
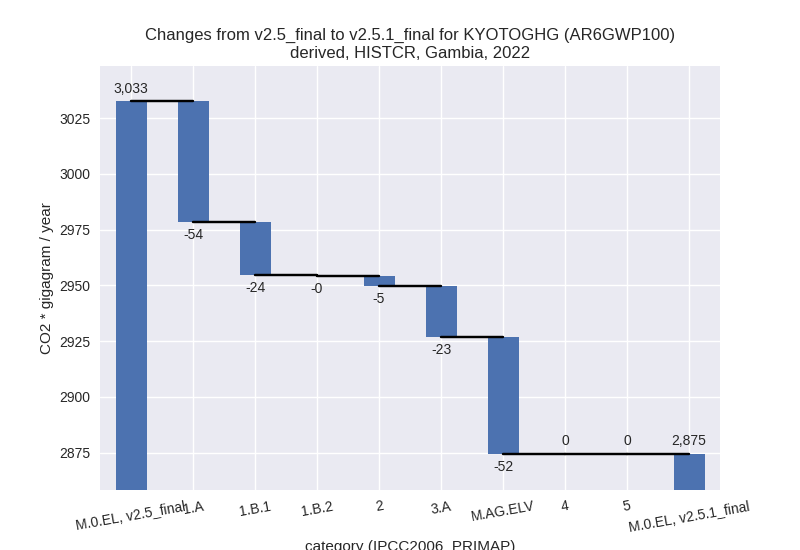
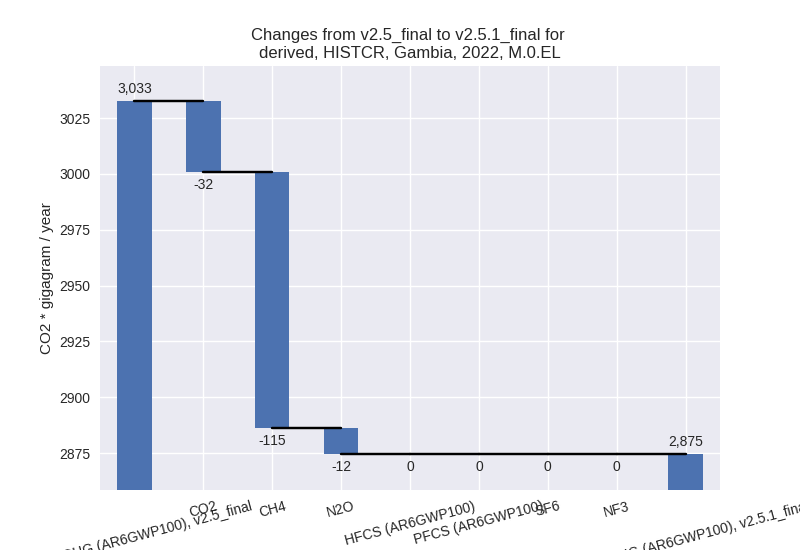
Changes by sector and gas
For each scenario and time frame the changes are displayed for all individual sectors and all individual gases. In the sector plot we use aggregate Kyoto GHGs in AR6GWP100. In the gas plot we usenational total emissions without LULUCF. ## country reported scenario
2022
1990-2022

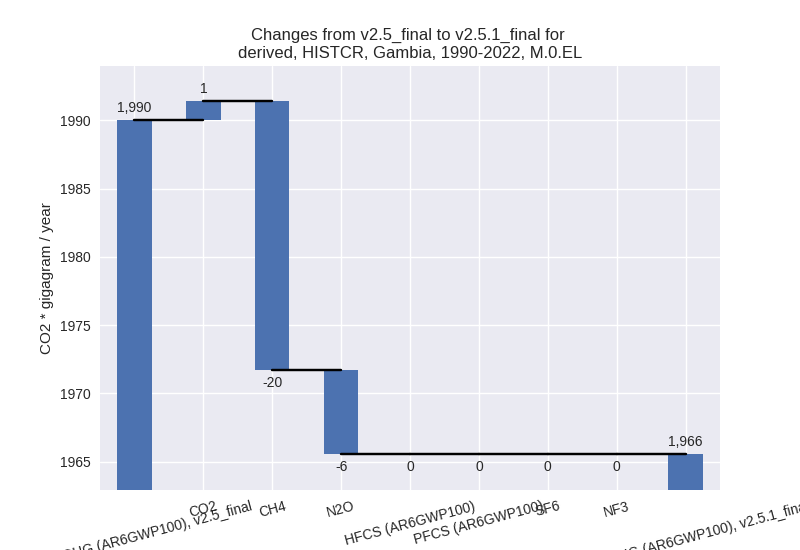
third party scenario
2022
1990-2022

Detailed changes for the scenarios:
country reported scenario (HISTCR):
Most important changes per time frame
For 2022 the following sector-gas combinations have the highest absolute impact on national total KyotoGHG (AR6GWP100) emissions in 2022 (top 5):
- 1: M.AG.ELV, CH4 with -43.20 Gg CO2 / year (-7.9%)
- 2: 1.A, CO2 with -27.05 Gg CO2 / year (-3.6%)
- 3: 1.A, CH4 with -24.88 Gg CO2 / year (-10.6%)
- 4: 3.A, CH4 with -23.42 Gg CO2 / year (-4.3%)
- 5: 1.B.1, CH4 with -23.35 Gg CO2 / year (-23.2%)
For 1990-2022 the following sector-gas combinations have the highest absolute impact on national total KyotoGHG (AR6GWP100) emissions in 1990-2022 (top 5):
- 1: 1.B.1, CH4 with -7.52 Gg CO2 / year (-11.7%)
- 2: 1.A, CO2 with 6.32 Gg CO2 / year (1.7%)
- 3: M.AG.ELV, N2O with -5.70 Gg CO2 / year (-2.0%)
- 4: 2, CO2 with -4.68 Gg CO2 / year (-53.7%)
- 5: 1.A, CH4 with -4.52 Gg CO2 / year (-3.0%)
Changes in the main sectors for aggregate KyotoGHG (AR6GWP100) are
- 1: Total sectoral emissions in 2022 are 1054.07 Gg
CO2 / year which is 36.7% of M.0.EL emissions. 2022 Emissions have
changed by -6.9% (-78.18 Gg CO2 /
year). 1990-2022 Emissions have changed by -1.0% (-6.29 Gg CO2 / year). For 2022 the
changes per gas
are:

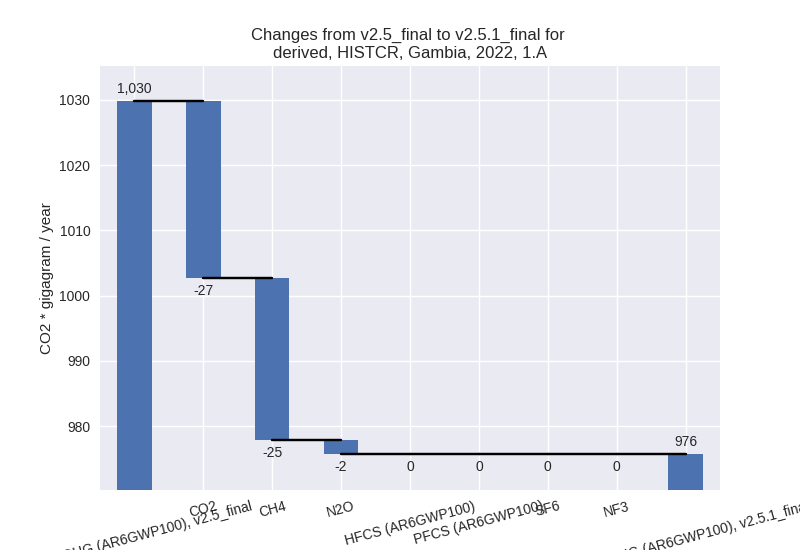
The changes come from the following subsectors:- 1.A: Total sectoral emissions in 2022 are 975.70 Gg
CO2 / year which is 92.6% of category 1 emissions. 2022 Emissions have
changed by -5.3% (-54.10 Gg CO2 /
year). 1990-2022 Emissions have changed by 0.3% (1.41 Gg CO2 / year). For 2022 the
changes per gas
are:
There is no subsector information available in PRIMAP-hist. - 1.B.1: Total sectoral emissions in 2022 are 78.38
Gg CO2 / year which is 7.4% of category 1 emissions. 2022 Emissions have
changed by -23.2% (-23.66 Gg CO2 /
year). 1990-2022 Emissions have changed by -11.7% (-7.62 Gg CO2 / year). For 2022 the
changes per gas
are:
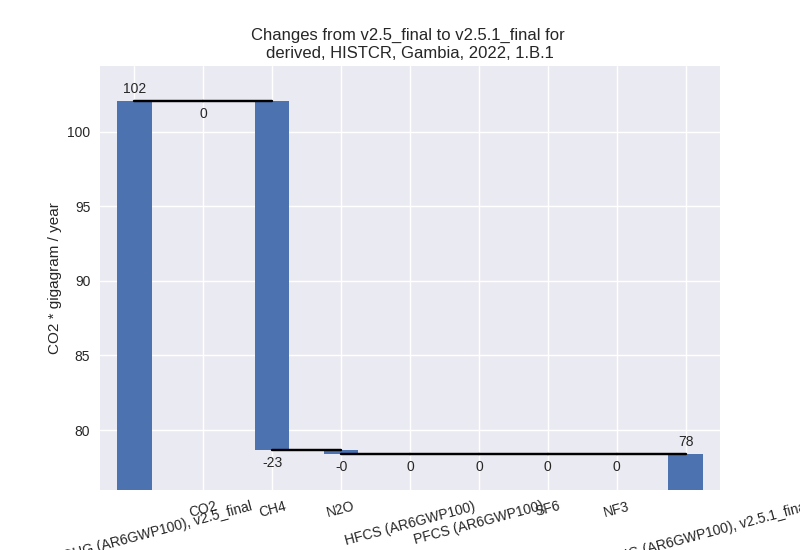
For 1990-2022 the changes per gas are:
There is no subsector information available in PRIMAP-hist. - 1.B.2: Total sectoral emissions in 2022 are 0.00 Gg
CO2 / year which is 0.0% of category 1 emissions. 2022 Emissions have
changed by -99.6% (-0.42 Gg CO2 /
year). 1990-2022 Emissions have changed by -98.3% (-0.09 Gg CO2 / year). For 2022 the
changes per gas
are:
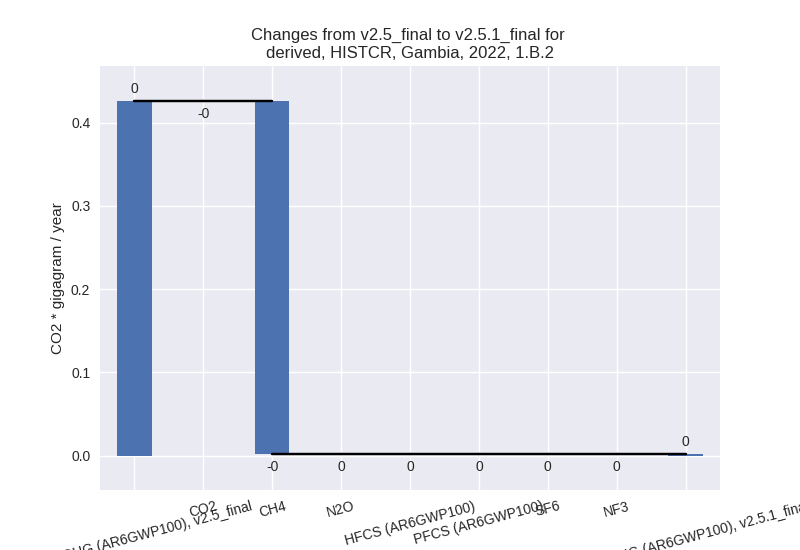
For 1990-2022 the changes per gas are:
There is no subsector information available in PRIMAP-hist.
- 1.A: Total sectoral emissions in 2022 are 975.70 Gg
CO2 / year which is 92.6% of category 1 emissions. 2022 Emissions have
changed by -5.3% (-54.10 Gg CO2 /
year). 1990-2022 Emissions have changed by 0.3% (1.41 Gg CO2 / year). For 2022 the
changes per gas
are:
- 2: Total sectoral emissions in 2022 are 6.24 Gg CO2
/ year which is 0.2% of M.0.EL emissions. 2022 Emissions have changed by
-42.8% (-4.67 Gg CO2 / year).
1990-2022 Emissions have changed by -53.7% (-4.68 Gg CO2 / year). For 2022 the
changes per gas
are:
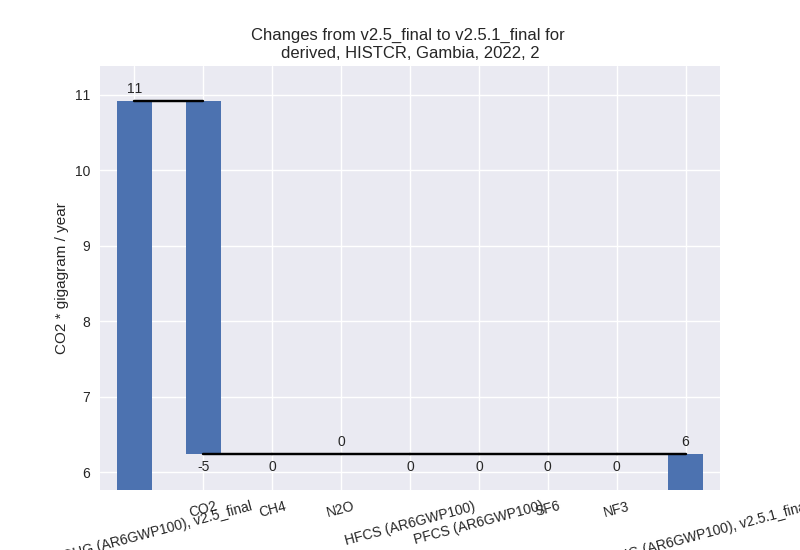
For 1990-2022 the changes per gas are:
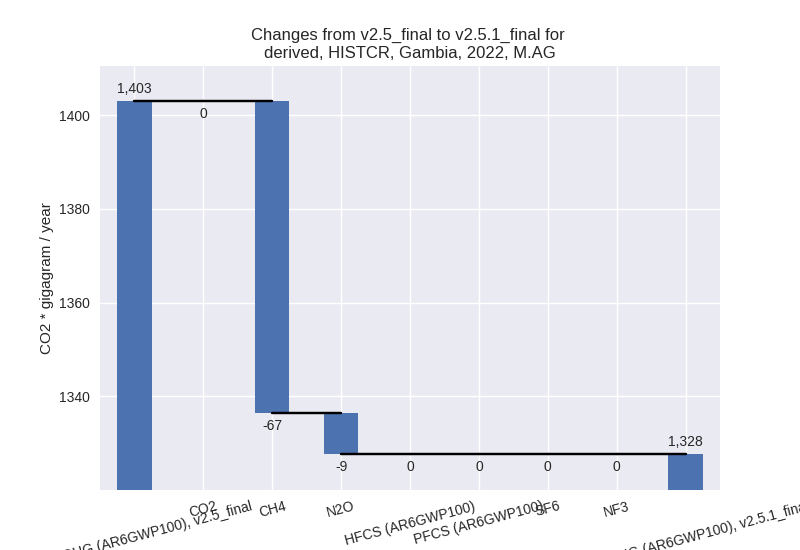
- M.AG: Total sectoral emissions in 2022 are 1327.59
Gg CO2 / year which is 46.2% of M.0.EL emissions. 2022 Emissions have
changed by -5.4% (-75.43 Gg CO2 /
year). 1990-2022 Emissions have changed by -1.3% (-13.49 Gg CO2 / year). For 2022 the
changes per gas
are:
The changes come from the following subsectors:- 3.A: Total sectoral emissions in 2022 are 523.31 Gg
CO2 / year which is 39.4% of category M.AG emissions. 2022 Emissions
have changed by -4.2% (-22.95 Gg CO2
/ year). 1990-2022 Emissions have changed by -0.9% (-4.33 Gg CO2 / year). For 2022 the
changes per gas
are:

There is no subsector information available in PRIMAP-hist. - M.AG.ELV: Total sectoral emissions in 2022 are
804.28 Gg CO2 / year which is 60.6% of category M.AG emissions. 2022
Emissions have changed by -6.1%
(-52.48 Gg CO2 / year). 1990-2022 Emissions have changed by -1.5% (-9.16 Gg CO2 / year). For 2022 the
changes per gas
are:
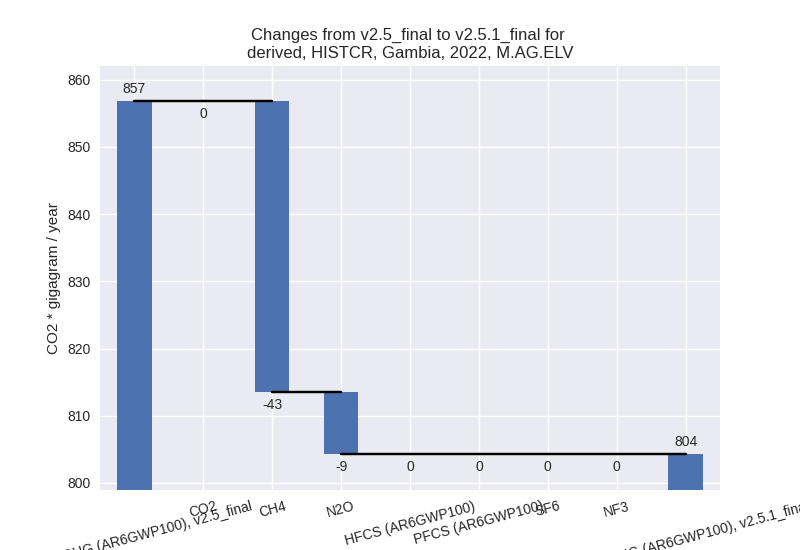
There is no subsector information available in PRIMAP-hist.
- 3.A: Total sectoral emissions in 2022 are 523.31 Gg
CO2 / year which is 39.4% of category M.AG emissions. 2022 Emissions
have changed by -4.2% (-22.95 Gg CO2
/ year). 1990-2022 Emissions have changed by -0.9% (-4.33 Gg CO2 / year). For 2022 the
changes per gas
are:
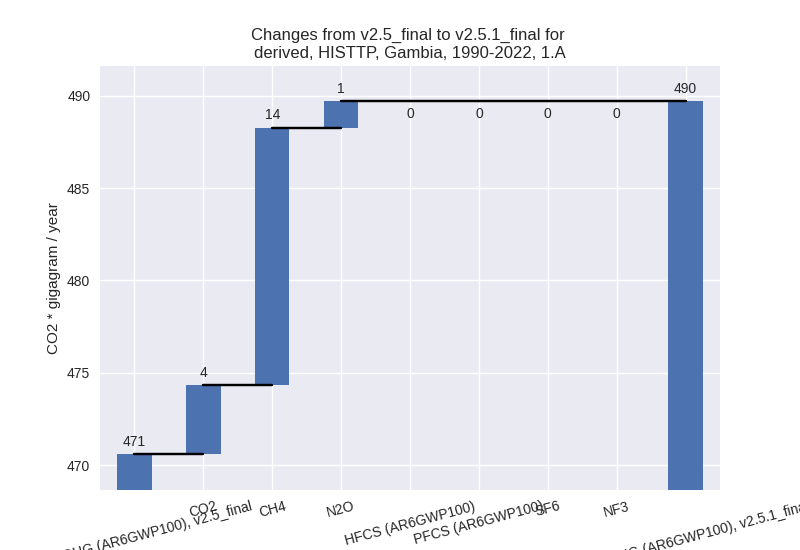
- 4: Total sectoral emissions in 2022 are 470.06 Gg CO2 / year which is 16.4% of M.0.EL emissions. 2022 Emissions have changed by 0.0% (0.22 Gg CO2 / year). 1990-2022 Emissions have changed by 0.0% (0.01 Gg CO2 / year).
- 5: Total sectoral emissions in 2022 are 16.54 Gg CO2 / year which is 0.6% of M.0.EL emissions. 2022 Emissions have changed by 0.0% (0.00 Gg CO2 / year). 1990-2022 Emissions have changed by -0.0% (-0.00 Gg CO2 / year).
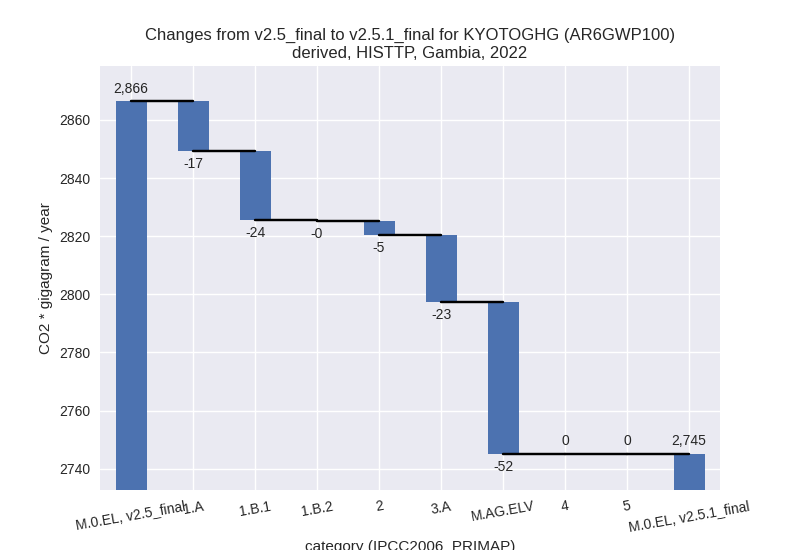
third party scenario (HISTTP):
Most important changes per time frame
For 2022 the following sector-gas combinations have the highest absolute impact on national total KyotoGHG (AR6GWP100) emissions in 2022 (top 5):
- 1: M.AG.ELV, CH4 with -43.20 Gg CO2 / year (-7.9%)
- 2: 1.A, CO2 with -32.66 Gg CO2 / year (-4.4%)
- 3: 3.A, CH4 with -23.42 Gg CO2 / year (-4.3%)
- 4: 1.B.1, CH4 with -23.35 Gg CO2 / year (-23.2%)
- 5: 1.A, CH4 with 13.90 Gg CO2 / year (13.8%)
For 1990-2022 the following sector-gas combinations have the highest absolute impact on national total KyotoGHG (AR6GWP100) emissions in 1990-2022 (top 5):
- 1: 1.A, CH4 with 13.95 Gg CO2 / year (19.7%)
- 2: 1.B.1, CH4 with -7.52 Gg CO2 / year (-11.7%)
- 3: M.AG.ELV, N2O with -5.70 Gg CO2 / year (-2.0%)
- 4: 2, CO2 with -4.68 Gg CO2 / year (-53.7%)
- 5: 3.A, CH4 with -4.32 Gg CO2 / year (-0.9%)
Changes in the main sectors for aggregate KyotoGHG (AR6GWP100) are
- 1: Total sectoral emissions in 2022 are 924.78 Gg
CO2 / year which is 33.7% of M.0.EL emissions. 2022 Emissions have
changed by -4.3% (-41.34 Gg CO2 /
year). 1990-2022 Emissions have changed by 2.1% (11.39 Gg CO2 / year). For 2022 the
changes per gas
are:

For 1990-2022 the changes per gas are:
The changes come from the following subsectors:- 1.A: Total sectoral emissions in 2022 are 846.40 Gg
CO2 / year which is 91.5% of category 1 emissions. 2022 Emissions have
changed by -2.0% (-17.26 Gg CO2 /
year). 1990-2022 Emissions have changed by 4.1% (19.10 Gg CO2 / year). For 1990-2022
the changes per gas
are:
There is no subsector information available in PRIMAP-hist. - 1.B.1: Total sectoral emissions in 2022 are 78.38
Gg CO2 / year which is 8.5% of category 1 emissions. 2022 Emissions have
changed by -23.2% (-23.66 Gg CO2 /
year). 1990-2022 Emissions have changed by -11.7% (-7.62 Gg CO2 / year). For 2022 the
changes per gas
are:

For 1990-2022 the changes per gas are:
There is no subsector information available in PRIMAP-hist. - 1.B.2: Total sectoral emissions in 2022 are 0.00 Gg
CO2 / year which is 0.0% of category 1 emissions. 2022 Emissions have
changed by -99.6% (-0.42 Gg CO2 /
year). 1990-2022 Emissions have changed by -98.3% (-0.09 Gg CO2 / year). For 2022 the
changes per gas
are:

For 1990-2022 the changes per gas are: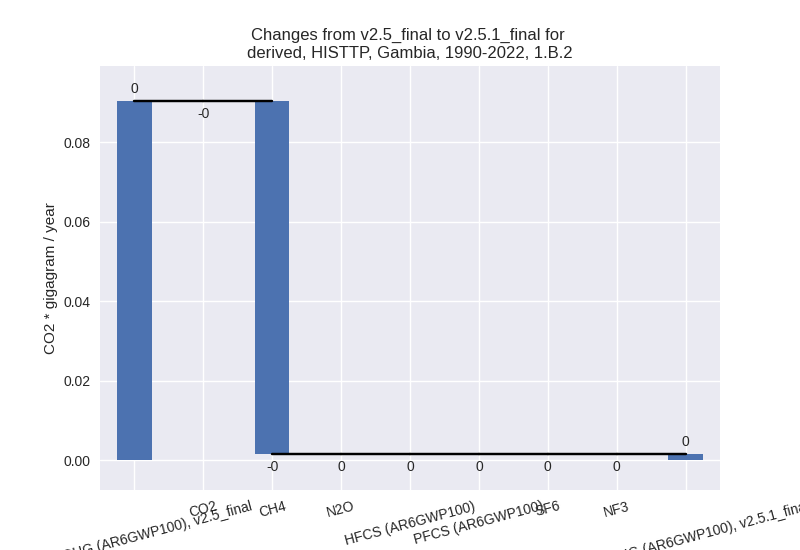
There is no subsector information available in PRIMAP-hist.
- 1.A: Total sectoral emissions in 2022 are 846.40 Gg
CO2 / year which is 91.5% of category 1 emissions. 2022 Emissions have
changed by -2.0% (-17.26 Gg CO2 /
year). 1990-2022 Emissions have changed by 4.1% (19.10 Gg CO2 / year). For 1990-2022
the changes per gas
are:
- 2: Total sectoral emissions in 2022 are 6.24 Gg CO2
/ year which is 0.2% of M.0.EL emissions. 2022 Emissions have changed by
-42.8% (-4.67 Gg CO2 / year).
1990-2022 Emissions have changed by -53.7% (-4.68 Gg CO2 / year). For 2022 the
changes per gas
are:

For 1990-2022 the changes per gas are: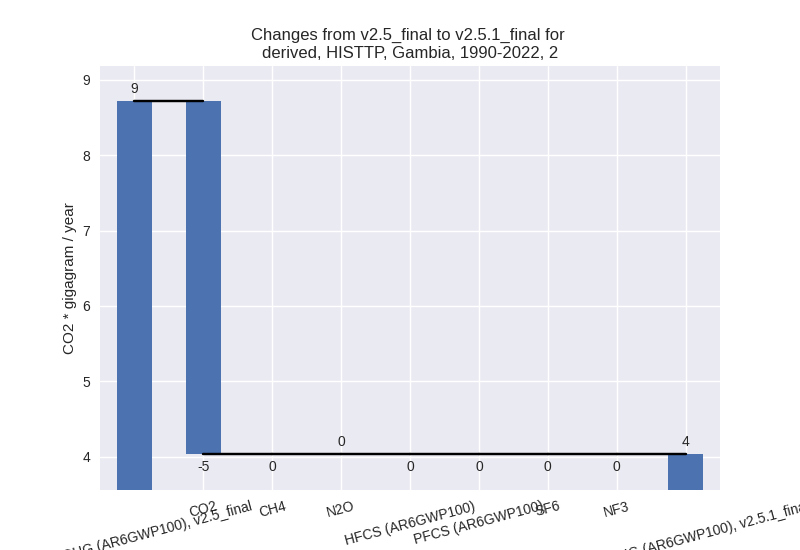
- M.AG: Total sectoral emissions in 2022 are 1327.59
Gg CO2 / year which is 48.4% of M.0.EL emissions. 2022 Emissions have
changed by -5.4% (-75.43 Gg CO2 /
year). 1990-2022 Emissions have changed by -1.3% (-13.49 Gg CO2 / year). For 2022 the
changes per gas
are:

The changes come from the following subsectors:- 3.A: Total sectoral emissions in 2022 are 523.31 Gg
CO2 / year which is 39.4% of category M.AG emissions. 2022 Emissions
have changed by -4.2% (-22.95 Gg CO2
/ year). 1990-2022 Emissions have changed by -0.9% (-4.33 Gg CO2 / year). For 2022 the
changes per gas
are:

There is no subsector information available in PRIMAP-hist. - M.AG.ELV: Total sectoral emissions in 2022 are
804.28 Gg CO2 / year which is 60.6% of category M.AG emissions. 2022
Emissions have changed by -6.1%
(-52.48 Gg CO2 / year). 1990-2022 Emissions have changed by -1.5% (-9.16 Gg CO2 / year). For 2022 the
changes per gas
are:

There is no subsector information available in PRIMAP-hist.
- 3.A: Total sectoral emissions in 2022 are 523.31 Gg
CO2 / year which is 39.4% of category M.AG emissions. 2022 Emissions
have changed by -4.2% (-22.95 Gg CO2
/ year). 1990-2022 Emissions have changed by -0.9% (-4.33 Gg CO2 / year). For 2022 the
changes per gas
are:
- 4: Total sectoral emissions in 2022 are 470.06 Gg CO2 / year which is 17.1% of M.0.EL emissions. 2022 Emissions have changed by 0.0% (0.22 Gg CO2 / year). 1990-2022 Emissions have changed by 0.0% (0.01 Gg CO2 / year).
- 5: Total sectoral emissions in 2022 are 16.54 Gg CO2 / year which is 0.6% of M.0.EL emissions. 2022 Emissions have changed by 0.0% (0.00 Gg CO2 / year). 1990-2022 Emissions have changed by -0.0% (-0.00 Gg CO2 / year).