Changes in PRIMAP-hist v2.5.1_final compared to v2.5_final for Equatorial Guinea
2024-02-29
Johannes Gütschow
Change analysis for Equatorial Guinea for PRIMAP-hist v2.5.1_final compared to v2.5_final
Overview over emissions by sector and gas
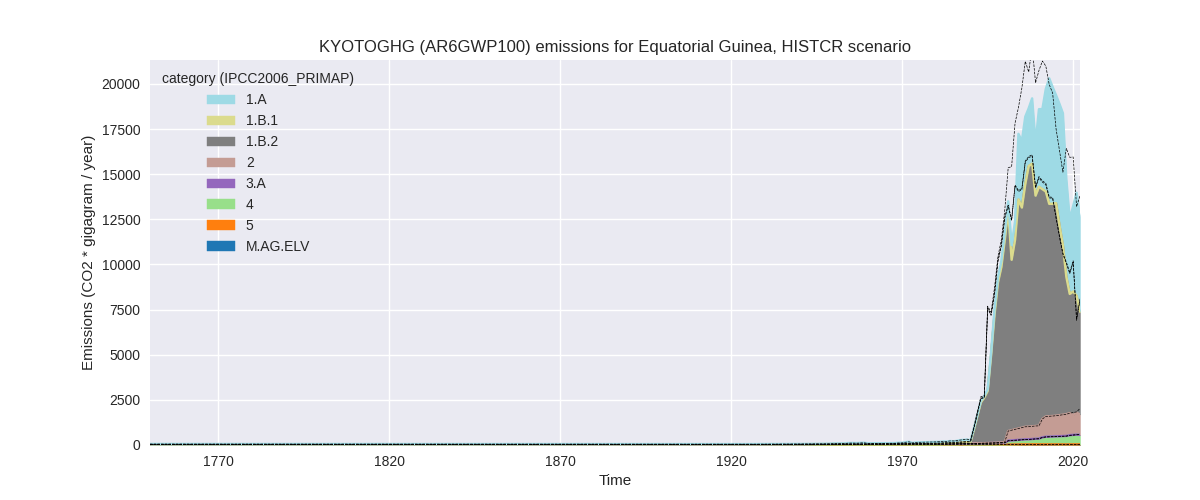
The following figures show the aggregate national total emissions excluding LULUCF AR6GWP100 for the country reported priority scenario. The dotted linesshow the v2.5_final data.

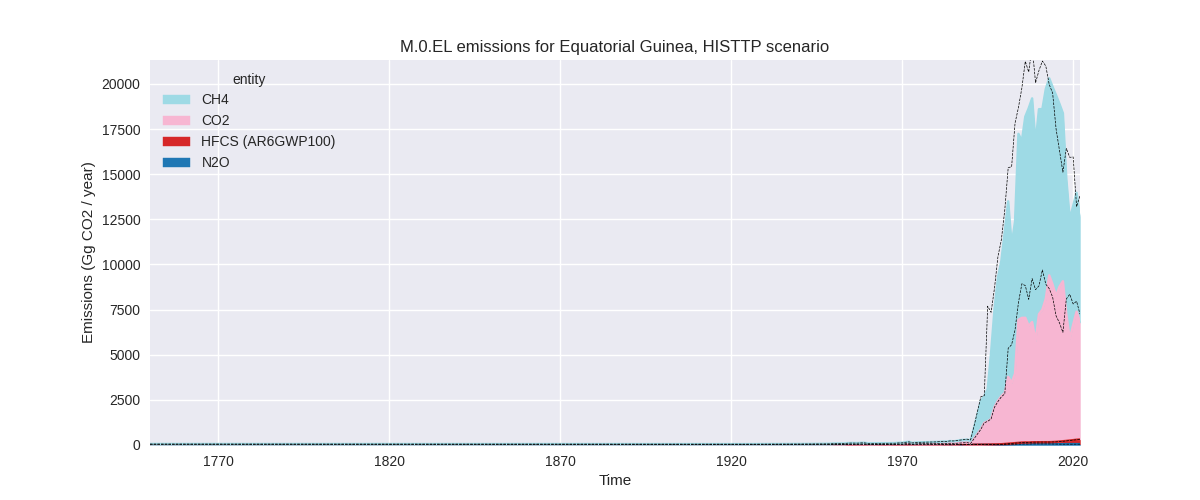
The following figures show the aggregate national total emissions excluding LULUCF AR6GWP100 for the third party priority scenario. The dotted linesshow the v2.5_final data.

Overview over changes
In the country reported priority scenario we have the following changes for aggregate Kyoto GHG and national total emissions excluding LULUCF (M.0.EL):
- Emissions in 2022 have changed by -8.6%% (-1190.10 Gg CO2 / year)
- Emissions in 1990-2022 have changed by -9.8%% (-1376.71 Gg CO2 / year)
In the third party priority scenario we have the following changes for aggregate Kyoto GHG and national total emissions excluding LULUCF (M.0.EL):
- Emissions in 2022 have changed by -8.6%% (-1190.10 Gg CO2 / year)
- Emissions in 1990-2022 have changed by -9.8%% (-1376.71 Gg CO2 / year)
Most important changes per scenario and time frame
In the country reported priority scenario the following sector-gas combinations have the highest absolute impact on national total KyotoGHG (AR6GWP100) emissions in 2022 (top 5):
- 1: 1.B.2, CH4 with -623.42 Gg CO2 / year (-10.7%)
- 2: 1.A, CO2 with -466.39 Gg CO2 / year (-8.2%)
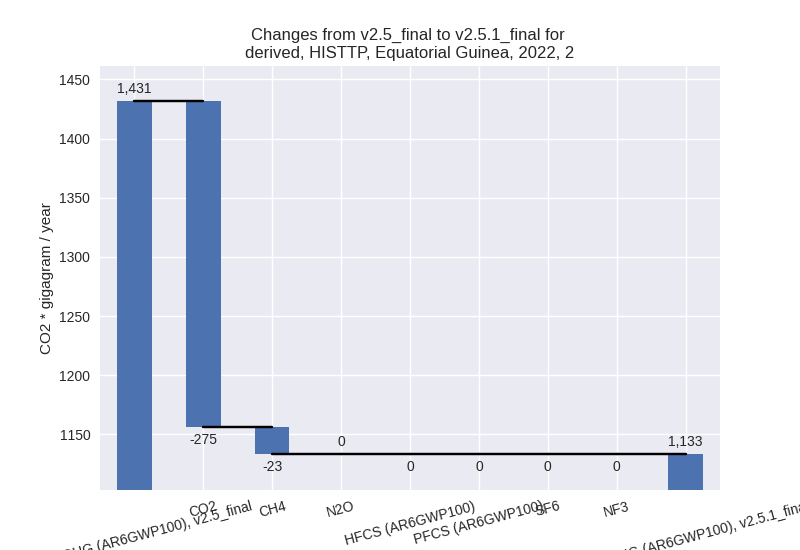
- 3: 2, CO2 with -275.04 Gg CO2 / year (-25.4%)
- 4: 1.B.2, CO2 with 267.45 Gg CO2 / year (149.5%)
- 5: 4, CH4 with -37.80 Gg CO2 / year (-6.9%)
In the country reported priority scenario the following sector-gas combinations have the highest absolute impact on national total KyotoGHG (AR6GWP100) emissions in 1990-2022 (top 5):
- 1: 1.B.2, CH4 with -731.68 Gg CO2 / year (-9.2%)
- 2: 1.A, CO2 with -591.44 Gg CO2 / year (-16.7%)
- 3: 1.B.1, CH4 with -29.98 Gg CO2 / year (-57.1%)
- 4: 2, CO2 with -15.32 Gg CO2 / year (-3.0%)
- 5: 1.A, CH4 with -5.20 Gg CO2 / year (-37.8%)
In the third party priority scenario the following sector-gas combinations have the highest absolute impact on national total KyotoGHG (AR6GWP100) emissions in 2022 (top 5):
- 1: 1.B.2, CH4 with -623.42 Gg CO2 / year (-10.7%)
- 2: 1.A, CO2 with -466.39 Gg CO2 / year (-8.2%)
- 3: 2, CO2 with -275.04 Gg CO2 / year (-25.4%)
- 4: 1.B.2, CO2 with 267.45 Gg CO2 / year (149.5%)
- 5: 4, CH4 with -37.80 Gg CO2 / year (-6.9%)
In the third party priority scenario the following sector-gas combinations have the highest absolute impact on national total KyotoGHG (AR6GWP100) emissions in 1990-2022 (top 5):
- 1: 1.B.2, CH4 with -731.68 Gg CO2 / year (-9.2%)
- 2: 1.A, CO2 with -591.44 Gg CO2 / year (-16.7%)
- 3: 1.B.1, CH4 with -29.98 Gg CO2 / year (-57.1%)
- 4: 2, CO2 with -15.32 Gg CO2 / year (-3.0%)
- 5: 1.A, CH4 with -5.20 Gg CO2 / year (-37.8%)
Notes on data changes
Here we list notes explaining important emissions changes for the country. ’' means that the following text only applies to the TP time series, while means that it only applies to the CR scenario. Otherwise the note applies to both scenarios.
- 1.A, CH4: We have no country reported data for Equatorial Guinea, thus the CR and TP time-series are identical except for LULUCF.
- 1.B.2, CH4: EDGAR 8.0 emissions differ from EDGAR 7.0 emissions leading to changes in PRIMAP-hist.
- 1.A, CO2: CDIAC 2023 emissions differ from CDIAC 2020 and EI 2023 leading to changes in PRIMAP-hist.
Changes by sector and gas
For each scenario and time frame the changes are displayed for all individual sectors and all individual gases. In the sector plot we use aggregate Kyoto GHGs in AR6GWP100. In the gas plot we usenational total emissions without LULUCF. ## country reported scenario
2022

1990-2022

third party scenario
2022


1990-2022

Detailed changes for the scenarios:
country reported scenario (HISTCR):
Most important changes per time frame
For 2022 the following sector-gas combinations have the highest absolute impact on national total KyotoGHG (AR6GWP100) emissions in 2022 (top 5):
- 1: 1.B.2, CH4 with -623.42 Gg CO2 / year (-10.7%)
- 2: 1.A, CO2 with -466.39 Gg CO2 / year (-8.2%)
- 3: 2, CO2 with -275.04 Gg CO2 / year (-25.4%)
- 4: 1.B.2, CO2 with 267.45 Gg CO2 / year (149.5%)
- 5: 4, CH4 with -37.80 Gg CO2 / year (-6.9%)
For 1990-2022 the following sector-gas combinations have the highest absolute impact on national total KyotoGHG (AR6GWP100) emissions in 1990-2022 (top 5):
- 1: 1.B.2, CH4 with -731.68 Gg CO2 / year (-9.2%)
- 2: 1.A, CO2 with -591.44 Gg CO2 / year (-16.7%)
- 3: 1.B.1, CH4 with -29.98 Gg CO2 / year (-57.1%)
- 4: 2, CO2 with -15.32 Gg CO2 / year (-3.0%)
- 5: 1.A, CH4 with -5.20 Gg CO2 / year (-37.8%)
Changes in the main sectors for aggregate KyotoGHG (AR6GWP100) are
- 1: Total sectoral emissions in 2022 are 10923.84 Gg
CO2 / year which is 86.6% of M.0.EL emissions. 2022 Emissions have
changed by -7.3% (-860.35 Gg CO2 /
year). 1990-2022 Emissions have changed by -10.4% (-1362.08 Gg CO2 / year). For 2022
the changes per gas
are:

For 1990-2022 the changes per gas are:
The changes come from the following subsectors:- 1.A: Total sectoral emissions in 2022 are 5236.04
Gg CO2 / year which is 47.9% of category 1 emissions. 2022 Emissions
have changed by -8.3% (-475.47 Gg
CO2 / year). 1990-2022 Emissions have changed by -16.8% (-599.88 Gg CO2 / year). For 2022
the changes per gas
are:
For 1990-2022 the changes per gas are:
There is no subsector information available in PRIMAP-hist. - 1.B.1: Total sectoral emissions in 2022 are 31.34
Gg CO2 / year which is 0.3% of category 1 emissions. 2022 Emissions have
changed by -48.8% (-29.90 Gg CO2 /
year). 1990-2022 Emissions have changed by -57.1% (-30.37 Gg CO2 / year). For 2022
the changes per gas
are:
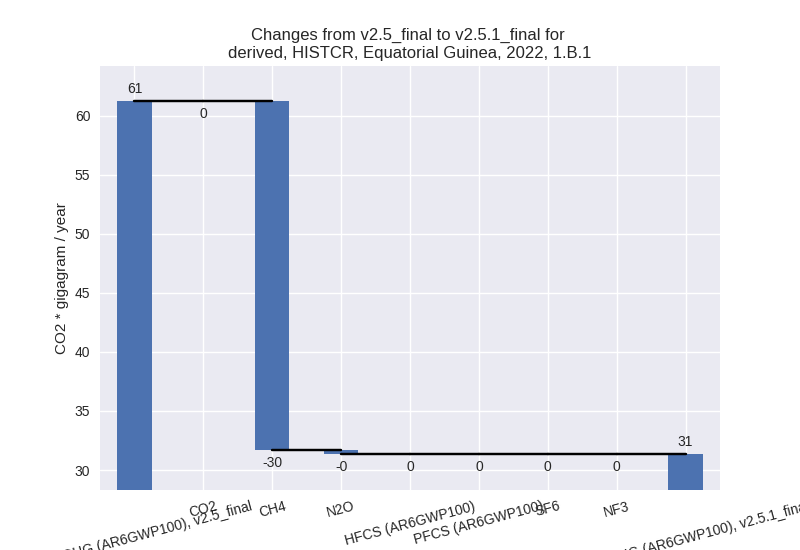
For 1990-2022 the changes per gas are:
There is no subsector information available in PRIMAP-hist. - 1.B.2: Total sectoral emissions in 2022 are 5656.46
Gg CO2 / year which is 51.8% of category 1 emissions. 2022 Emissions
have changed by -5.9% (-354.98 Gg
CO2 / year). 1990-2022 Emissions have changed by -7.7% (-731.82 Gg CO2 / year). For 2022
the changes per gas
are:
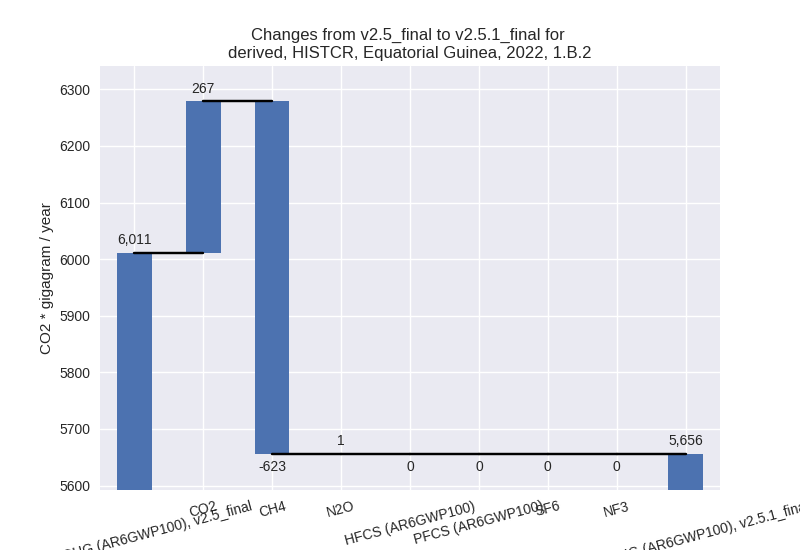
For 1990-2022 the changes per gas are: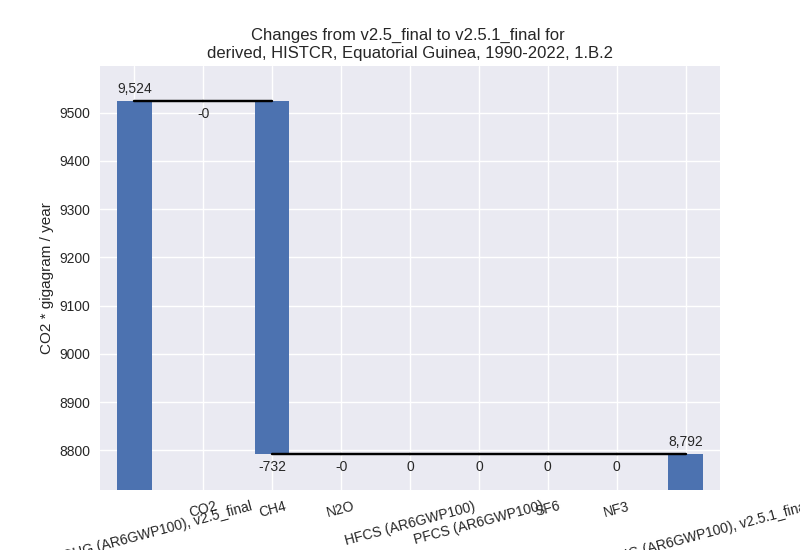
There is no subsector information available in PRIMAP-hist.
- 1.A: Total sectoral emissions in 2022 are 5236.04
Gg CO2 / year which is 47.9% of category 1 emissions. 2022 Emissions
have changed by -8.3% (-475.47 Gg
CO2 / year). 1990-2022 Emissions have changed by -16.8% (-599.88 Gg CO2 / year). For 2022
the changes per gas
are:
- 2: Total sectoral emissions in 2022 are 1133.26 Gg
CO2 / year which is 9.0% of M.0.EL emissions. 2022 Emissions have
changed by -20.8% (-298.21 Gg CO2 /
year). 1990-2022 Emissions have changed by -2.6% (-16.49 Gg CO2 / year). For 2022 the
changes per gas
are:

For 1990-2022 the changes per gas are:
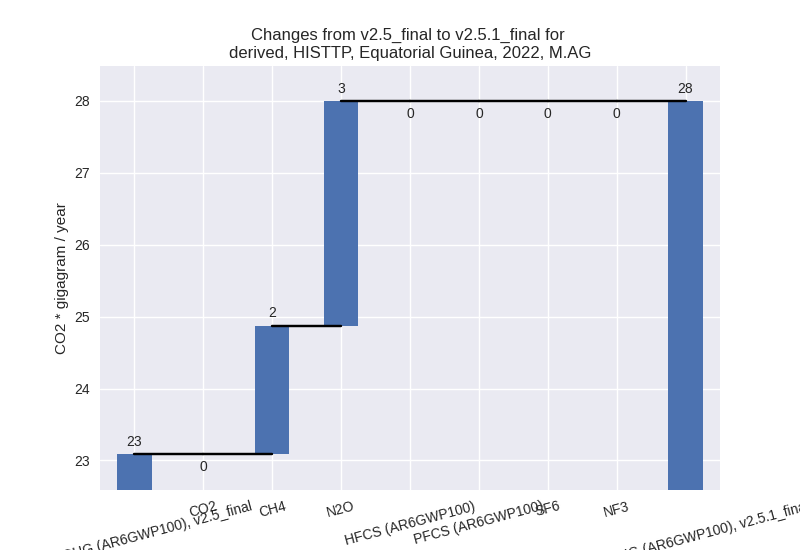
- M.AG: Total sectoral emissions in 2022 are 27.99 Gg
CO2 / year which is 0.2% of M.0.EL emissions. 2022 Emissions have
changed by 21.2% (4.91 Gg CO2 /
year). 1990-2022 Emissions have changed by 14.2% (2.97 Gg CO2 / year). For 2022 the
changes per gas
are:

For 1990-2022 the changes per gas are:
The changes come from the following subsectors:- 3.A: Total sectoral emissions in 2022 are 14.26 Gg CO2 / year which is 50.9% of category M.AG emissions. 2022 Emissions have changed by -0.2% (-0.03 Gg CO2 / year). 1990-2022 Emissions have changed by -0.0% (-0.00 Gg CO2 / year).
- M.AG.ELV: Total sectoral emissions in 2022 are
13.73 Gg CO2 / year which is 49.1% of category M.AG emissions. 2022
Emissions have changed by 56.1%
(4.94 Gg CO2 / year). 1990-2022 Emissions have changed by 37.9% (2.97 Gg CO2 / year). For 2022 the
changes per gas
are:

For 1990-2022 the changes per gas are:
There is no subsector information available in PRIMAP-hist.
- 4: Total sectoral emissions in 2022 are 515.00 Gg
CO2 / year which is 4.1% of M.0.EL emissions. 2022 Emissions have
changed by -6.9% (-37.89 Gg CO2 /
year). 1990-2022 Emissions have changed by -0.4% (-1.15 Gg CO2 / year). For 2022 the
changes per gas
are:

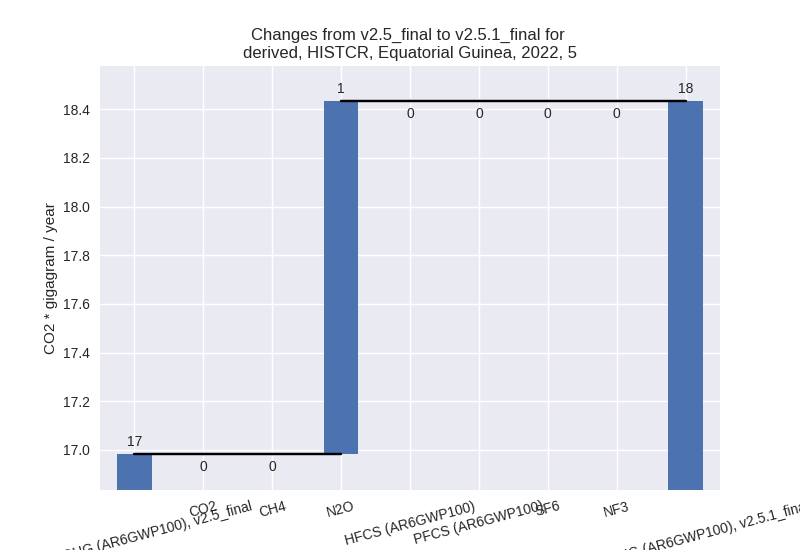
- 5: Total sectoral emissions in 2022 are 18.43 Gg
CO2 / year which is 0.1% of M.0.EL emissions. 2022 Emissions have
changed by 8.5% (1.45 Gg CO2 /
year). 1990-2022 Emissions have changed by 0.3% (0.04 Gg CO2 / year). For 2022 the
changes per gas
are:
third party scenario (HISTTP):
Most important changes per time frame
For 2022 the following sector-gas combinations have the highest absolute impact on national total KyotoGHG (AR6GWP100) emissions in 2022 (top 5):
- 1: 1.B.2, CH4 with -623.42 Gg CO2 / year (-10.7%)
- 2: 1.A, CO2 with -466.39 Gg CO2 / year (-8.2%)
- 3: 2, CO2 with -275.04 Gg CO2 / year (-25.4%)
- 4: 1.B.2, CO2 with 267.45 Gg CO2 / year (149.5%)
- 5: 4, CH4 with -37.80 Gg CO2 / year (-6.9%)
For 1990-2022 the following sector-gas combinations have the highest absolute impact on national total KyotoGHG (AR6GWP100) emissions in 1990-2022 (top 5):
- 1: 1.B.2, CH4 with -731.68 Gg CO2 / year (-9.2%)
- 2: 1.A, CO2 with -591.44 Gg CO2 / year (-16.7%)
- 3: 1.B.1, CH4 with -29.98 Gg CO2 / year (-57.1%)
- 4: 2, CO2 with -15.32 Gg CO2 / year (-3.0%)
- 5: 1.A, CH4 with -5.20 Gg CO2 / year (-37.8%)
Changes in the main sectors for aggregate KyotoGHG (AR6GWP100) are
- 1: Total sectoral emissions in 2022 are 10923.84 Gg
CO2 / year which is 86.6% of M.0.EL emissions. 2022 Emissions have
changed by -7.3% (-860.35 Gg CO2 /
year). 1990-2022 Emissions have changed by -10.4% (-1362.08 Gg CO2 / year). For 2022
the changes per gas
are:

For 1990-2022 the changes per gas are:
The changes come from the following subsectors:- 1.A: Total sectoral emissions in 2022 are 5236.04
Gg CO2 / year which is 47.9% of category 1 emissions. 2022 Emissions
have changed by -8.3% (-475.47 Gg
CO2 / year). 1990-2022 Emissions have changed by -16.8% (-599.88 Gg CO2 / year). For 2022
the changes per gas
are:

For 1990-2022 the changes per gas are: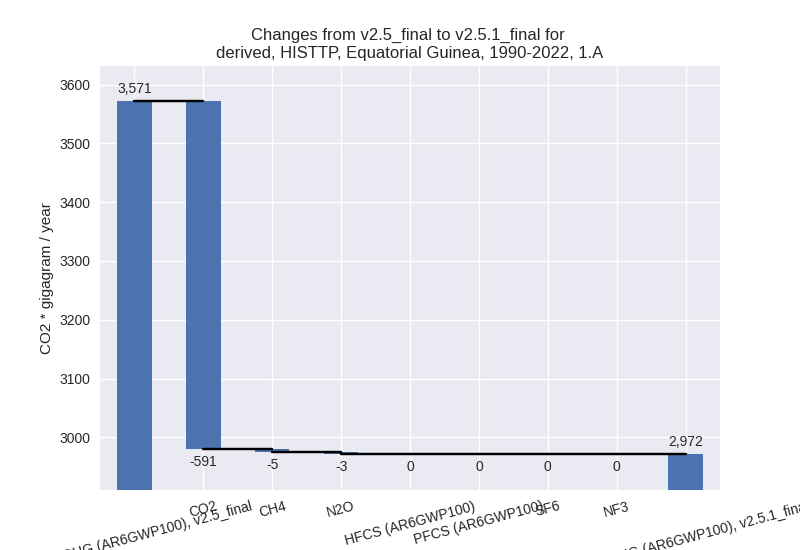
There is no subsector information available in PRIMAP-hist. - 1.B.1: Total sectoral emissions in 2022 are 31.34
Gg CO2 / year which is 0.3% of category 1 emissions. 2022 Emissions have
changed by -48.8% (-29.90 Gg CO2 /
year). 1990-2022 Emissions have changed by -57.1% (-30.37 Gg CO2 / year). For 2022
the changes per gas
are:

For 1990-2022 the changes per gas are:
There is no subsector information available in PRIMAP-hist. - 1.B.2: Total sectoral emissions in 2022 are 5656.46
Gg CO2 / year which is 51.8% of category 1 emissions. 2022 Emissions
have changed by -5.9% (-354.98 Gg
CO2 / year). 1990-2022 Emissions have changed by -7.7% (-731.82 Gg CO2 / year). For 2022
the changes per gas
are:

For 1990-2022 the changes per gas are:
There is no subsector information available in PRIMAP-hist.
- 1.A: Total sectoral emissions in 2022 are 5236.04
Gg CO2 / year which is 47.9% of category 1 emissions. 2022 Emissions
have changed by -8.3% (-475.47 Gg
CO2 / year). 1990-2022 Emissions have changed by -16.8% (-599.88 Gg CO2 / year). For 2022
the changes per gas
are:
- 2: Total sectoral emissions in 2022 are 1133.26 Gg
CO2 / year which is 9.0% of M.0.EL emissions. 2022 Emissions have
changed by -20.8% (-298.21 Gg CO2 /
year). 1990-2022 Emissions have changed by -2.6% (-16.49 Gg CO2 / year). For 2022 the
changes per gas
are:
For 1990-2022 the changes per gas are: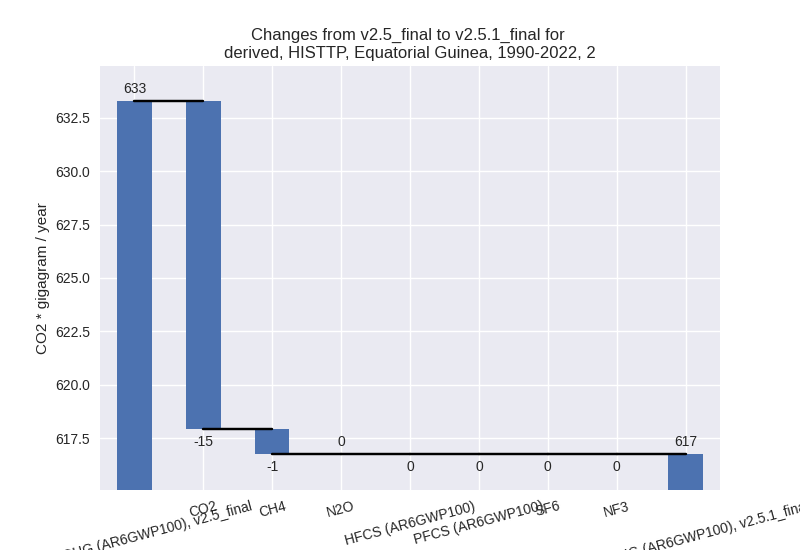
- M.AG: Total sectoral emissions in 2022 are 27.99 Gg
CO2 / year which is 0.2% of M.0.EL emissions. 2022 Emissions have
changed by 21.2% (4.91 Gg CO2 /
year). 1990-2022 Emissions have changed by 14.2% (2.97 Gg CO2 / year). For 2022 the
changes per gas
are:
For 1990-2022 the changes per gas are:
The changes come from the following subsectors:- 3.A: Total sectoral emissions in 2022 are 14.26 Gg CO2 / year which is 50.9% of category M.AG emissions. 2022 Emissions have changed by -0.2% (-0.03 Gg CO2 / year). 1990-2022 Emissions have changed by -0.0% (-0.00 Gg CO2 / year).
- M.AG.ELV: Total sectoral emissions in 2022 are
13.73 Gg CO2 / year which is 49.1% of category M.AG emissions. 2022
Emissions have changed by 56.1%
(4.94 Gg CO2 / year). 1990-2022 Emissions have changed by 37.9% (2.97 Gg CO2 / year). For 2022 the
changes per gas
are:

For 1990-2022 the changes per gas are: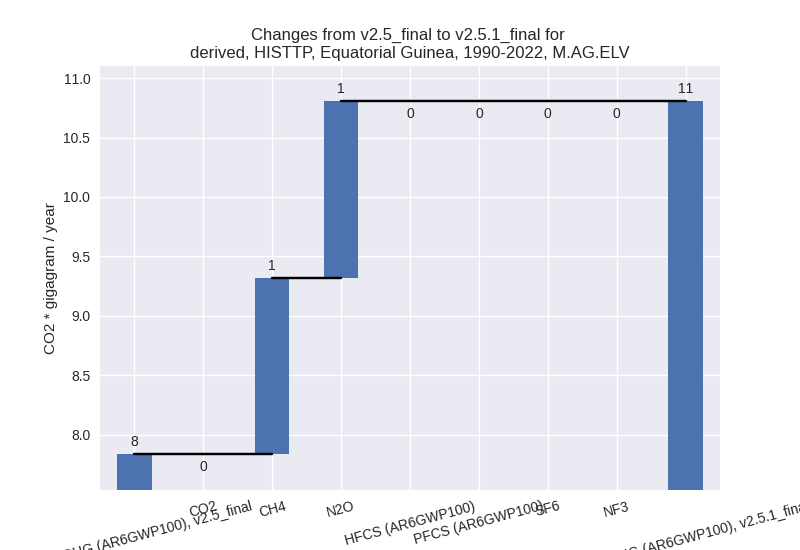
There is no subsector information available in PRIMAP-hist.
- 4: Total sectoral emissions in 2022 are 515.00 Gg
CO2 / year which is 4.1% of M.0.EL emissions. 2022 Emissions have
changed by -6.9% (-37.89 Gg CO2 /
year). 1990-2022 Emissions have changed by -0.4% (-1.15 Gg CO2 / year). For 2022 the
changes per gas
are:

- 5: Total sectoral emissions in 2022 are 18.43 Gg
CO2 / year which is 0.1% of M.0.EL emissions. 2022 Emissions have
changed by 8.5% (1.45 Gg CO2 /
year). 1990-2022 Emissions have changed by 0.3% (0.04 Gg CO2 / year). For 2022 the
changes per gas
are:
