Changes in PRIMAP-hist v2.5.1_final compared to v2.5_final for Hong Kong
2024-02-29
Johannes Gütschow
Change analysis for Hong Kong for PRIMAP-hist v2.5.1_final compared to v2.5_final
Overview over emissions by sector and gas
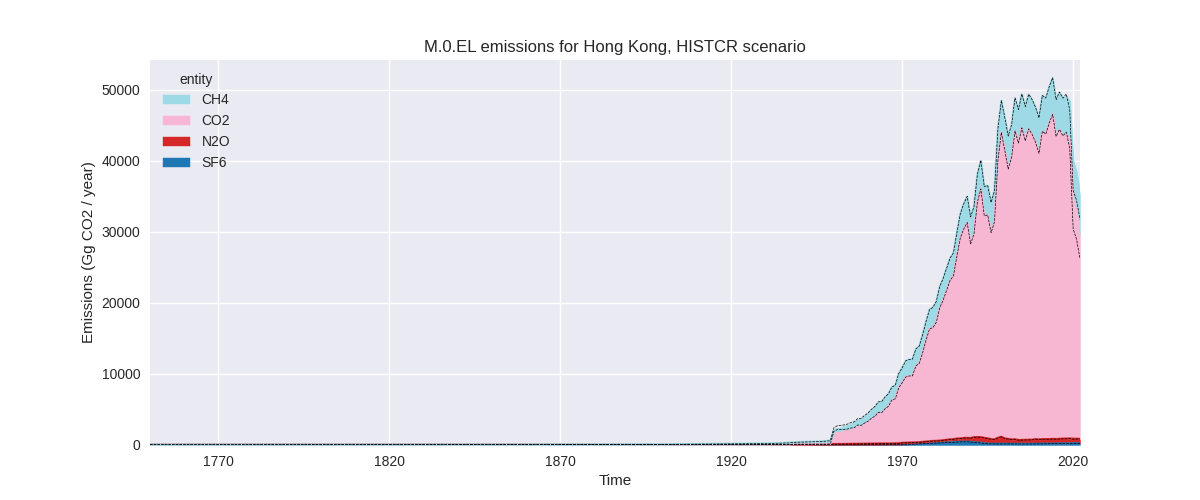
The following figures show the aggregate national total emissions excluding LULUCF AR6GWP100 for the country reported priority scenario. The dotted linesshow the v2.5_final data.

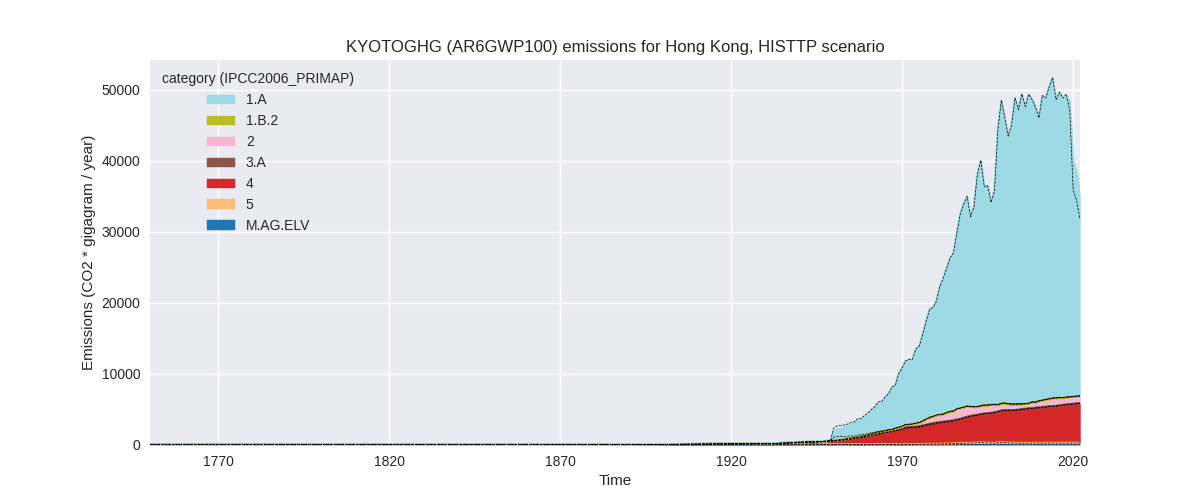
The following figures show the aggregate national total emissions excluding LULUCF AR6GWP100 for the third party priority scenario. The dotted linesshow the v2.5_final data.


Overview over changes
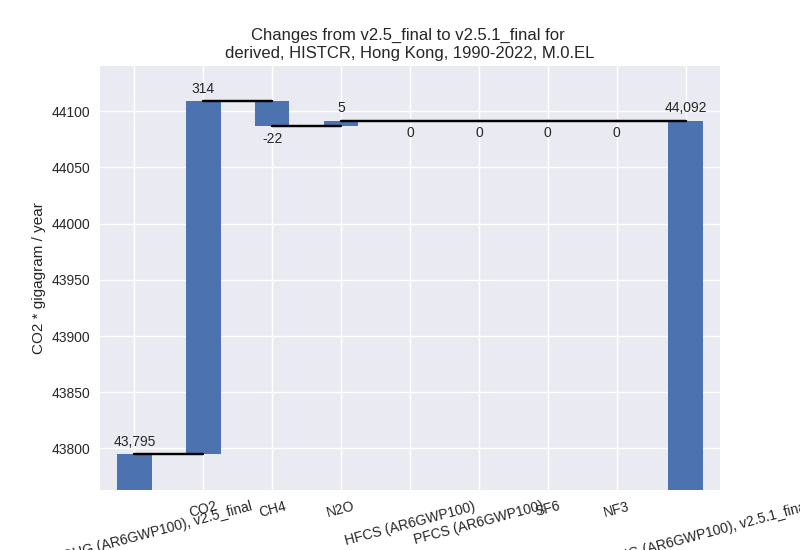
In the country reported priority scenario we have the following changes for aggregate Kyoto GHG and national total emissions excluding LULUCF (M.0.EL):
- Emissions in 2022 have changed by 10.8%% (3417.97 Gg CO2 / year)
- Emissions in 1990-2022 have changed by 0.7%% (296.70 Gg CO2 / year)
In the third party priority scenario we have the following changes for aggregate Kyoto GHG and national total emissions excluding LULUCF (M.0.EL):
- Emissions in 2022 have changed by 10.8%% (3417.97 Gg CO2 / year)
- Emissions in 1990-2022 have changed by 0.7%% (296.70 Gg CO2 / year)
Most important changes per scenario and time frame
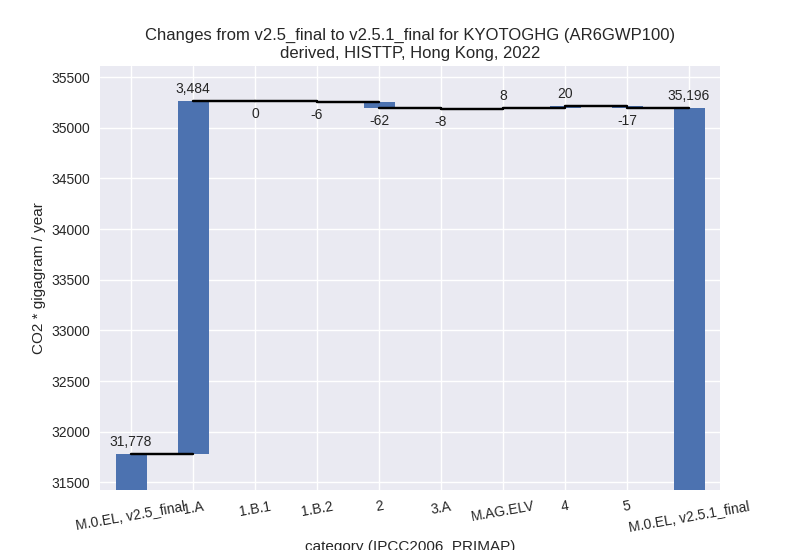
In the country reported priority scenario the following sector-gas combinations have the highest absolute impact on national total KyotoGHG (AR6GWP100) emissions in 2022 (top 5):
- 1: 1.A, CO2 with 3520.04 Gg CO2 / year (14.3%)
- 2: 2, CO2 with -61.55 Gg CO2 / year (-8.0%)
- 3: 1.A, N2O with -35.27 Gg CO2 / year (-17.3%)
- 4: 4, CH4 with 20.90 Gg CO2 / year (0.4%)
- 5: 5, N2O with -17.47 Gg CO2 / year (-6.3%)
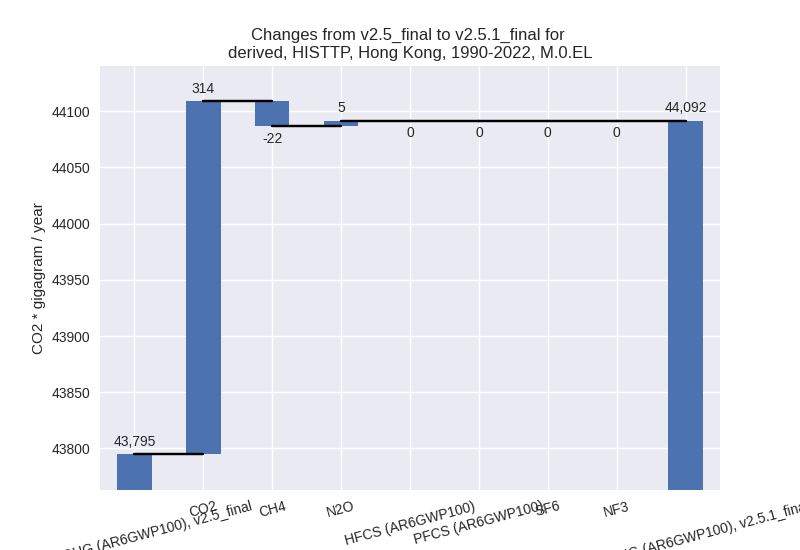
In the country reported priority scenario the following sector-gas combinations have the highest absolute impact on national total KyotoGHG (AR6GWP100) emissions in 1990-2022 (top 5):
- 1: 1.A, CO2 with 378.17 Gg CO2 / year (1.0%)
- 2: 2, CO2 with -64.30 Gg CO2 / year (-8.1%)
- 3: 1.B.2, CH4 with -22.23 Gg CO2 / year (-31.7%)
- 4: M.AG.ELV, N2O with 4.79 Gg CO2 / year (39.0%)
- 5: 3.A, CH4 with -1.97 Gg CO2 / year (-5.8%)
In the third party priority scenario the following sector-gas combinations have the highest absolute impact on national total KyotoGHG (AR6GWP100) emissions in 2022 (top 5):
- 1: 1.A, CO2 with 3520.04 Gg CO2 / year (14.3%)
- 2: 2, CO2 with -61.55 Gg CO2 / year (-8.0%)
- 3: 1.A, N2O with -35.27 Gg CO2 / year (-17.3%)
- 4: 4, CH4 with 20.90 Gg CO2 / year (0.4%)
- 5: 5, N2O with -17.47 Gg CO2 / year (-6.3%)
In the third party priority scenario the following sector-gas combinations have the highest absolute impact on national total KyotoGHG (AR6GWP100) emissions in 1990-2022 (top 5):
- 1: 1.A, CO2 with 378.17 Gg CO2 / year (1.0%)
- 2: 2, CO2 with -64.30 Gg CO2 / year (-8.1%)
- 3: 1.B.2, CH4 with -22.23 Gg CO2 / year (-31.7%)
- 4: M.AG.ELV, N2O with 4.79 Gg CO2 / year (39.0%)
- 5: 3.A, CH4 with -1.97 Gg CO2 / year (-5.8%)
Notes on data changes
Here we list notes explaining important emissions changes for the country. ’' means that the following text only applies to the TP time series, while means that it only applies to the CR scenario. Otherwise the note applies to both scenarios.
General note: We have no country reported data for Hong Kong, thus CR and TP time-series are identical.
- 1.A, CO2: Emissions in recent years are higher due to the inclusion of CDIAC 2023 data.
- 2.D, CO2: Emissions in 2.D (non-energy products from fuels and solvent use) are much lower in EDGAR 8.0 than in EDGAR 7.0 and thus emissions in PRIMAP-hist v2.5.1 are lower than in v2.5.
Changes by sector and gas
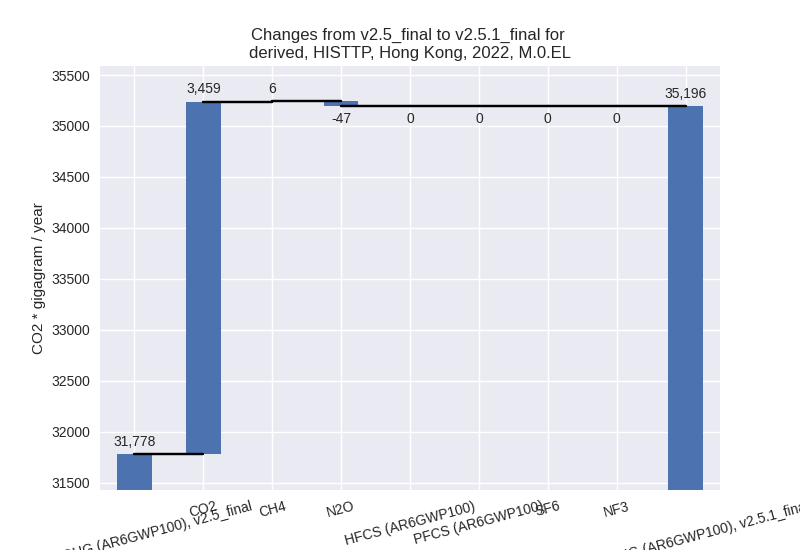
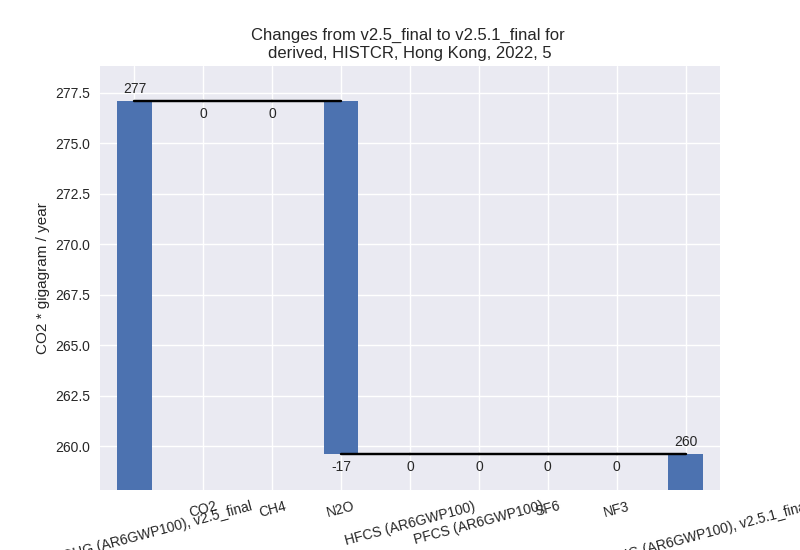
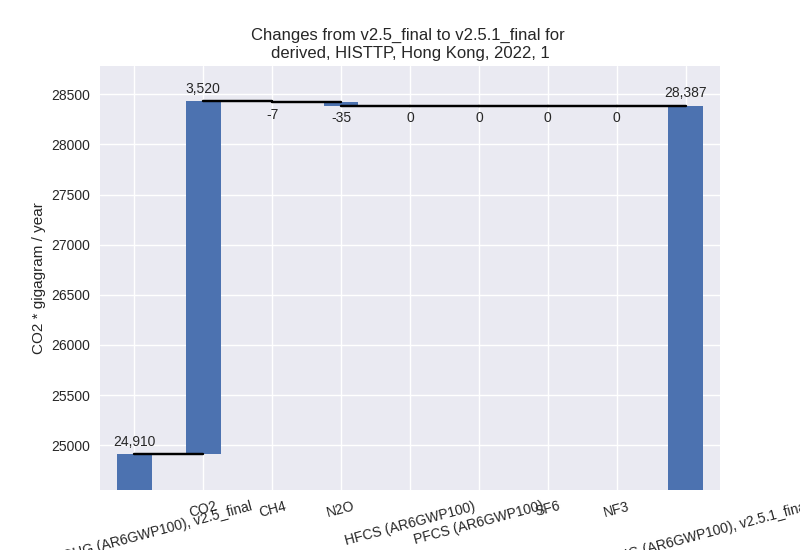
For each scenario and time frame the changes are displayed for all individual sectors and all individual gases. In the sector plot we use aggregate Kyoto GHGs in AR6GWP100. In the gas plot we usenational total emissions without LULUCF. ## country reported scenario
2022


1990-2022

third party scenario
2022
1990-2022

Detailed changes for the scenarios:
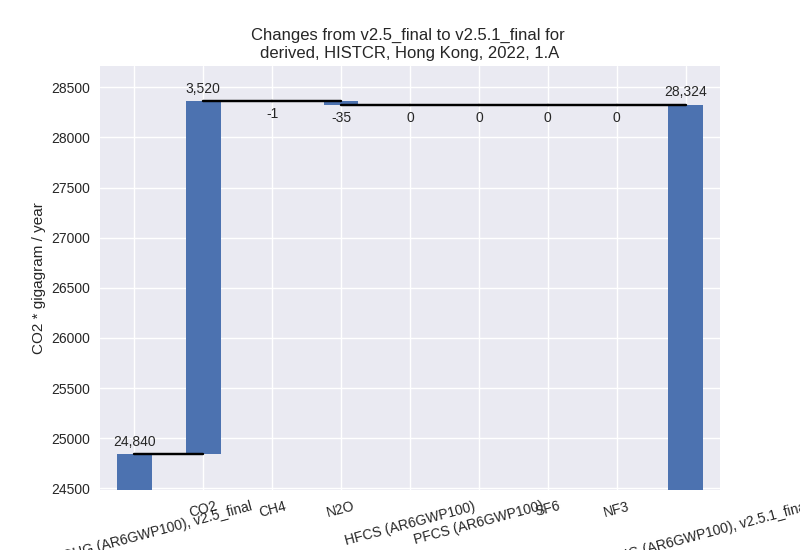
country reported scenario (HISTCR):
Most important changes per time frame
For 2022 the following sector-gas combinations have the highest absolute impact on national total KyotoGHG (AR6GWP100) emissions in 2022 (top 5):
- 1: 1.A, CO2 with 3520.04 Gg CO2 / year (14.3%)
- 2: 2, CO2 with -61.55 Gg CO2 / year (-8.0%)
- 3: 1.A, N2O with -35.27 Gg CO2 / year (-17.3%)
- 4: 4, CH4 with 20.90 Gg CO2 / year (0.4%)
- 5: 5, N2O with -17.47 Gg CO2 / year (-6.3%)
For 1990-2022 the following sector-gas combinations have the highest absolute impact on national total KyotoGHG (AR6GWP100) emissions in 1990-2022 (top 5):
- 1: 1.A, CO2 with 378.17 Gg CO2 / year (1.0%)
- 2: 2, CO2 with -64.30 Gg CO2 / year (-8.1%)
- 3: 1.B.2, CH4 with -22.23 Gg CO2 / year (-31.7%)
- 4: M.AG.ELV, N2O with 4.79 Gg CO2 / year (39.0%)
- 5: 3.A, CH4 with -1.97 Gg CO2 / year (-5.8%)
Changes in the main sectors for aggregate KyotoGHG (AR6GWP100) are
- 1: Total sectoral emissions in 2022 are 28387.28 Gg
CO2 / year which is 80.7% of M.0.EL emissions. 2022 Emissions have
changed by 14.0% (3477.60 Gg CO2 /
year). 1990-2022 Emissions have changed by 0.9% (358.17 Gg CO2 / year). For 2022 the
changes per gas
are:

The changes come from the following subsectors:- 1.A: Total sectoral emissions in 2022 are 28323.84
Gg CO2 / year which is 99.8% of category 1 emissions. 2022 Emissions
have changed by 14.0% (3483.92 Gg
CO2 / year). 1990-2022 Emissions have changed by 1.0% (380.48 Gg CO2 / year). For 2022 the
changes per gas
are:
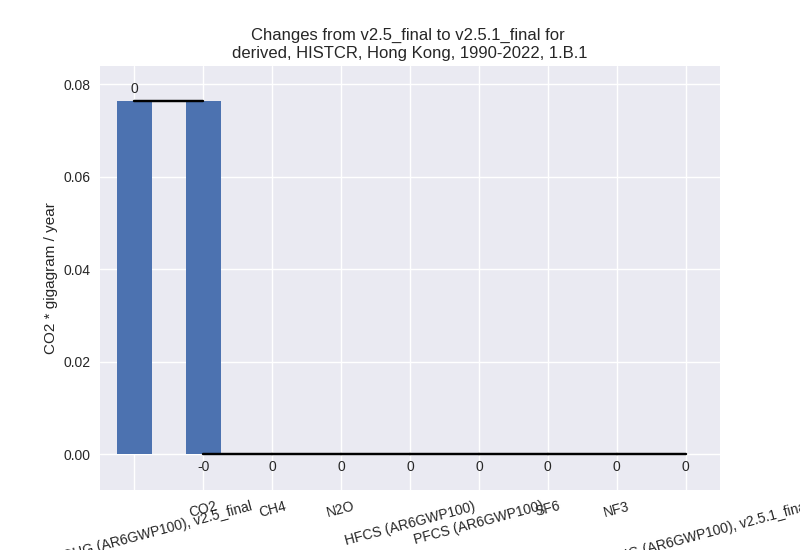
There is no subsector information available in PRIMAP-hist. - 1.B.1: Total sectoral emissions in 2022 are nan Gg
CO2 / year which is nan% of category 1 emissions. 2022 Emissions have
changed by 0.0% (0.00 Gg CO2 /
year). 1990-2022 Emissions have changed by -100.0% (-0.08 Gg CO2 / year). For
1990-2022 the changes per gas
are:
There is no subsector information available in PRIMAP-hist. - 1.B.2: Total sectoral emissions in 2022 are 63.44
Gg CO2 / year which is 0.2% of category 1 emissions. 2022 Emissions have
changed by -9.1% (-6.33 Gg CO2 /
year). 1990-2022 Emissions have changed by -31.7% (-22.23 Gg CO2 / year). For 2022
the changes per gas
are:

For 1990-2022 the changes per gas are:
There is no subsector information available in PRIMAP-hist.
- 1.A: Total sectoral emissions in 2022 are 28323.84
Gg CO2 / year which is 99.8% of category 1 emissions. 2022 Emissions
have changed by 14.0% (3483.92 Gg
CO2 / year). 1990-2022 Emissions have changed by 1.0% (380.48 Gg CO2 / year). For 2022 the
changes per gas
are:
- 2: Total sectoral emissions in 2022 are 930.58 Gg
CO2 / year which is 2.6% of M.0.EL emissions. 2022 Emissions have
changed by -6.2% (-61.54 Gg CO2 /
year). 1990-2022 Emissions have changed by -6.6% (-64.30 Gg CO2 / year). For 2022 the
changes per gas
are:

For 1990-2022 the changes per gas are:
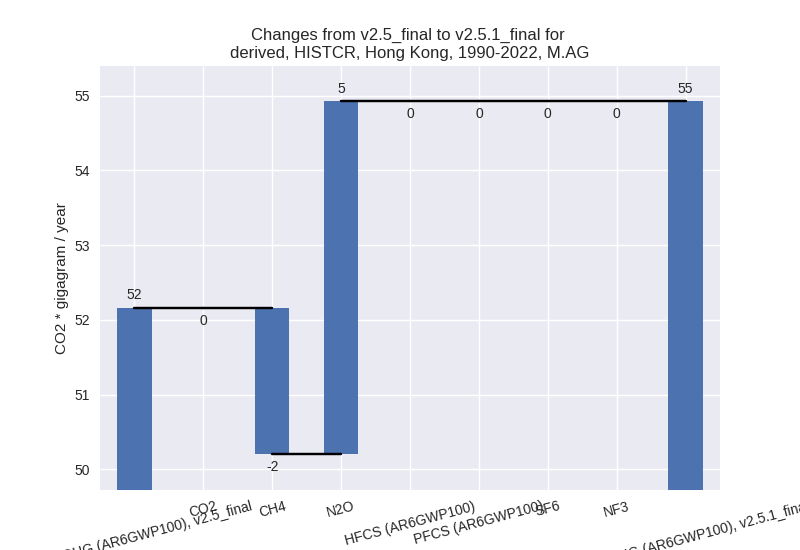
- M.AG: Total sectoral emissions in 2022 are 47.24 Gg
CO2 / year which is 0.1% of M.0.EL emissions. 2022 Emissions have
changed by -0.9% (-0.44 Gg CO2 /
year). 1990-2022 Emissions have changed by 5.3% (2.77 Gg CO2 / year). For 1990-2022
the changes per gas
are:
The changes come from the following subsectors:- 3.A: Total sectoral emissions in 2022 are 29.68 Gg
CO2 / year which is 62.8% of category M.AG emissions. 2022 Emissions
have changed by -21.4% (-8.09 Gg CO2
/ year). 1990-2022 Emissions have changed by -5.1% (-2.03 Gg CO2 / year). For 2022 the
changes per gas
are:
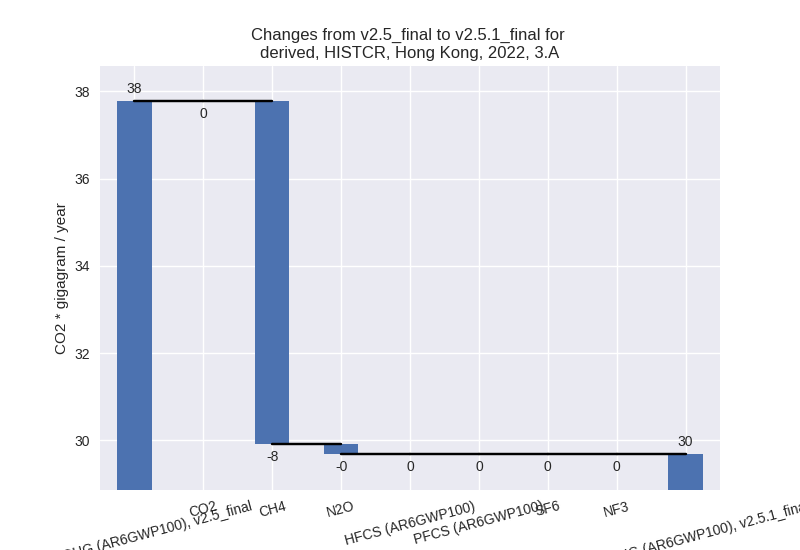
For 1990-2022 the changes per gas are:
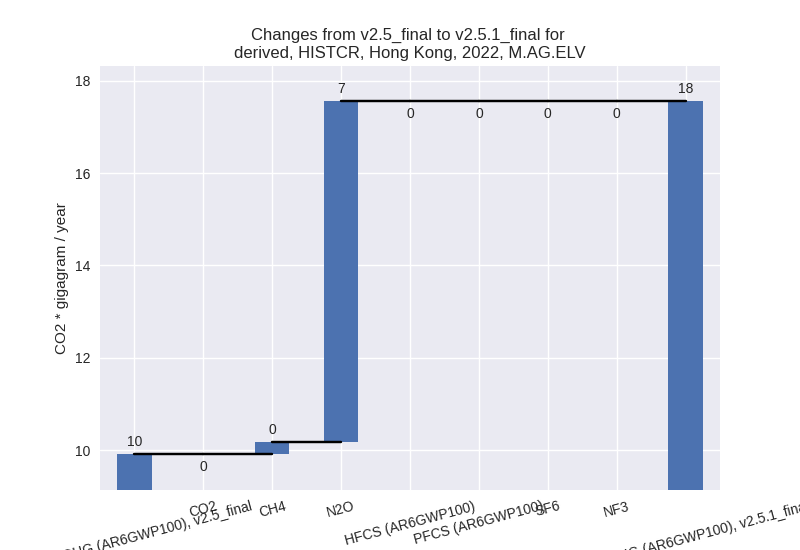
There is no subsector information available in PRIMAP-hist. - M.AG.ELV: Total sectoral emissions in 2022 are
17.56 Gg CO2 / year which is 37.2% of category M.AG emissions. 2022
Emissions have changed by 77.2%
(7.65 Gg CO2 / year). 1990-2022 Emissions have changed by 38.7% (4.80 Gg CO2 / year). For 2022 the
changes per gas
are:
For 1990-2022 the changes per gas are:
There is no subsector information available in PRIMAP-hist.
- 3.A: Total sectoral emissions in 2022 are 29.68 Gg
CO2 / year which is 62.8% of category M.AG emissions. 2022 Emissions
have changed by -21.4% (-8.09 Gg CO2
/ year). 1990-2022 Emissions have changed by -5.1% (-2.03 Gg CO2 / year). For 2022 the
changes per gas
are:
- 4: Total sectoral emissions in 2022 are 5571.12 Gg CO2 / year which is 15.8% of M.0.EL emissions. 2022 Emissions have changed by 0.4% (19.83 Gg CO2 / year). 1990-2022 Emissions have changed by 0.0% (0.60 Gg CO2 / year).
- 5: Total sectoral emissions in 2022 are 259.62 Gg
CO2 / year which is 0.7% of M.0.EL emissions. 2022 Emissions have
changed by -6.3% (-17.47 Gg CO2 /
year). 1990-2022 Emissions have changed by -0.2% (-0.53 Gg CO2 / year). For 2022 the
changes per gas
are:
third party scenario (HISTTP):
Most important changes per time frame
For 2022 the following sector-gas combinations have the highest absolute impact on national total KyotoGHG (AR6GWP100) emissions in 2022 (top 5):
- 1: 1.A, CO2 with 3520.04 Gg CO2 / year (14.3%)
- 2: 2, CO2 with -61.55 Gg CO2 / year (-8.0%)
- 3: 1.A, N2O with -35.27 Gg CO2 / year (-17.3%)
- 4: 4, CH4 with 20.90 Gg CO2 / year (0.4%)
- 5: 5, N2O with -17.47 Gg CO2 / year (-6.3%)
For 1990-2022 the following sector-gas combinations have the highest absolute impact on national total KyotoGHG (AR6GWP100) emissions in 1990-2022 (top 5):
- 1: 1.A, CO2 with 378.17 Gg CO2 / year (1.0%)
- 2: 2, CO2 with -64.30 Gg CO2 / year (-8.1%)
- 3: 1.B.2, CH4 with -22.23 Gg CO2 / year (-31.7%)
- 4: M.AG.ELV, N2O with 4.79 Gg CO2 / year (39.0%)
- 5: 3.A, CH4 with -1.97 Gg CO2 / year (-5.8%)
Changes in the main sectors for aggregate KyotoGHG (AR6GWP100) are
- 1: Total sectoral emissions in 2022 are 28387.28 Gg
CO2 / year which is 80.7% of M.0.EL emissions. 2022 Emissions have
changed by 14.0% (3477.60 Gg CO2 /
year). 1990-2022 Emissions have changed by 0.9% (358.17 Gg CO2 / year). For 2022 the
changes per gas
are:
The changes come from the following subsectors:- 1.A: Total sectoral emissions in 2022 are 28323.84
Gg CO2 / year which is 99.8% of category 1 emissions. 2022 Emissions
have changed by 14.0% (3483.92 Gg
CO2 / year). 1990-2022 Emissions have changed by 1.0% (380.48 Gg CO2 / year). For 2022 the
changes per gas
are:

There is no subsector information available in PRIMAP-hist. - 1.B.1: Total sectoral emissions in 2022 are nan Gg
CO2 / year which is nan% of category 1 emissions. 2022 Emissions have
changed by 0.0% (0.00 Gg CO2 /
year). 1990-2022 Emissions have changed by -100.0% (-0.08 Gg CO2 / year). For
1990-2022 the changes per gas
are:

There is no subsector information available in PRIMAP-hist. - 1.B.2: Total sectoral emissions in 2022 are 63.44
Gg CO2 / year which is 0.2% of category 1 emissions. 2022 Emissions have
changed by -9.1% (-6.33 Gg CO2 /
year). 1990-2022 Emissions have changed by -31.7% (-22.23 Gg CO2 / year). For 2022
the changes per gas
are:

For 1990-2022 the changes per gas are: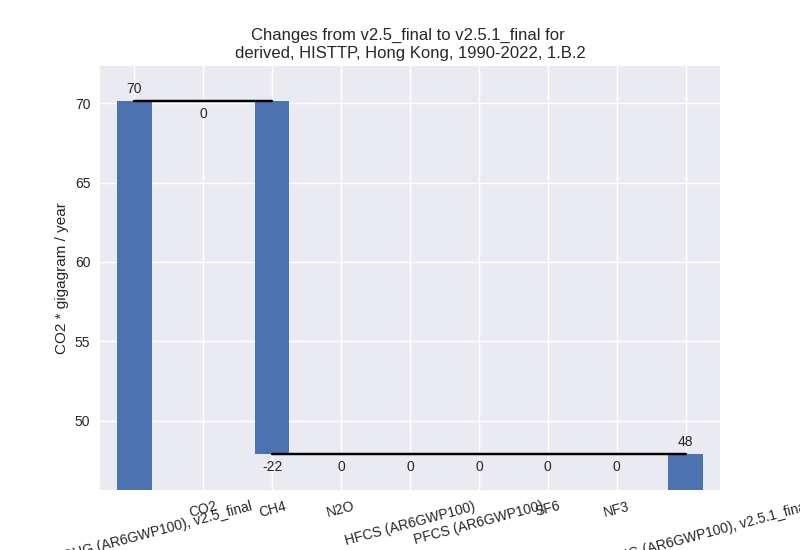
There is no subsector information available in PRIMAP-hist.
- 1.A: Total sectoral emissions in 2022 are 28323.84
Gg CO2 / year which is 99.8% of category 1 emissions. 2022 Emissions
have changed by 14.0% (3483.92 Gg
CO2 / year). 1990-2022 Emissions have changed by 1.0% (380.48 Gg CO2 / year). For 2022 the
changes per gas
are:
- 2: Total sectoral emissions in 2022 are 930.58 Gg
CO2 / year which is 2.6% of M.0.EL emissions. 2022 Emissions have
changed by -6.2% (-61.54 Gg CO2 /
year). 1990-2022 Emissions have changed by -6.6% (-64.30 Gg CO2 / year). For 2022 the
changes per gas
are:

For 1990-2022 the changes per gas are: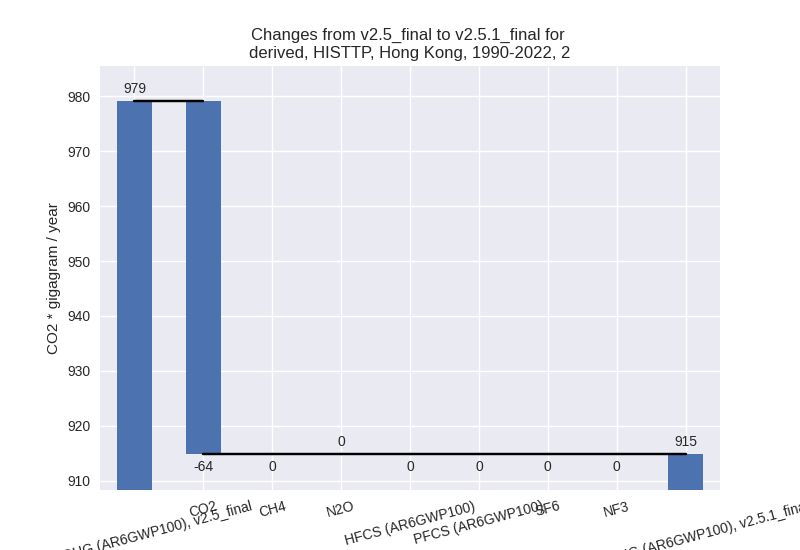
- M.AG: Total sectoral emissions in 2022 are 47.24 Gg
CO2 / year which is 0.1% of M.0.EL emissions. 2022 Emissions have
changed by -0.9% (-0.44 Gg CO2 /
year). 1990-2022 Emissions have changed by 5.3% (2.77 Gg CO2 / year). For 1990-2022
the changes per gas
are:

The changes come from the following subsectors:- 3.A: Total sectoral emissions in 2022 are 29.68 Gg
CO2 / year which is 62.8% of category M.AG emissions. 2022 Emissions
have changed by -21.4% (-8.09 Gg CO2
/ year). 1990-2022 Emissions have changed by -5.1% (-2.03 Gg CO2 / year). For 2022 the
changes per gas
are:

For 1990-2022 the changes per gas are:
There is no subsector information available in PRIMAP-hist. - M.AG.ELV: Total sectoral emissions in 2022 are
17.56 Gg CO2 / year which is 37.2% of category M.AG emissions. 2022
Emissions have changed by 77.2%
(7.65 Gg CO2 / year). 1990-2022 Emissions have changed by 38.7% (4.80 Gg CO2 / year). For 2022 the
changes per gas
are:

For 1990-2022 the changes per gas are: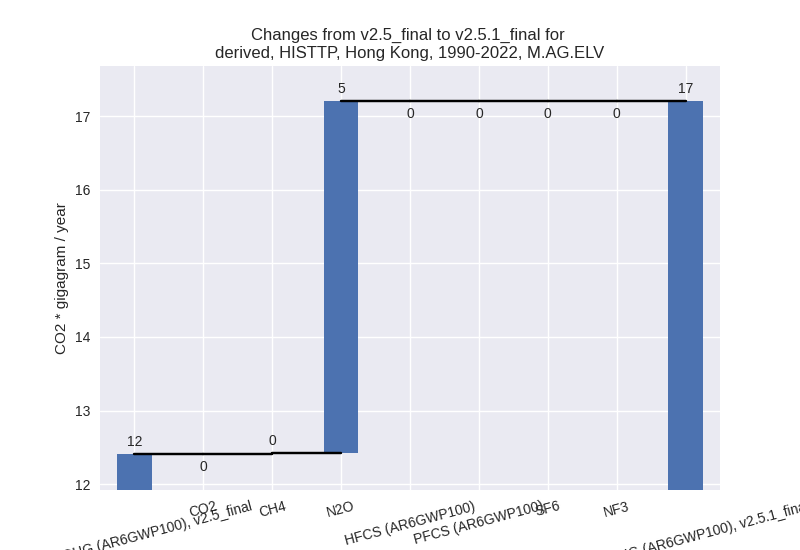
There is no subsector information available in PRIMAP-hist.
- 3.A: Total sectoral emissions in 2022 are 29.68 Gg
CO2 / year which is 62.8% of category M.AG emissions. 2022 Emissions
have changed by -21.4% (-8.09 Gg CO2
/ year). 1990-2022 Emissions have changed by -5.1% (-2.03 Gg CO2 / year). For 2022 the
changes per gas
are:
- 4: Total sectoral emissions in 2022 are 5571.12 Gg CO2 / year which is 15.8% of M.0.EL emissions. 2022 Emissions have changed by 0.4% (19.83 Gg CO2 / year). 1990-2022 Emissions have changed by 0.0% (0.60 Gg CO2 / year).
- 5: Total sectoral emissions in 2022 are 259.62 Gg
CO2 / year which is 0.7% of M.0.EL emissions. 2022 Emissions have
changed by -6.3% (-17.47 Gg CO2 /
year). 1990-2022 Emissions have changed by -0.2% (-0.53 Gg CO2 / year). For 2022 the
changes per gas
are:
