Changes in PRIMAP-hist v2.5.1_final compared to v2.5_final for Hungary
2024-02-29
Johannes Gütschow
Change analysis for Hungary for PRIMAP-hist v2.5.1_final compared to v2.5_final
Overview over emissions by sector and gas
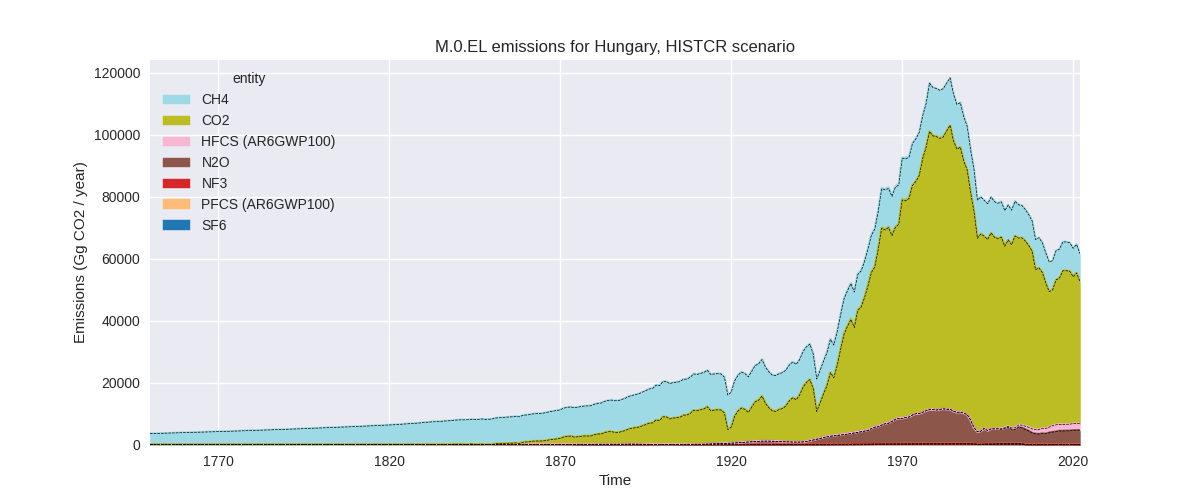
The following figures show the aggregate national total emissions excluding LULUCF AR6GWP100 for the country reported priority scenario. The dotted linesshow the v2.5_final data.


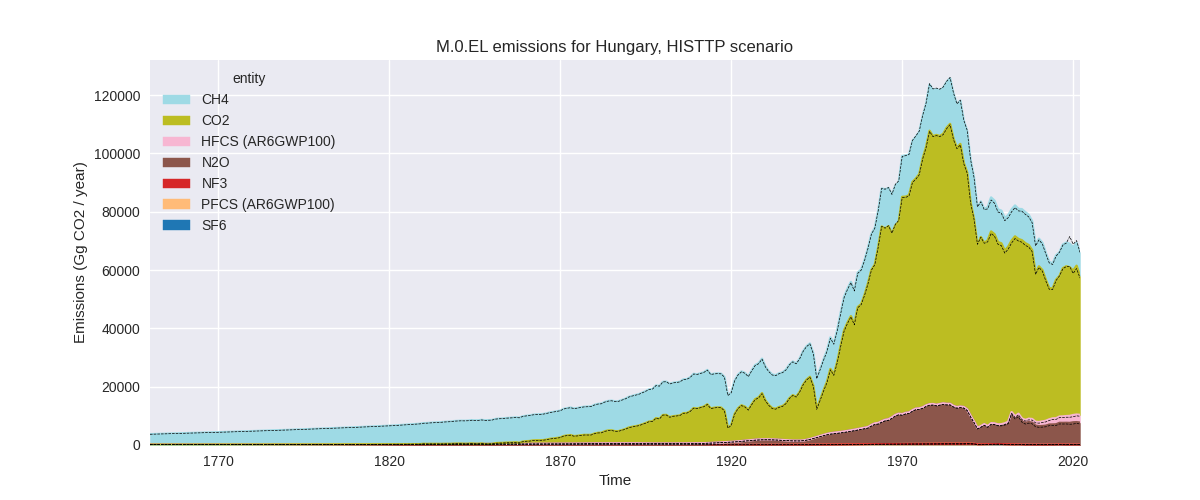
The following figures show the aggregate national total emissions excluding LULUCF AR6GWP100 for the third party priority scenario. The dotted linesshow the v2.5_final data.

Overview over changes
In the country reported priority scenario we have the following changes for aggregate Kyoto GHG and national total emissions excluding LULUCF (M.0.EL):
- Emissions in 2022 have changed by -0.5%% (-310.79 Gg CO2 / year)
- Emissions in 1990-2022 have changed by -0.0%% (-9.42 Gg CO2 / year)
In the third party priority scenario we have the following changes for aggregate Kyoto GHG and national total emissions excluding LULUCF (M.0.EL):
- Emissions in 2022 have changed by -0.3%% (-180.81 Gg CO2 / year)
- Emissions in 1990-2022 have changed by 0.3%% (255.53 Gg CO2 / year)
Most important changes per scenario and time frame
In the country reported priority scenario the following sector-gas combinations have the highest absolute impact on national total KyotoGHG (AR6GWP100) emissions in 2022 (top 5):
- 1: 2, CO2 with -382.58 Gg CO2 / year (-7.7%)
- 2: 4, CH4 with 203.00 Gg CO2 / year (5.9%)
- 3: M.AG.ELV, N2O with -185.63 Gg CO2 / year (-4.9%)
- 4: 1.A, CH4 with -82.86 Gg CO2 / year (-12.5%)
- 5: 2, N2O with 71.42 Gg CO2 / year (39.2%)
In the country reported priority scenario the following sector-gas combinations have the highest absolute impact on national total KyotoGHG (AR6GWP100) emissions in 1990-2022 (top 5):
- 1: 2, CO2 with -11.59 Gg CO2 / year (-0.2%)
- 2: 4, CH4 with 6.15 Gg CO2 / year (0.2%)
- 3: M.AG.ELV, N2O with -5.63 Gg CO2 / year (-0.2%)
- 4: 1.A, CH4 with -2.51 Gg CO2 / year (-0.4%)
- 5: 2, N2O with 2.16 Gg CO2 / year (0.2%)
In the third party priority scenario the following sector-gas combinations have the highest absolute impact on national total KyotoGHG (AR6GWP100) emissions in 2022 (top 5):
- 1: 1.B.2, CH4 with -1378.02 Gg CO2 / year (-41.9%)
- 2: 4, CH4 with 520.71 Gg CO2 / year (28.2%)
- 3: 1.A, CO2 with 337.94 Gg CO2 / year (0.8%)
- 4: 2, CO2 with -331.38 Gg CO2 / year (-8.1%)
- 5: 2, N2O with 323.95 Gg CO2 / year (25.7%)
In the third party priority scenario the following sector-gas combinations have the highest absolute impact on national total KyotoGHG (AR6GWP100) emissions in 1990-2022 (top 5):
- 1: M.AG.ELV, CO2 with 381.88 Gg CO2 / year (375.4%)
- 2: M.AG.ELV, N2O with 352.85 Gg CO2 / year (8.7%)
- 3: 2, CO2 with -294.56 Gg CO2 / year (-8.0%)
- 4: 1.B.2, CH4 with -201.27 Gg CO2 / year (-9.2%)
- 5: 2, N2O with 24.38 Gg CO2 / year (1.3%)
Notes on data changes
No country specific notes present for this changelog.
Changes by sector and gas
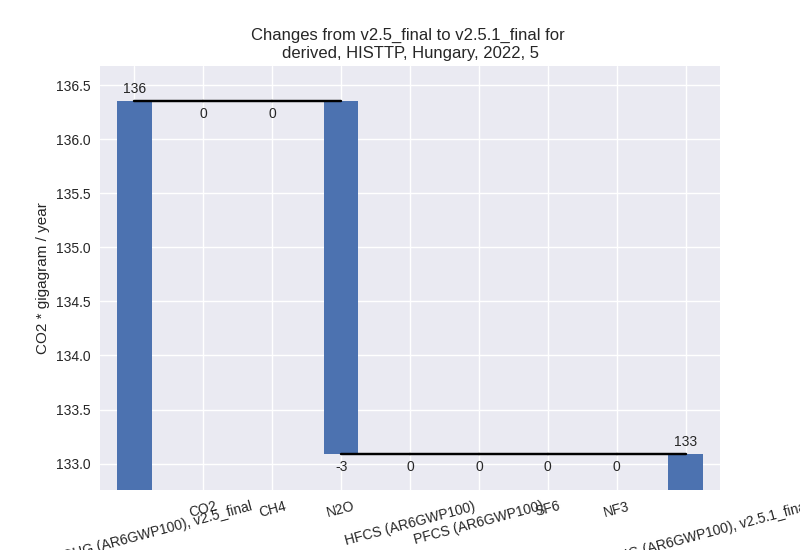
For each scenario and time frame the changes are displayed for all individual sectors and all individual gases. In the sector plot we use aggregate Kyoto GHGs in AR6GWP100. In the gas plot we usenational total emissions without LULUCF. ## country reported scenario
2022

1990-2022

third party scenario
2022


1990-2022
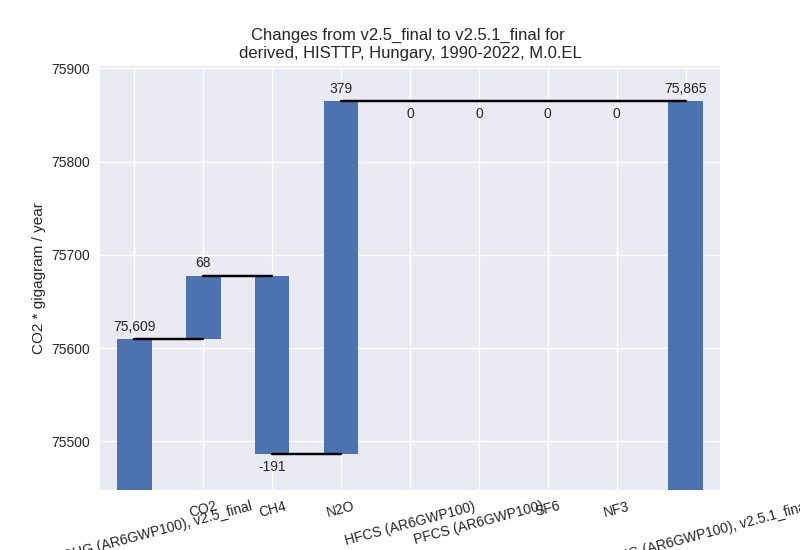
Detailed changes for the scenarios:
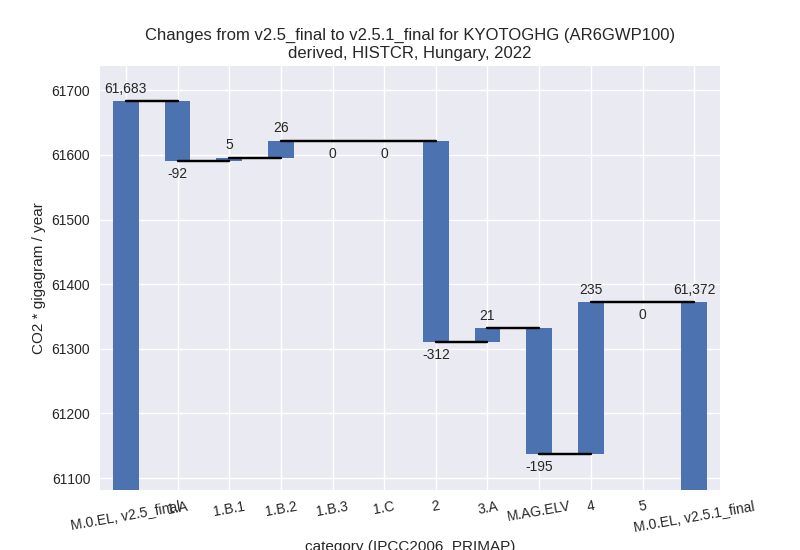
country reported scenario (HISTCR):
Most important changes per time frame
For 2022 the following sector-gas combinations have the highest absolute impact on national total KyotoGHG (AR6GWP100) emissions in 2022 (top 5):
- 1: 2, CO2 with -382.58 Gg CO2 / year (-7.7%)
- 2: 4, CH4 with 203.00 Gg CO2 / year (5.9%)
- 3: M.AG.ELV, N2O with -185.63 Gg CO2 / year (-4.9%)
- 4: 1.A, CH4 with -82.86 Gg CO2 / year (-12.5%)
- 5: 2, N2O with 71.42 Gg CO2 / year (39.2%)
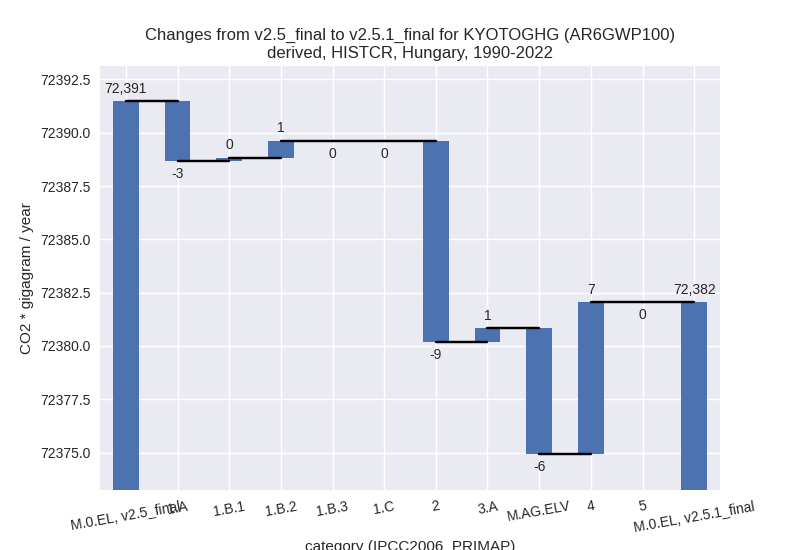
For 1990-2022 the following sector-gas combinations have the highest absolute impact on national total KyotoGHG (AR6GWP100) emissions in 1990-2022 (top 5):
- 1: 2, CO2 with -11.59 Gg CO2 / year (-0.2%)
- 2: 4, CH4 with 6.15 Gg CO2 / year (0.2%)
- 3: M.AG.ELV, N2O with -5.63 Gg CO2 / year (-0.2%)
- 4: 1.A, CH4 with -2.51 Gg CO2 / year (-0.4%)
- 5: 2, N2O with 2.16 Gg CO2 / year (0.2%)
Changes in the main sectors for aggregate KyotoGHG (AR6GWP100) are
- 1: Total sectoral emissions in 2022 are 43105.44 Gg CO2 / year which is 70.2% of M.0.EL emissions. 2022 Emissions have changed by -0.1% (-60.82 Gg CO2 / year). 1990-2022 Emissions have changed by -0.0% (-1.84 Gg CO2 / year).
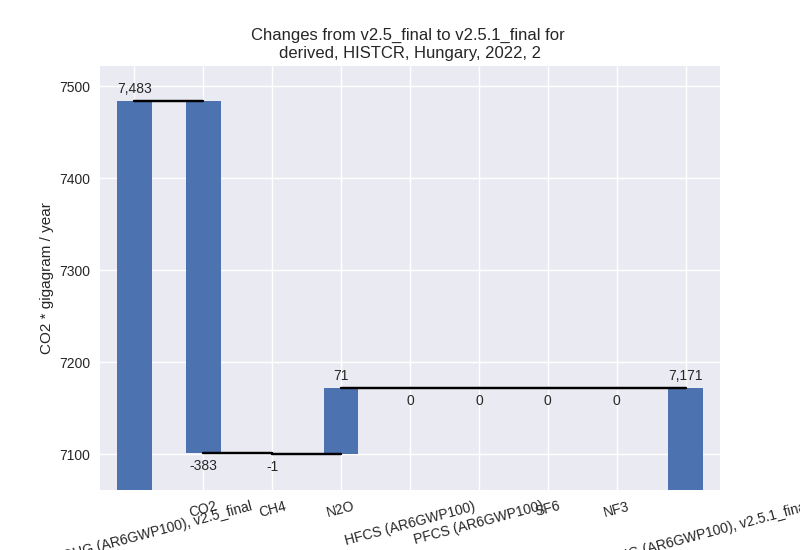
- 2: Total sectoral emissions in 2022 are 7171.34 Gg
CO2 / year which is 11.7% of M.0.EL emissions. 2022 Emissions have
changed by -4.2% (-312.08 Gg CO2 /
year). 1990-2022 Emissions have changed by -0.1% (-9.46 Gg CO2 / year). For 2022 the
changes per gas
are:
- M.AG: Total sectoral emissions in 2022 are 7327.95
Gg CO2 / year which is 11.9% of M.0.EL emissions. 2022 Emissions have
changed by -2.3% (-173.19 Gg CO2 /
year). 1990-2022 Emissions have changed by -0.1% (-5.25 Gg CO2 / year). For 2022 the
changes per gas
are:

The changes come from the following subsectors:- 3.A: Total sectoral emissions in 2022 are 3422.65 Gg CO2 / year which is 46.7% of category M.AG emissions. 2022 Emissions have changed by 0.6% (21.40 Gg CO2 / year). 1990-2022 Emissions have changed by 0.0% (0.65 Gg CO2 / year).
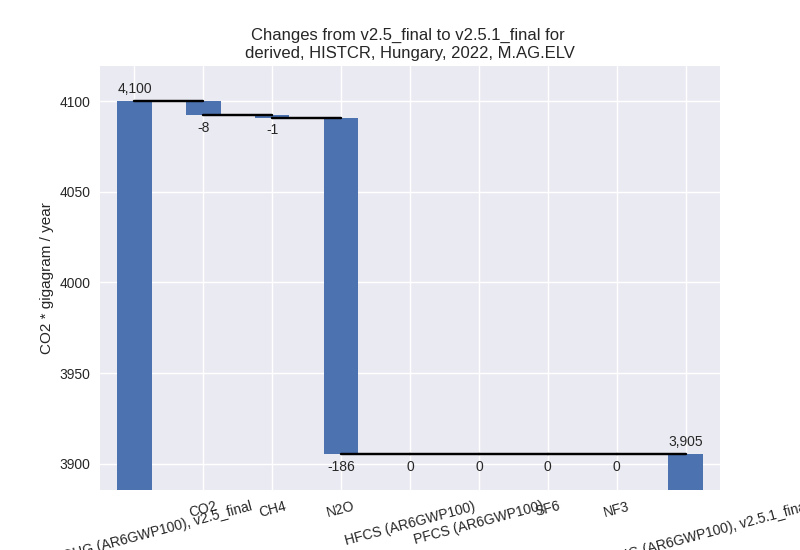
- M.AG.ELV: Total sectoral emissions in 2022 are
3905.30 Gg CO2 / year which is 53.3% of category M.AG emissions. 2022
Emissions have changed by -4.7%
(-194.59 Gg CO2 / year). 1990-2022 Emissions have changed by -0.2% (-5.90 Gg CO2 / year). For 2022 the
changes per gas
are:
There is no subsector information available in PRIMAP-hist.
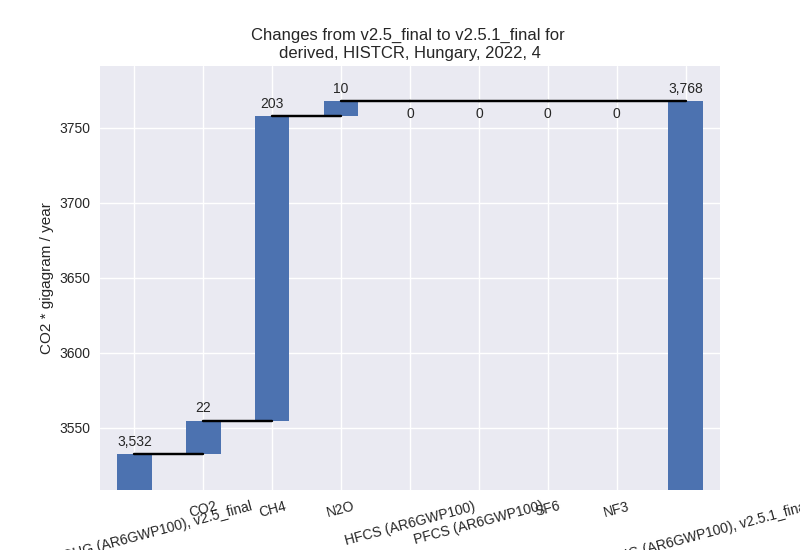
- 4: Total sectoral emissions in 2022 are 3767.52 Gg
CO2 / year which is 6.1% of M.0.EL emissions. 2022 Emissions have
changed by 6.7% (235.31 Gg CO2 /
year). 1990-2022 Emissions have changed by 0.2% (7.13 Gg CO2 / year). For 2022 the
changes per gas
are:
- 5: No data
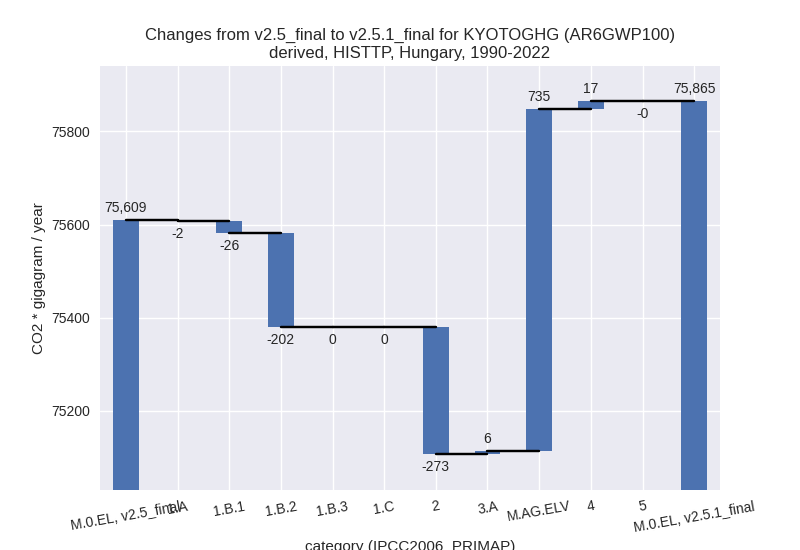
third party scenario (HISTTP):
Most important changes per time frame
For 2022 the following sector-gas combinations have the highest absolute impact on national total KyotoGHG (AR6GWP100) emissions in 2022 (top 5):
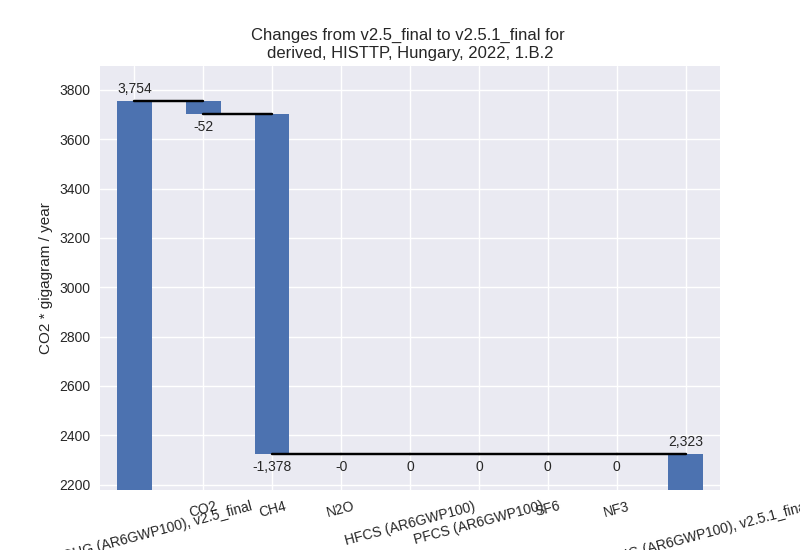
- 1: 1.B.2, CH4 with -1378.02 Gg CO2 / year (-41.9%)
- 2: 4, CH4 with 520.71 Gg CO2 / year (28.2%)
- 3: 1.A, CO2 with 337.94 Gg CO2 / year (0.8%)
- 4: 2, CO2 with -331.38 Gg CO2 / year (-8.1%)
- 5: 2, N2O with 323.95 Gg CO2 / year (25.7%)
For 1990-2022 the following sector-gas combinations have the highest absolute impact on national total KyotoGHG (AR6GWP100) emissions in 1990-2022 (top 5):
- 1: M.AG.ELV, CO2 with 381.88 Gg CO2 / year (375.4%)
- 2: M.AG.ELV, N2O with 352.85 Gg CO2 / year (8.7%)
- 3: 2, CO2 with -294.56 Gg CO2 / year (-8.0%)
- 4: 1.B.2, CH4 with -201.27 Gg CO2 / year (-9.2%)
- 5: 2, N2O with 24.38 Gg CO2 / year (1.3%)
Changes in the main sectors for aggregate KyotoGHG (AR6GWP100) are
- 1: Total sectoral emissions in 2022 are 46645.85 Gg
CO2 / year which is 70.8% of M.0.EL emissions. 2022 Emissions have
changed by -2.2% (-1060.07 Gg CO2 /
year). 1990-2022 Emissions have changed by -0.4% (-229.10 Gg CO2 / year). For 2022
the changes per gas
are:
The changes come from the following subsectors:- 1.A: Total sectoral emissions in 2022 are 43853.54 Gg CO2 / year which is 94.2% of category 1 emissions. 2022 Emissions have changed by 0.5% (233.11 Gg CO2 / year). 1990-2022 Emissions have changed by -0.0% (-1.62 Gg CO2 / year).
- 1.B.1: Total sectoral emissions in 2022 are 395.65
Gg CO2 / year which is 0.8% of category 1 emissions. 2022 Emissions have
changed by 53.1% (137.19 Gg CO2 /
year). 1990-2022 Emissions have changed by -3.6% (-25.61 Gg CO2 / year). For 2022 the
changes per gas
are:

For 1990-2022 the changes per gas are: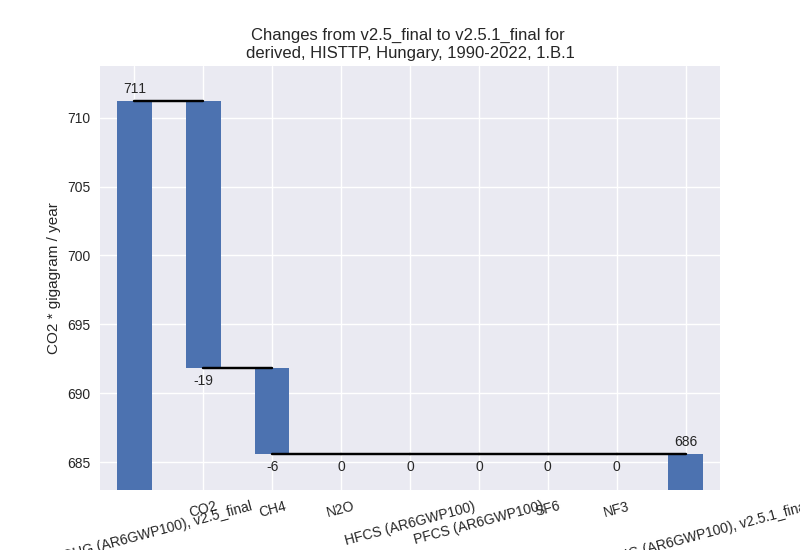
There is no subsector information available in PRIMAP-hist. - 1.B.2: Total sectoral emissions in 2022 are 2323.22
Gg CO2 / year which is 5.0% of category 1 emissions. 2022 Emissions have
changed by -38.1% (-1430.37 Gg CO2 /
year). 1990-2022 Emissions have changed by -8.7% (-201.87 Gg CO2 / year). For 2022
the changes per gas
are:
For 1990-2022 the changes per gas are: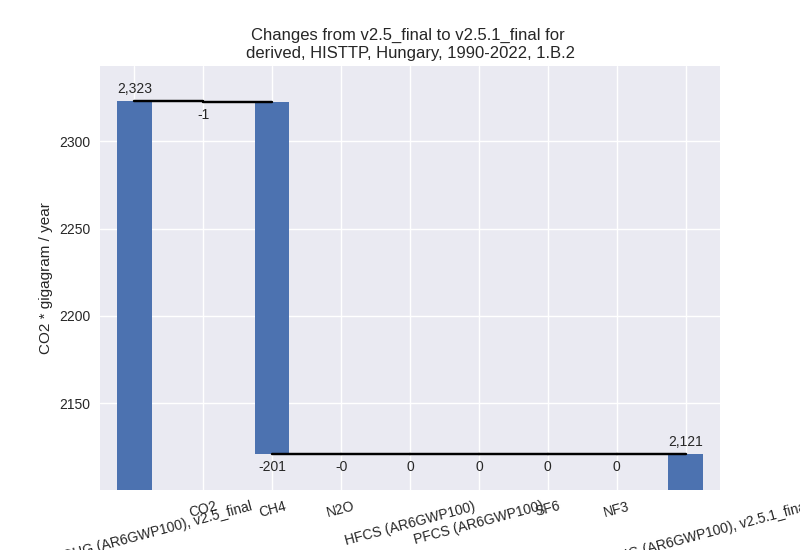
There is no subsector information available in PRIMAP-hist.
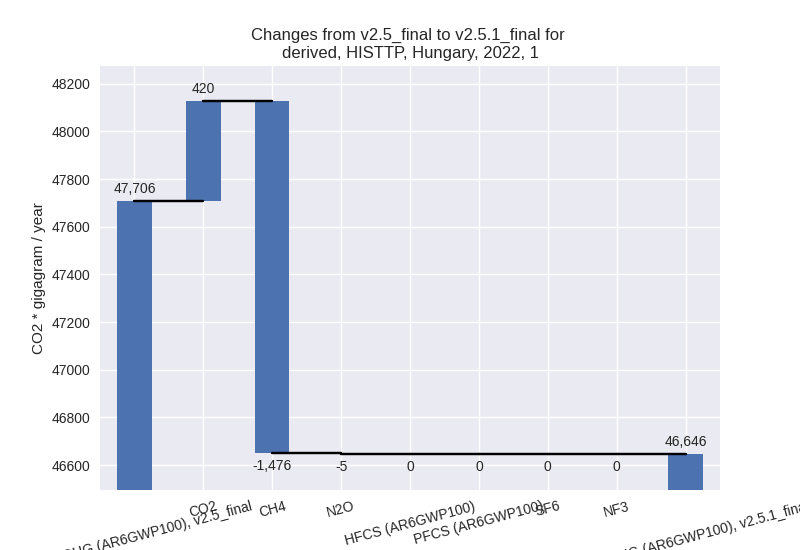
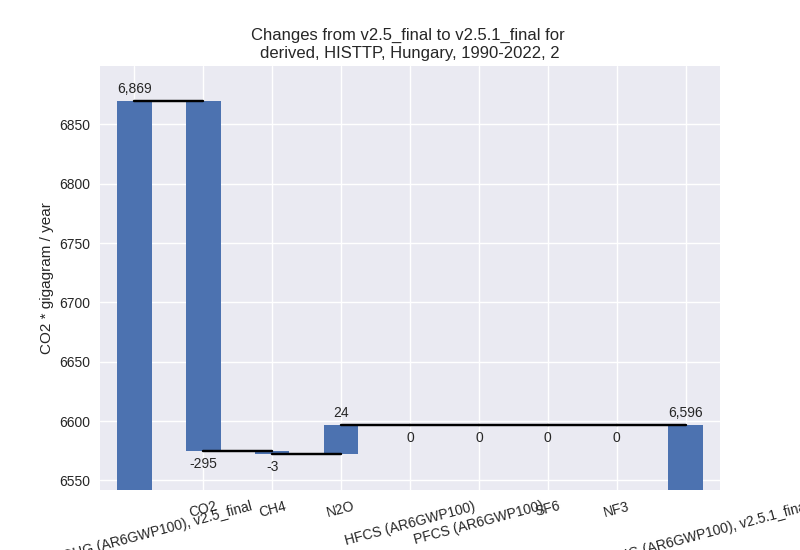
- 2: Total sectoral emissions in 2022 are 8127.03 Gg
CO2 / year which is 12.3% of M.0.EL emissions. 2022 Emissions have
changed by -0.1% (-9.25 Gg CO2 /
year). 1990-2022 Emissions have changed by -4.0% (-273.03 Gg CO2 / year). For
1990-2022 the changes per gas
are:
- M.AG: Total sectoral emissions in 2022 are 8373.59
Gg CO2 / year which is 12.7% of M.0.EL emissions. 2022 Emissions have
changed by 4.3% (345.26 Gg CO2 /
year). 1990-2022 Emissions have changed by 9.6% (741.19 Gg CO2 / year). For 2022 the
changes per gas
are:

For 1990-2022 the changes per gas are:
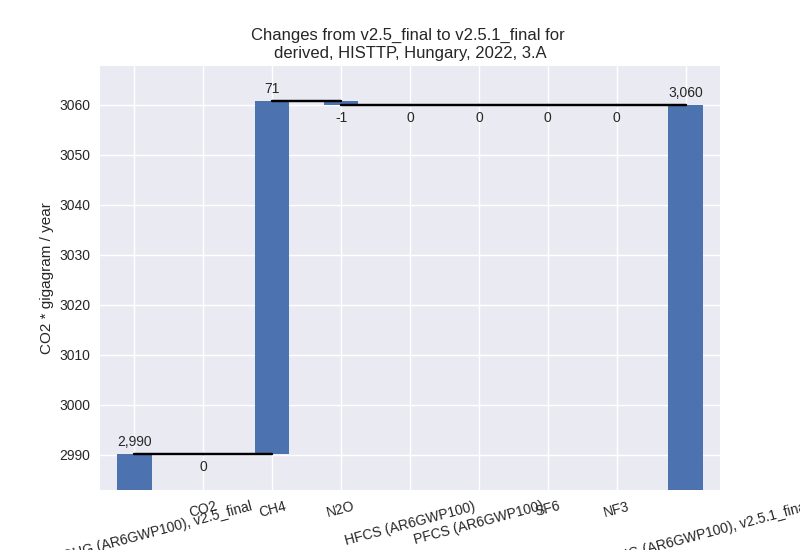
The changes come from the following subsectors:- 3.A: Total sectoral emissions in 2022 are 3059.91
Gg CO2 / year which is 36.5% of category M.AG emissions. 2022 Emissions
have changed by 2.3% (69.85 Gg CO2 /
year). 1990-2022 Emissions have changed by 0.2% (5.96 Gg CO2 / year). For 2022 the
changes per gas
are:
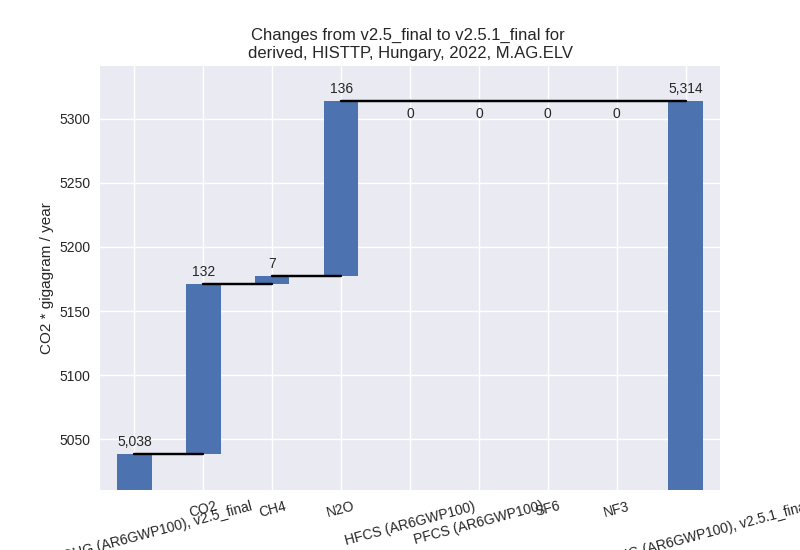
There is no subsector information available in PRIMAP-hist. - M.AG.ELV: Total sectoral emissions in 2022 are
5313.68 Gg CO2 / year which is 63.5% of category M.AG emissions. 2022
Emissions have changed by 5.5%
(275.41 Gg CO2 / year). 1990-2022 Emissions have changed by 17.1% (735.23 Gg CO2 / year). For 2022 the
changes per gas
are:
For 1990-2022 the changes per gas are: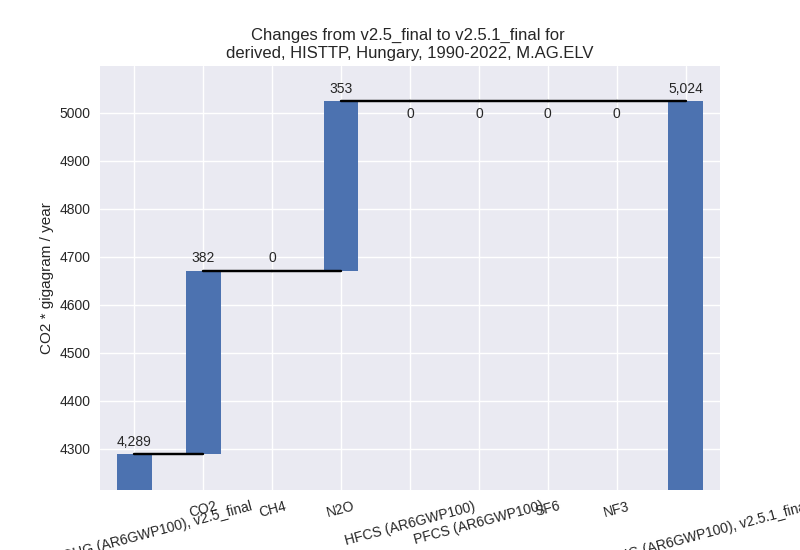
There is no subsector information available in PRIMAP-hist.
- 3.A: Total sectoral emissions in 2022 are 3059.91
Gg CO2 / year which is 36.5% of category M.AG emissions. 2022 Emissions
have changed by 2.3% (69.85 Gg CO2 /
year). 1990-2022 Emissions have changed by 0.2% (5.96 Gg CO2 / year). For 2022 the
changes per gas
are:
- 4: Total sectoral emissions in 2022 are 2571.45 Gg
CO2 / year which is 3.9% of M.0.EL emissions. 2022 Emissions have
changed by 27.0% (546.52 Gg CO2 /
year). 1990-2022 Emissions have changed by 0.4% (16.56 Gg CO2 / year). For 2022 the
changes per gas
are:

- 5: Total sectoral emissions in 2022 are 133.09 Gg
CO2 / year which is 0.2% of M.0.EL emissions. 2022 Emissions have
changed by -2.4% (-3.26 Gg CO2 /
year). 1990-2022 Emissions have changed by -0.0% (-0.10 Gg CO2 / year). For 2022 the
changes per gas
are: