Changes in PRIMAP-hist v2.5.1_final compared to v2.5_final for Indonesia
2024-02-29
Johannes Gütschow
Change analysis for Indonesia for PRIMAP-hist v2.5.1_final compared to v2.5_final
Overview over emissions by sector and gas
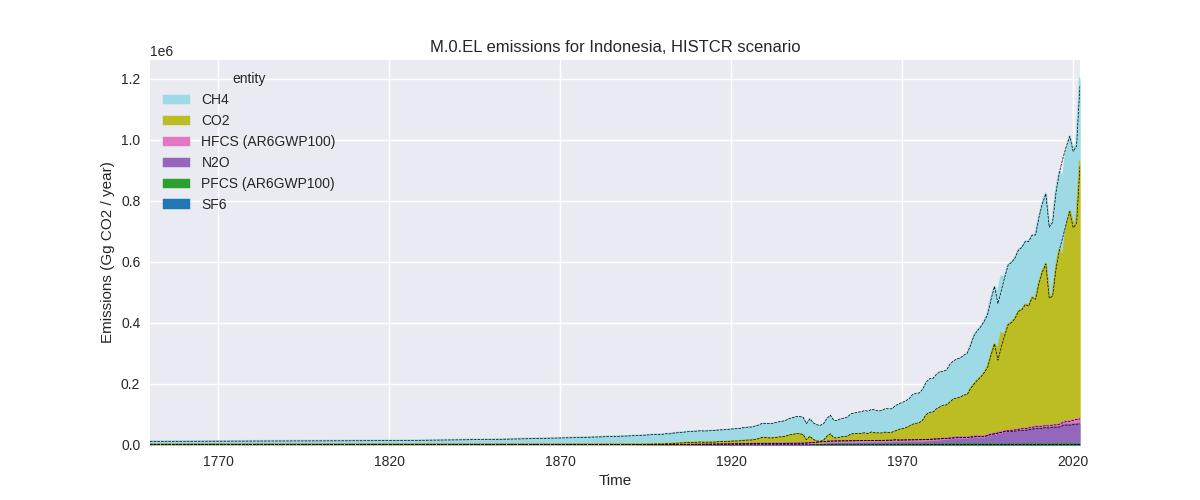
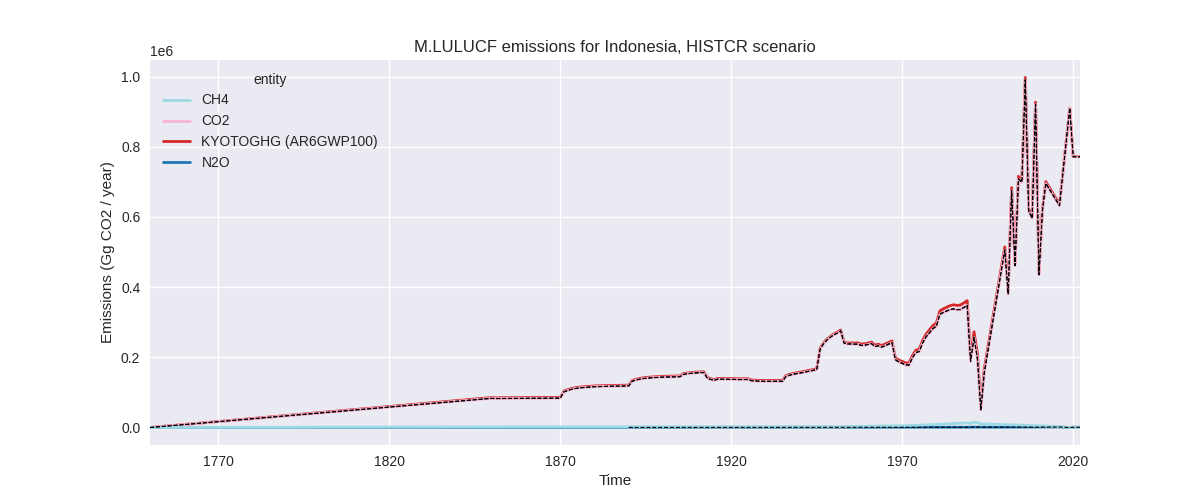
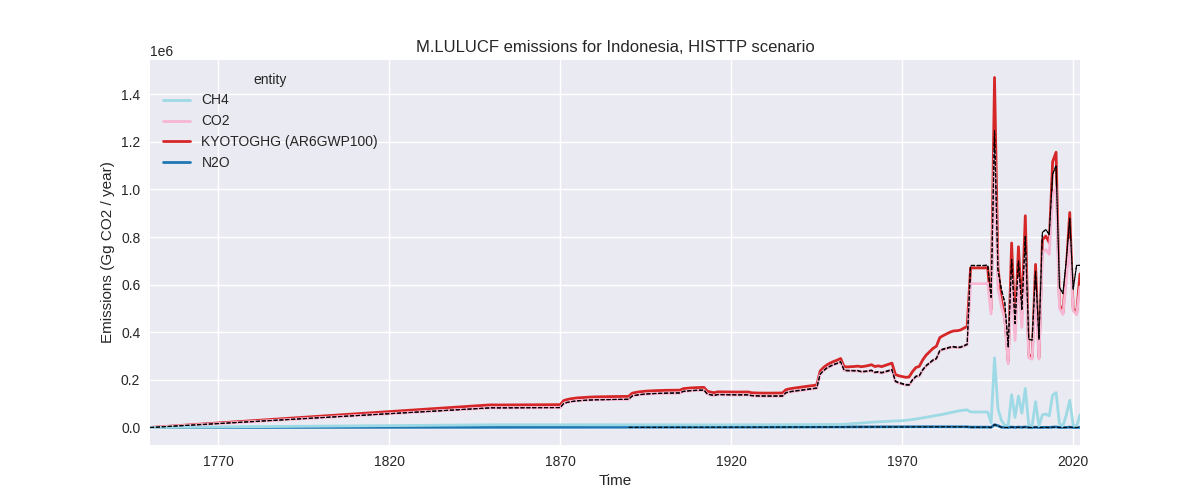
The following figures show the aggregate national total emissions excluding LULUCF AR6GWP100 for the country reported priority scenario. The dotted linesshow the v2.5_final data.

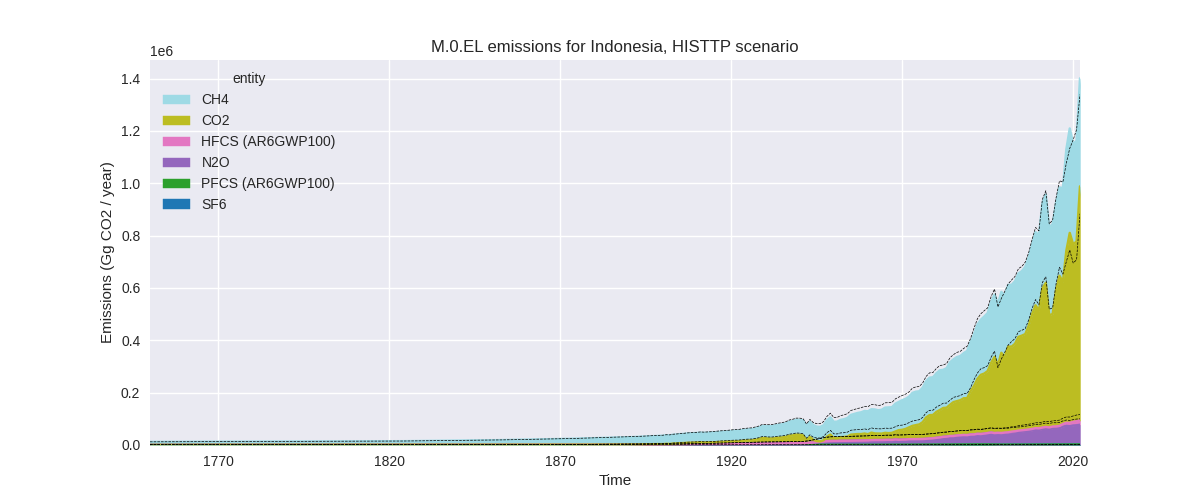
The following figures show the aggregate national total emissions excluding LULUCF AR6GWP100 for the third party priority scenario. The dotted linesshow the v2.5_final data.

Overview over changes
In the country reported priority scenario we have the following changes for aggregate Kyoto GHG and national total emissions excluding LULUCF (M.0.EL):
- Emissions in 2022 have changed by 1.9%% (22112.60 Gg CO2 / year)
- Emissions in 1990-2022 have changed by 0.1%% (865.66 Gg CO2 / year)
In the third party priority scenario we have the following changes for aggregate Kyoto GHG and national total emissions excluding LULUCF (M.0.EL):
- Emissions in 2022 have changed by 4.6%% (61591.30 Gg CO2 / year)
- Emissions in 1990-2022 have changed by -1.2%% (-9480.99 Gg CO2 / year)
Most important changes per scenario and time frame
In the country reported priority scenario the following sector-gas combinations have the highest absolute impact on national total KyotoGHG (AR6GWP100) emissions in 2022 (top 5):
- 1: 1.A, CO2 with 18719.55 Gg CO2 / year (2.5%)
- 2: 4, CH4 with 13553.32 Gg CO2 / year (8.2%)
- 3: M.AG.ELV, CH4 with -6511.22 Gg CO2 / year (-12.5%)
- 4: 2, CO2 with -2218.43 Gg CO2 / year (-3.9%)
- 5: 1.A, CH4 with -2186.06 Gg CO2 / year (-47.0%)
In the country reported priority scenario the following sector-gas combinations have the highest absolute impact on national total KyotoGHG (AR6GWP100) emissions in 1990-2022 (top 5):
- 1: 1.A, CO2 with 904.80 Gg CO2 / year (0.3%)
- 2: 4, CH4 with 410.71 Gg CO2 / year (0.5%)
- 3: M.AG.ELV, CH4 with -248.87 Gg CO2 / year (-0.5%)
- 4: 1.B.1, CO2 with -211.01 Gg CO2 / year (-12.0%)
- 5: 1.B.1, CH4 with -176.71 Gg CO2 / year (-10.0%)
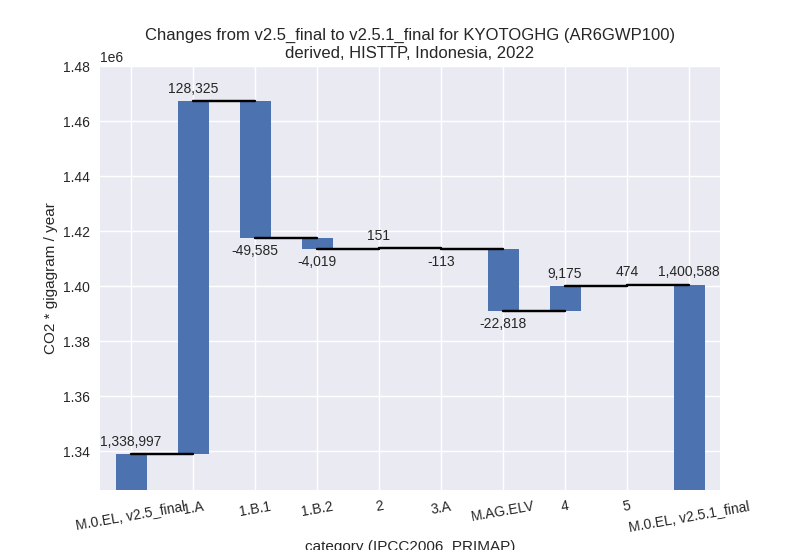
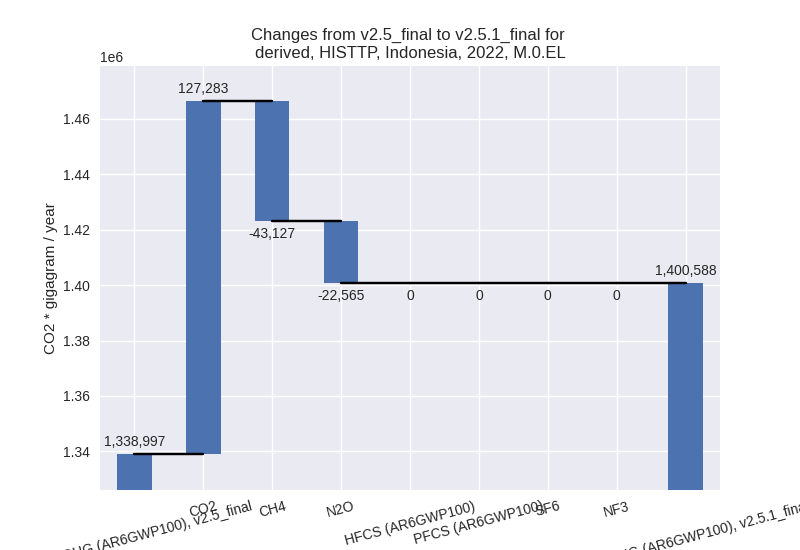
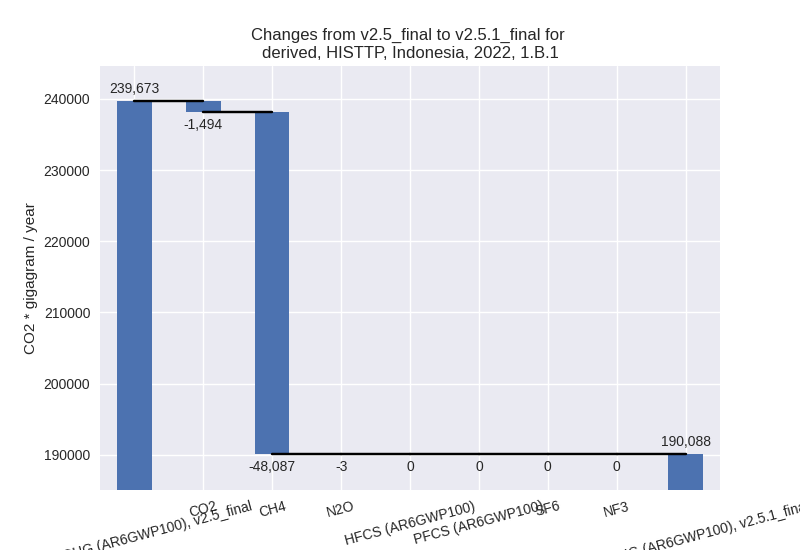
In the third party priority scenario the following sector-gas combinations have the highest absolute impact on national total KyotoGHG (AR6GWP100) emissions in 2022 (top 5):
- 1: 1.A, CO2 with 126751.30 Gg CO2 / year (18.0%)
- 2: 1.B.1, CH4 with -48087.22 Gg CO2 / year (-20.6%)
- 3: M.AG.ELV, N2O with -23496.21 Gg CO2 / year (-29.5%)
- 4: 4, CH4 with 9210.12 Gg CO2 / year (11.7%)
- 5: 1.B.2, CH4 with -4016.46 Gg CO2 / year (-10.8%)
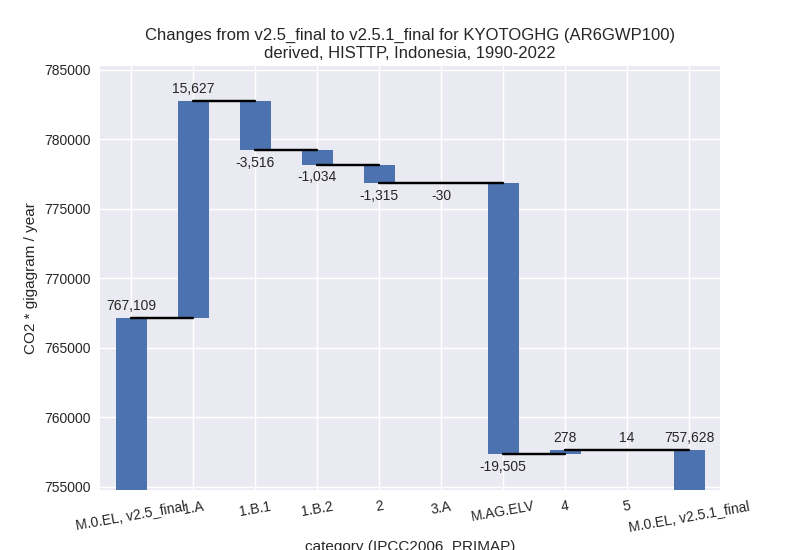
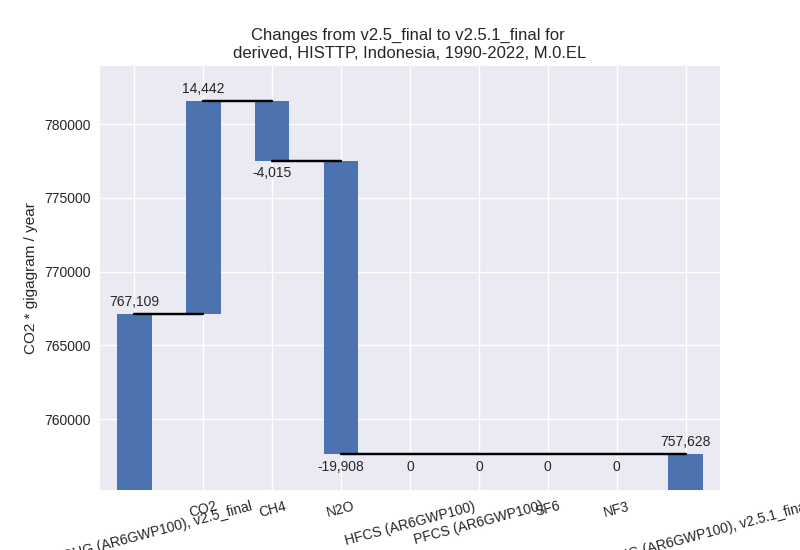
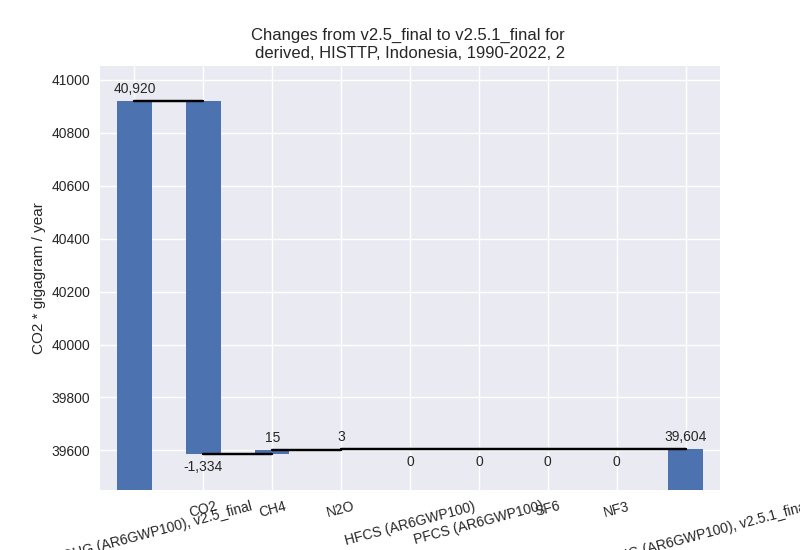
In the third party priority scenario the following sector-gas combinations have the highest absolute impact on national total KyotoGHG (AR6GWP100) emissions in 1990-2022 (top 5):
- 1: M.AG.ELV, N2O with -19962.46 Gg CO2 / year (-33.5%)
- 2: 1.A, CO2 with 15402.86 Gg CO2 / year (4.4%)
- 3: 1.B.1, CH4 with -3304.77 Gg CO2 / year (-4.7%)
- 4: 2, CO2 with -1333.84 Gg CO2 / year (-3.9%)
- 5: 1.B.2, CH4 with -1034.29 Gg CO2 / year (-2.0%)
Notes on data changes
No country specific notes present for this changelog.
Changes by sector and gas
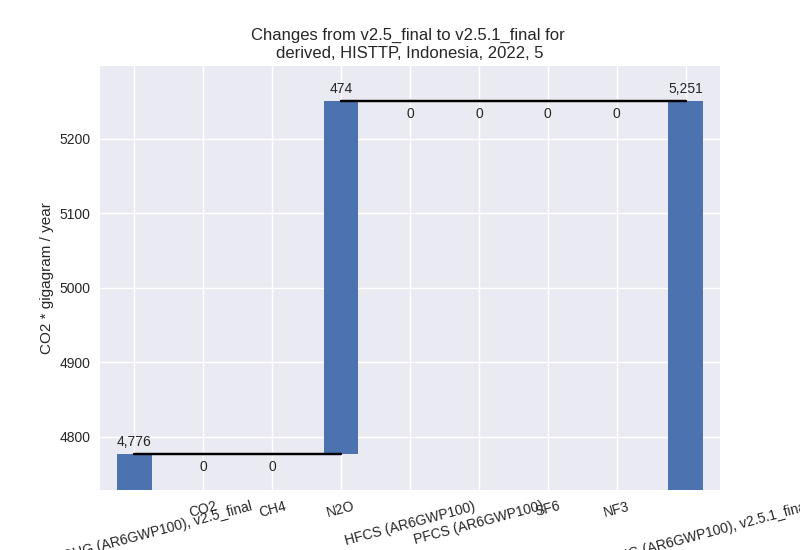
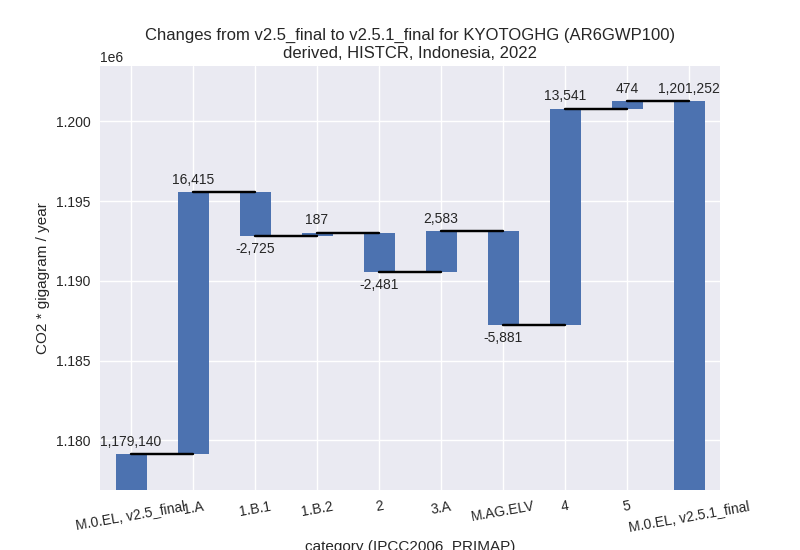
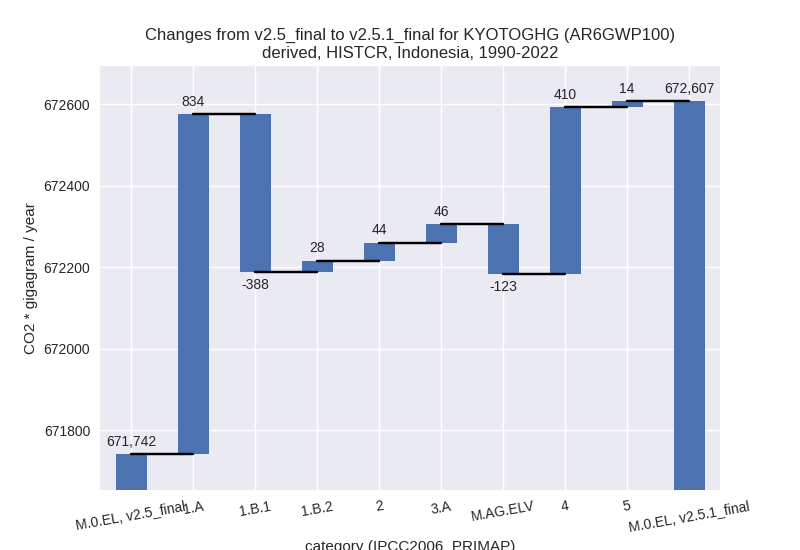
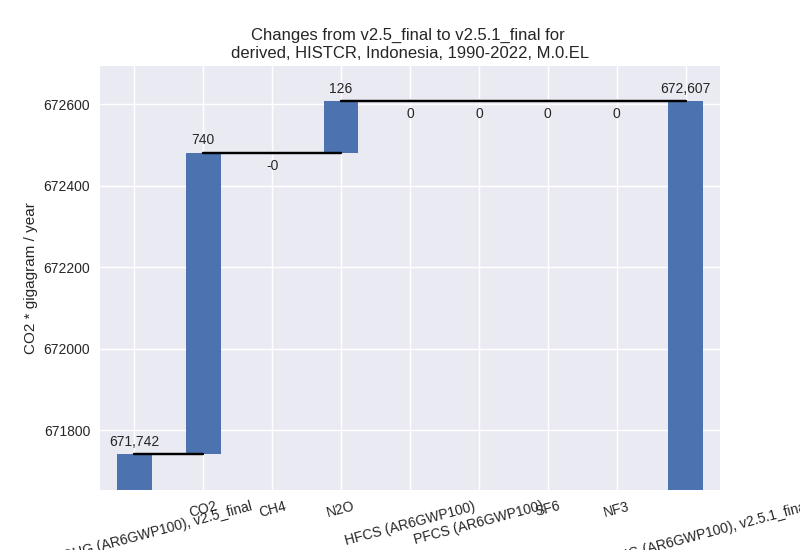
For each scenario and time frame the changes are displayed for all individual sectors and all individual gases. In the sector plot we use aggregate Kyoto GHGs in AR6GWP100. In the gas plot we usenational total emissions without LULUCF. ## country reported scenario
2022

1990-2022
third party scenario
2022
1990-2022
Detailed changes for the scenarios:
country reported scenario (HISTCR):
Most important changes per time frame
For 2022 the following sector-gas combinations have the highest absolute impact on national total KyotoGHG (AR6GWP100) emissions in 2022 (top 5):
- 1: 1.A, CO2 with 18719.55 Gg CO2 / year (2.5%)
- 2: 4, CH4 with 13553.32 Gg CO2 / year (8.2%)
- 3: M.AG.ELV, CH4 with -6511.22 Gg CO2 / year (-12.5%)
- 4: 2, CO2 with -2218.43 Gg CO2 / year (-3.9%)
- 5: 1.A, CH4 with -2186.06 Gg CO2 / year (-47.0%)
For 1990-2022 the following sector-gas combinations have the highest absolute impact on national total KyotoGHG (AR6GWP100) emissions in 1990-2022 (top 5):
- 1: 1.A, CO2 with 904.80 Gg CO2 / year (0.3%)
- 2: 4, CH4 with 410.71 Gg CO2 / year (0.5%)
- 3: M.AG.ELV, CH4 with -248.87 Gg CO2 / year (-0.5%)
- 4: 1.B.1, CO2 with -211.01 Gg CO2 / year (-12.0%)
- 5: 1.B.1, CH4 with -176.71 Gg CO2 / year (-10.0%)
Changes in the main sectors for aggregate KyotoGHG (AR6GWP100) are
- 1: Total sectoral emissions in 2022 are 801359.76 Gg CO2 / year which is 66.7% of M.0.EL emissions. 2022 Emissions have changed by 1.8% (13877.27 Gg CO2 / year). 1990-2022 Emissions have changed by 0.1% (474.46 Gg CO2 / year).
- 2: Total sectoral emissions in 2022 are 73582.17 Gg
CO2 / year which is 6.1% of M.0.EL emissions. 2022 Emissions have
changed by -3.3% (-2481.36 Gg CO2 /
year). 1990-2022 Emissions have changed by 0.1% (43.77 Gg CO2 / year). For 2022 the
changes per gas
are:

- M.AG: Total sectoral emissions in 2022 are
135318.27 Gg CO2 / year which is 11.3% of M.0.EL emissions. 2022
Emissions have changed by -2.4%
(-3298.43 Gg CO2 / year). 1990-2022 Emissions have changed by -0.1% (-77.27 Gg CO2 / year). For 2022 the
changes per gas
are:

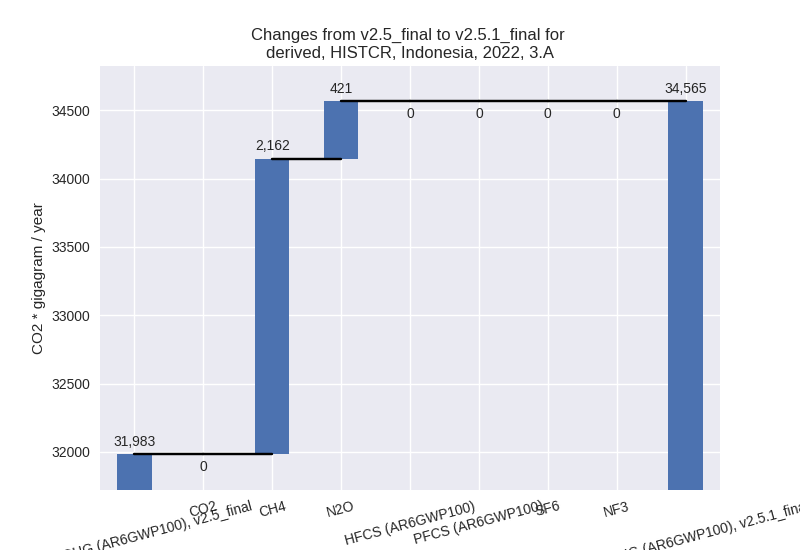
The changes come from the following subsectors:- 3.A: Total sectoral emissions in 2022 are 34565.41
Gg CO2 / year which is 25.5% of category M.AG emissions. 2022 Emissions
have changed by 8.1% (2582.56 Gg CO2
/ year). 1990-2022 Emissions have changed by 0.2% (45.52 Gg CO2 / year). For 2022 the
changes per gas
are:
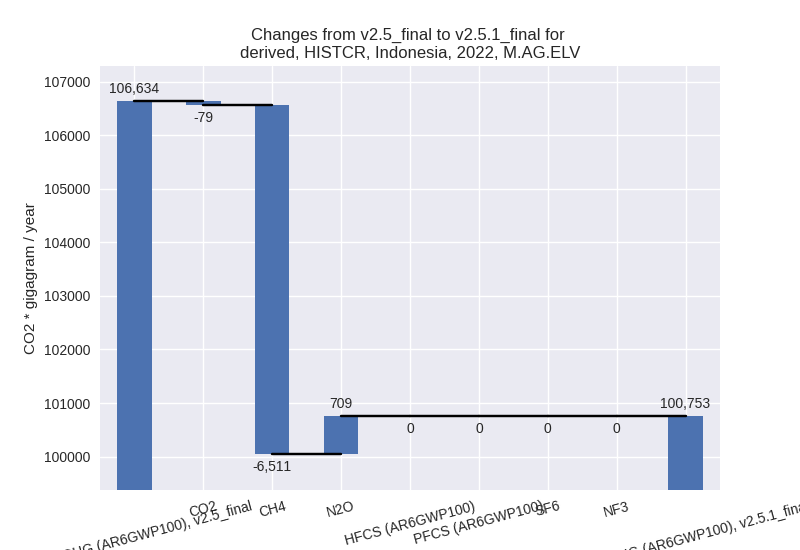
There is no subsector information available in PRIMAP-hist. - M.AG.ELV: Total sectoral emissions in 2022 are
100752.86 Gg CO2 / year which is 74.5% of category M.AG emissions. 2022
Emissions have changed by -5.5%
(-5881.00 Gg CO2 / year). 1990-2022 Emissions have changed by -0.1% (-122.79 Gg CO2 / year). For 2022
the changes per gas
are:
There is no subsector information available in PRIMAP-hist.
- 3.A: Total sectoral emissions in 2022 are 34565.41
Gg CO2 / year which is 25.5% of category M.AG emissions. 2022 Emissions
have changed by 8.1% (2582.56 Gg CO2
/ year). 1990-2022 Emissions have changed by 0.2% (45.52 Gg CO2 / year). For 2022 the
changes per gas
are:
- 4: Total sectoral emissions in 2022 are 185741.35
Gg CO2 / year which is 15.5% of M.0.EL emissions. 2022 Emissions have
changed by 7.9% (13540.73 Gg CO2 /
year). 1990-2022 Emissions have changed by 0.4% (410.33 Gg CO2 / year). For 2022 the
changes per gas
are:

- 5: Total sectoral emissions in 2022 are 5250.65 Gg
CO2 / year which is 0.4% of M.0.EL emissions. 2022 Emissions have
changed by 9.9% (474.37 Gg CO2 /
year). 1990-2022 Emissions have changed by 0.4% (14.37 Gg CO2 / year). For 2022 the
changes per gas
are:

third party scenario (HISTTP):
Most important changes per time frame
For 2022 the following sector-gas combinations have the highest absolute impact on national total KyotoGHG (AR6GWP100) emissions in 2022 (top 5):
- 1: 1.A, CO2 with 126751.30 Gg CO2 / year (18.0%)
- 2: 1.B.1, CH4 with -48087.22 Gg CO2 / year (-20.6%)
- 3: M.AG.ELV, N2O with -23496.21 Gg CO2 / year (-29.5%)
- 4: 4, CH4 with 9210.12 Gg CO2 / year (11.7%)
- 5: 1.B.2, CH4 with -4016.46 Gg CO2 / year (-10.8%)
For 1990-2022 the following sector-gas combinations have the highest absolute impact on national total KyotoGHG (AR6GWP100) emissions in 1990-2022 (top 5):
- 1: M.AG.ELV, N2O with -19962.46 Gg CO2 / year (-33.5%)
- 2: 1.A, CO2 with 15402.86 Gg CO2 / year (4.4%)
- 3: 1.B.1, CH4 with -3304.77 Gg CO2 / year (-4.7%)
- 4: 2, CO2 with -1333.84 Gg CO2 / year (-3.9%)
- 5: 1.B.2, CH4 with -1034.29 Gg CO2 / year (-2.0%)
Changes in the main sectors for aggregate KyotoGHG (AR6GWP100) are
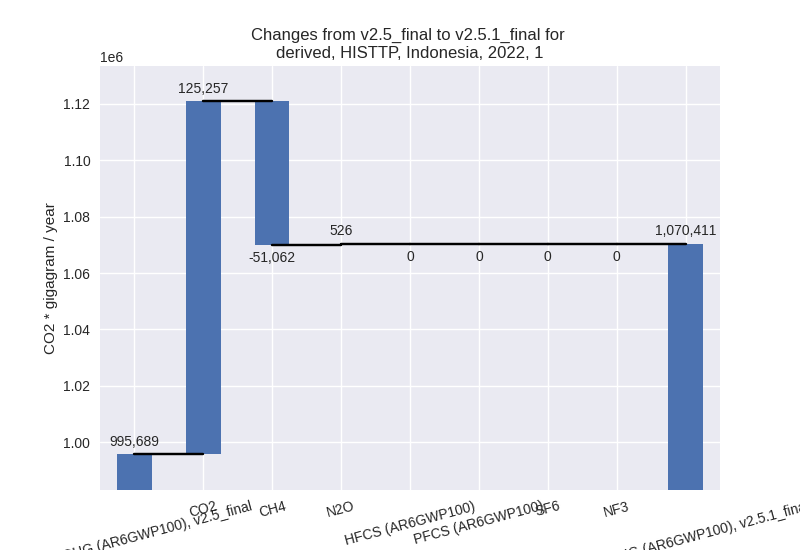
- 1: Total sectoral emissions in 2022 are 1070410.80
Gg CO2 / year which is 76.4% of M.0.EL emissions. 2022 Emissions have
changed by 7.5% (74721.66 Gg CO2 /
year). 1990-2022 Emissions have changed by 2.2% (11076.25 Gg CO2 / year). For 2022
the changes per gas
are:
For 1990-2022 the changes per gas are: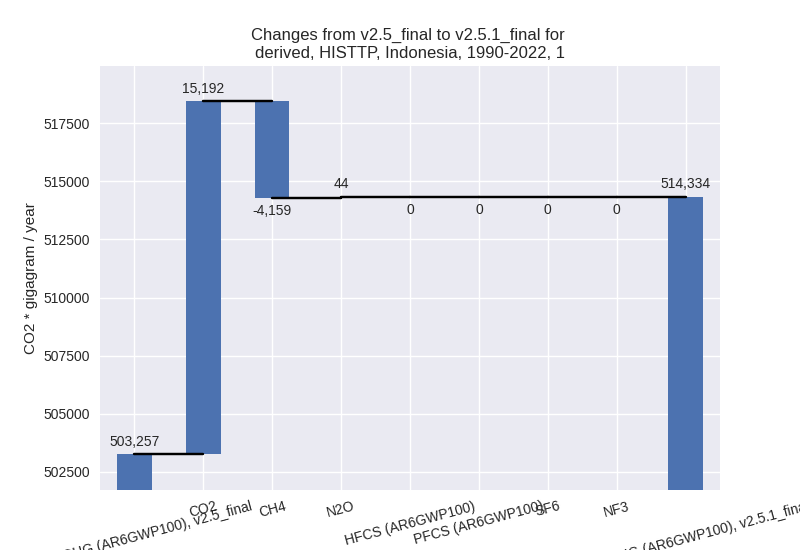
The changes come from the following subsectors:- 1.A: Total sectoral emissions in 2022 are 843353.80
Gg CO2 / year which is 78.8% of category 1 emissions. 2022 Emissions
have changed by 17.9% (128325.49 Gg
CO2 / year). 1990-2022 Emissions have changed by 4.2% (15626.63 Gg CO2 / year). For 2022
the changes per gas
are:

For 1990-2022 the changes per gas are: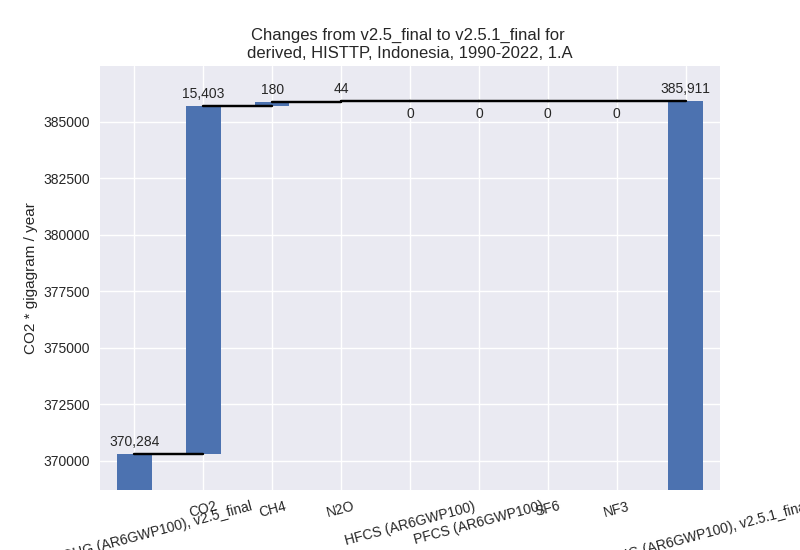
There is no subsector information available in PRIMAP-hist. - 1.B.1: Total sectoral emissions in 2022 are
190088.38 Gg CO2 / year which is 17.8% of category 1 emissions. 2022
Emissions have changed by -20.7%
(-49584.51 Gg CO2 / year). 1990-2022 Emissions have changed by -4.9% (-3516.00 Gg CO2 / year). For 2022
the changes per gas
are:
For 1990-2022 the changes per gas are: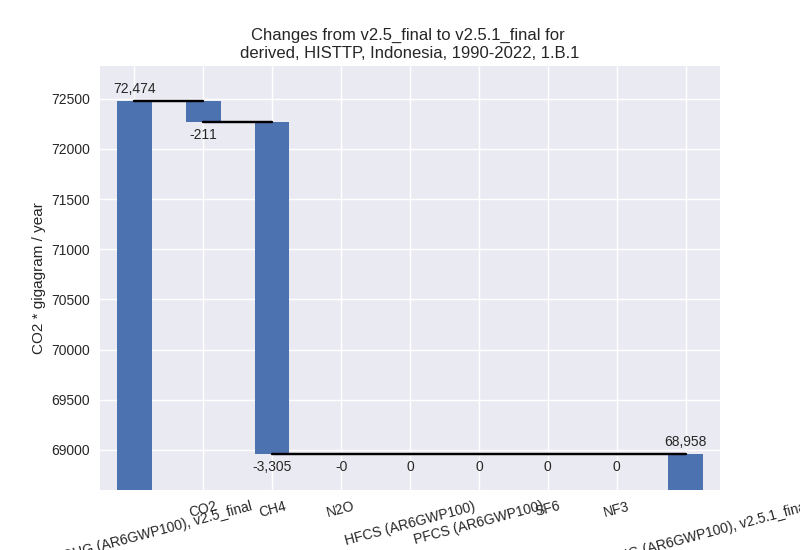
There is no subsector information available in PRIMAP-hist. - 1.B.2: Total sectoral emissions in 2022 are
36968.66 Gg CO2 / year which is 3.5% of category 1 emissions. 2022
Emissions have changed by -9.8%
(-4019.28 Gg CO2 / year). 1990-2022 Emissions have changed by -1.7% (-1034.38 Gg CO2 / year). For 2022
the changes per gas
are:

There is no subsector information available in PRIMAP-hist.
- 1.A: Total sectoral emissions in 2022 are 843353.80
Gg CO2 / year which is 78.8% of category 1 emissions. 2022 Emissions
have changed by 17.9% (128325.49 Gg
CO2 / year). 1990-2022 Emissions have changed by 4.2% (15626.63 Gg CO2 / year). For 2022
the changes per gas
are:
- 2: Total sectoral emissions in 2022 are 66142.49 Gg
CO2 / year which is 4.7% of M.0.EL emissions. 2022 Emissions have
changed by 0.2% (150.68 Gg CO2 /
year). 1990-2022 Emissions have changed by -3.2% (-1315.36 Gg CO2 / year). For
1990-2022 the changes per gas
are:
- M.AG: Total sectoral emissions in 2022 are
167463.53 Gg CO2 / year which is 12.0% of M.0.EL emissions. 2022
Emissions have changed by -12.0%
(-22930.66 Gg CO2 / year). 1990-2022 Emissions have changed by -12.0% (-19534.29 Gg CO2 / year). For 2022
the changes per gas
are:
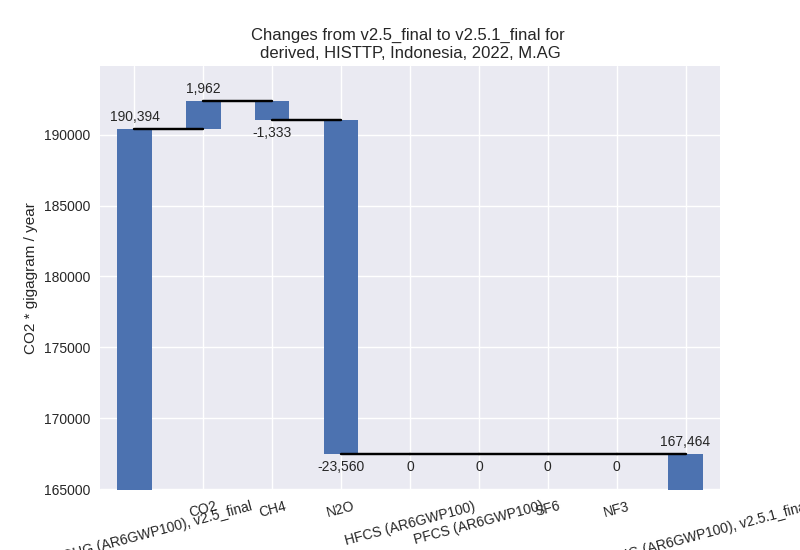
For 1990-2022 the changes per gas are: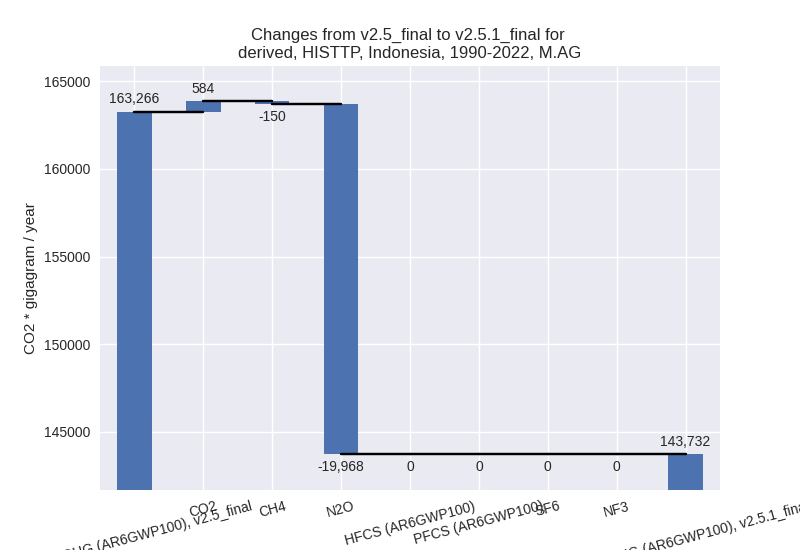
The changes come from the following subsectors:- 3.A: Total sectoral emissions in 2022 are 42275.48 Gg CO2 / year which is 25.2% of category M.AG emissions. 2022 Emissions have changed by -0.3% (-112.71 Gg CO2 / year). 1990-2022 Emissions have changed by -0.1% (-29.76 Gg CO2 / year).
- M.AG.ELV: Total sectoral emissions in 2022 are
125188.05 Gg CO2 / year which is 74.8% of category M.AG emissions. 2022
Emissions have changed by -15.4%
(-22817.94 Gg CO2 / year). 1990-2022 Emissions have changed by -14.8% (-19504.53 Gg CO2 / year). For 2022
the changes per gas
are:

For 1990-2022 the changes per gas are:
There is no subsector information available in PRIMAP-hist.
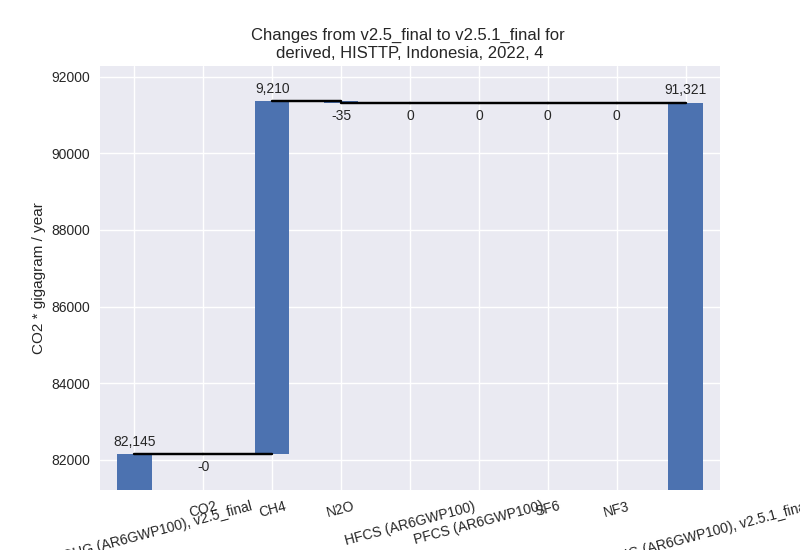
- 4: Total sectoral emissions in 2022 are 91320.63 Gg
CO2 / year which is 6.5% of M.0.EL emissions. 2022 Emissions have
changed by 11.2% (9175.19 Gg CO2 /
year). 1990-2022 Emissions have changed by 0.5% (278.04 Gg CO2 / year). For 2022 the
changes per gas
are:
- 5: Total sectoral emissions in 2022 are 5250.65 Gg
CO2 / year which is 0.4% of M.0.EL emissions. 2022 Emissions have
changed by 9.9% (474.37 Gg CO2 /
year). 1990-2022 Emissions have changed by 0.4% (14.37 Gg CO2 / year). For 2022 the
changes per gas
are: