Changes in PRIMAP-hist v2.5.1_final compared to v2.5_final for Ireland
2024-02-29
Johannes Gütschow
Change analysis for Ireland for PRIMAP-hist v2.5.1_final compared to v2.5_final
Overview over emissions by sector and gas
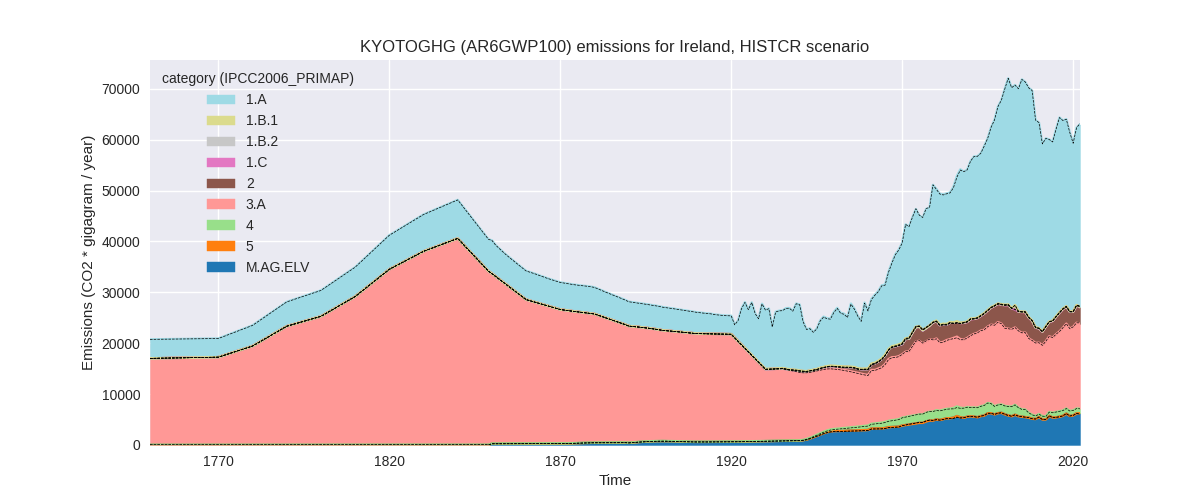
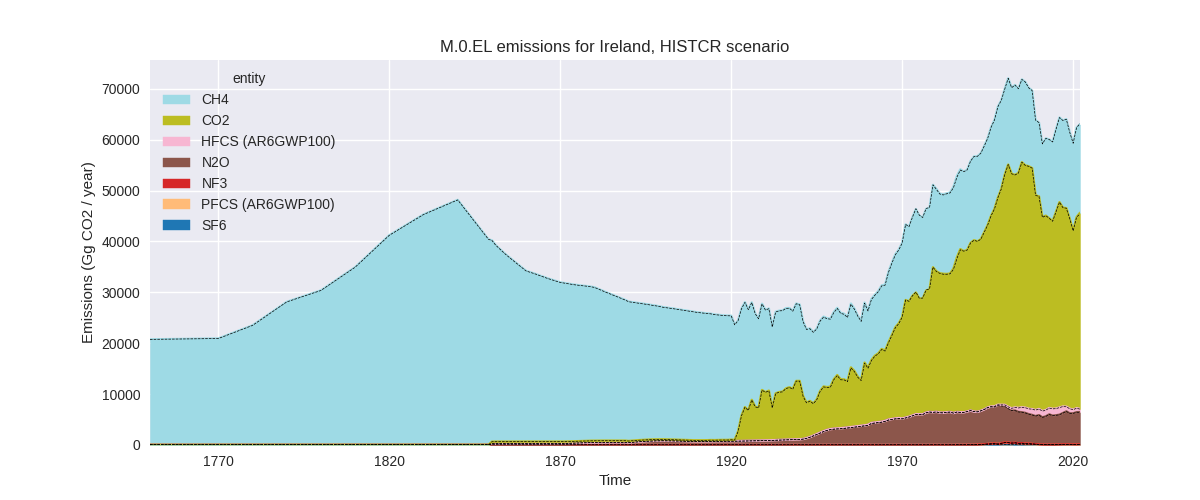
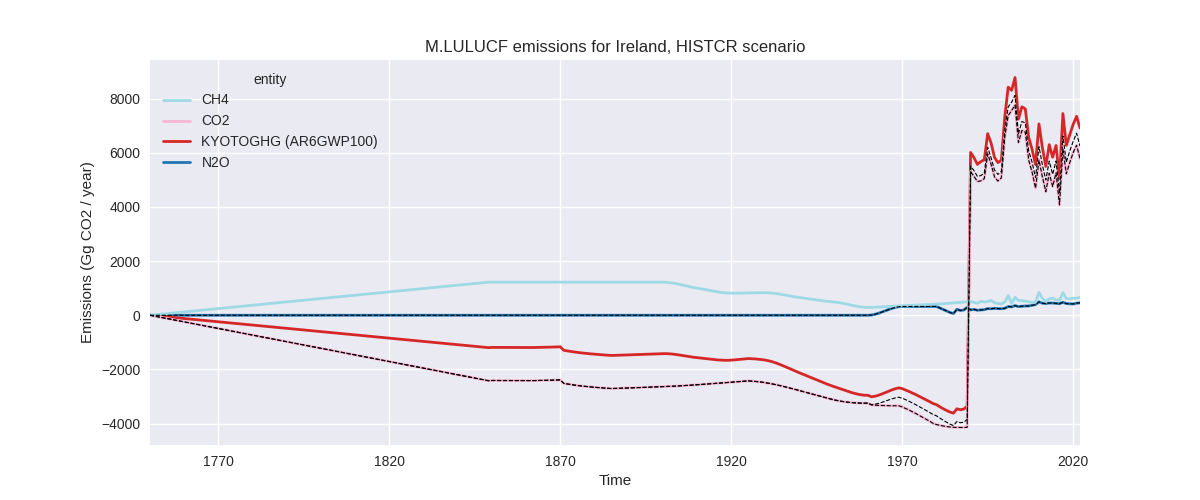
The following figures show the aggregate national total emissions excluding LULUCF AR6GWP100 for the country reported priority scenario. The dotted linesshow the v2.5_final data.
The following figures show the aggregate national total emissions excluding LULUCF AR6GWP100 for the third party priority scenario. The dotted linesshow the v2.5_final data.


Overview over changes
In the country reported priority scenario we have the following changes for aggregate Kyoto GHG and national total emissions excluding LULUCF (M.0.EL):
- Emissions in 2022 have changed by -0.3%% (-161.70 Gg CO2 / year)
- Emissions in 1990-2022 have changed by -0.0%% (-4.90 Gg CO2 / year)
In the third party priority scenario we have the following changes for aggregate Kyoto GHG and national total emissions excluding LULUCF (M.0.EL):
- Emissions in 2022 have changed by -1.0%% (-662.82 Gg CO2 / year)
- Emissions in 1990-2022 have changed by -2.1%% (-1462.99 Gg CO2 / year)
Most important changes per scenario and time frame
In the country reported priority scenario the following sector-gas combinations have the highest absolute impact on national total KyotoGHG (AR6GWP100) emissions in 2022 (top 5):
- 1: 3.A, CH4 with -193.54 Gg CO2 / year (-1.2%)
- 2: 4, CH4 with -178.21 Gg CO2 / year (-19.2%)
- 3: M.AG.ELV, CO2 with 153.32 Gg CO2 / year (27.0%)
- 4: M.AG.ELV, N2O with 25.05 Gg CO2 / year (0.5%)
- 5: 1.A, N2O with 21.94 Gg CO2 / year (7.2%)
In the country reported priority scenario the following sector-gas combinations have the highest absolute impact on national total KyotoGHG (AR6GWP100) emissions in 1990-2022 (top 5):
- 1: 3.A, CH4 with -5.86 Gg CO2 / year (-0.0%)
- 2: 4, CH4 with -5.40 Gg CO2 / year (-0.5%)
- 3: M.AG.ELV, CO2 with 4.65 Gg CO2 / year (1.0%)
- 4: M.AG.ELV, N2O with 0.76 Gg CO2 / year (0.0%)
- 5: 1.A, N2O with 0.66 Gg CO2 / year (0.2%)
In the third party priority scenario the following sector-gas combinations have the highest absolute impact on national total KyotoGHG (AR6GWP100) emissions in 2022 (top 5):
- 1: 1.B.2, CH4 with -1945.20 Gg CO2 / year (-74.3%)
- 2: 1.A, CO2 with 1838.98 Gg CO2 / year (5.7%)
- 3: M.AG.ELV, CO2 with -371.38 Gg CO2 / year (-68.3%)
- 4: M.AG.ELV, N2O with 320.62 Gg CO2 / year (4.5%)
- 5: 3.A, CH4 with -295.12 Gg CO2 / year (-1.8%)
In the third party priority scenario the following sector-gas combinations have the highest absolute impact on national total KyotoGHG (AR6GWP100) emissions in 1990-2022 (top 5):
- 1: 1.B.2, CH4 with -1346.76 Gg CO2 / year (-66.1%)
- 2: M.AG.ELV, CO2 with -329.48 Gg CO2 / year (-73.9%)
- 3: M.AG.ELV, N2O with 324.02 Gg CO2 / year (4.5%)
- 4: 2, CO2 with -276.37 Gg CO2 / year (-12.0%)
- 5: 1.A, CO2 with 157.60 Gg CO2 / year (0.4%)
Notes on data changes
Here we list notes explaining important emissions changes for the country. ’' means that the following text only applies to the TP time series, while means that it only applies to the CR scenario. Otherwise the note applies to both scenarios.
- 1.A, CO2: CDIAC 2023 data show a smaller emissions reduction in 2020 than EI 2023 data leading to higher 2022 emissions in PRIMAP-hist.
- 1.B.2, CH4: EDGAR 8.0 emissions are much lower for all years than EDGAR 7.0 emissions.
Changes by sector and gas
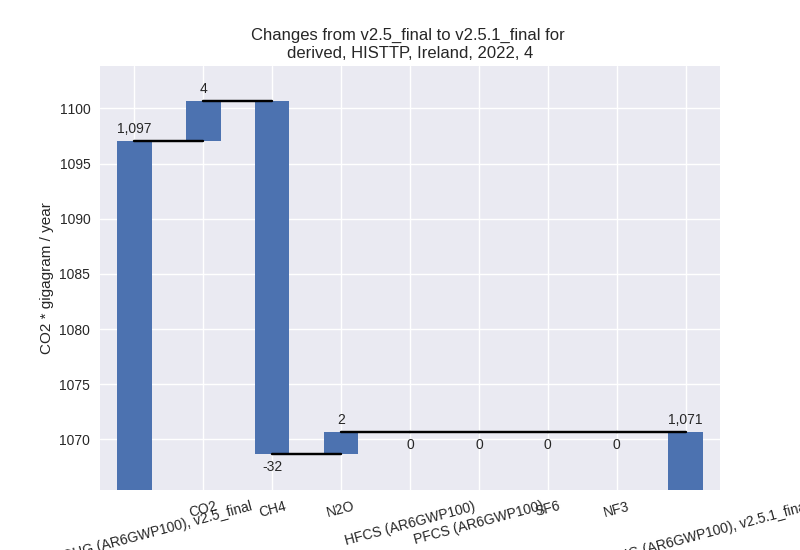
For each scenario and time frame the changes are displayed for all individual sectors and all individual gases. In the sector plot we use aggregate Kyoto GHGs in AR6GWP100. In the gas plot we usenational total emissions without LULUCF. ## country reported scenario
2022
1990-2022


third party scenario
2022
1990-2022


Detailed changes for the scenarios:
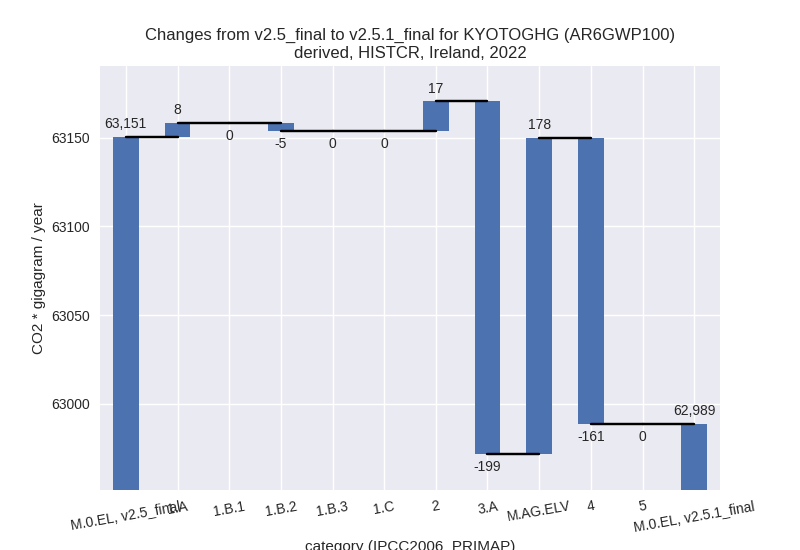
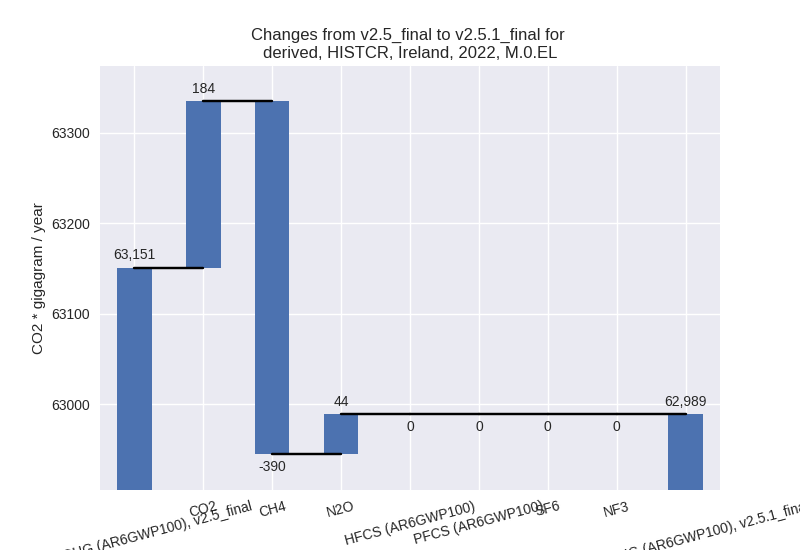
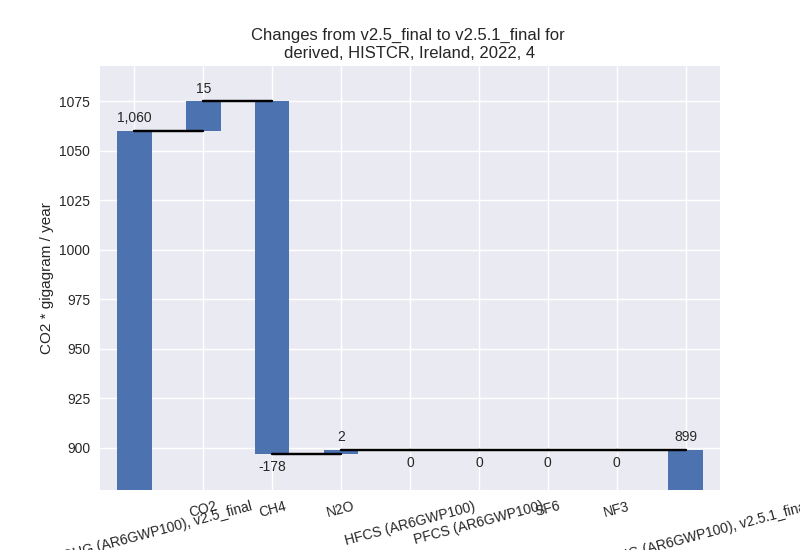
country reported scenario (HISTCR):
Most important changes per time frame
For 2022 the following sector-gas combinations have the highest absolute impact on national total KyotoGHG (AR6GWP100) emissions in 2022 (top 5):
- 1: 3.A, CH4 with -193.54 Gg CO2 / year (-1.2%)
- 2: 4, CH4 with -178.21 Gg CO2 / year (-19.2%)
- 3: M.AG.ELV, CO2 with 153.32 Gg CO2 / year (27.0%)
- 4: M.AG.ELV, N2O with 25.05 Gg CO2 / year (0.5%)
- 5: 1.A, N2O with 21.94 Gg CO2 / year (7.2%)
For 1990-2022 the following sector-gas combinations have the highest absolute impact on national total KyotoGHG (AR6GWP100) emissions in 1990-2022 (top 5):
- 1: 3.A, CH4 with -5.86 Gg CO2 / year (-0.0%)
- 2: 4, CH4 with -5.40 Gg CO2 / year (-0.5%)
- 3: M.AG.ELV, CO2 with 4.65 Gg CO2 / year (1.0%)
- 4: M.AG.ELV, N2O with 0.76 Gg CO2 / year (0.0%)
- 5: 1.A, N2O with 0.66 Gg CO2 / year (0.2%)
Changes in the main sectors for aggregate KyotoGHG (AR6GWP100) are
- 1: Total sectoral emissions in 2022 are 35944.15 Gg CO2 / year which is 57.1% of M.0.EL emissions. 2022 Emissions have changed by 0.0% (2.98 Gg CO2 / year). 1990-2022 Emissions have changed by 0.0% (0.09 Gg CO2 / year).
- 2: Total sectoral emissions in 2022 are 3229.53 Gg CO2 / year which is 5.1% of M.0.EL emissions. 2022 Emissions have changed by 0.5% (16.97 Gg CO2 / year). 1990-2022 Emissions have changed by 0.0% (0.51 Gg CO2 / year).
- M.AG: Total sectoral emissions in 2022 are 22916.29 Gg CO2 / year which is 36.4% of M.0.EL emissions. 2022 Emissions have changed by -0.1% (-20.39 Gg CO2 / year). 1990-2022 Emissions have changed by -0.0% (-0.62 Gg CO2 / year).
- 4: Total sectoral emissions in 2022 are 898.85 Gg
CO2 / year which is 1.4% of M.0.EL emissions. 2022 Emissions have
changed by -15.2% (-161.26 Gg CO2 /
year). 1990-2022 Emissions have changed by -0.4% (-4.89 Gg CO2 / year). For 2022 the
changes per gas
are:
- 5: No data
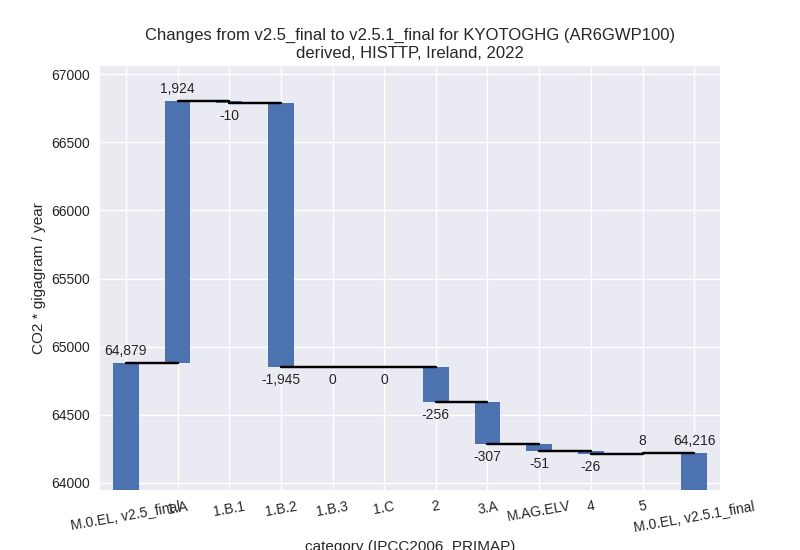
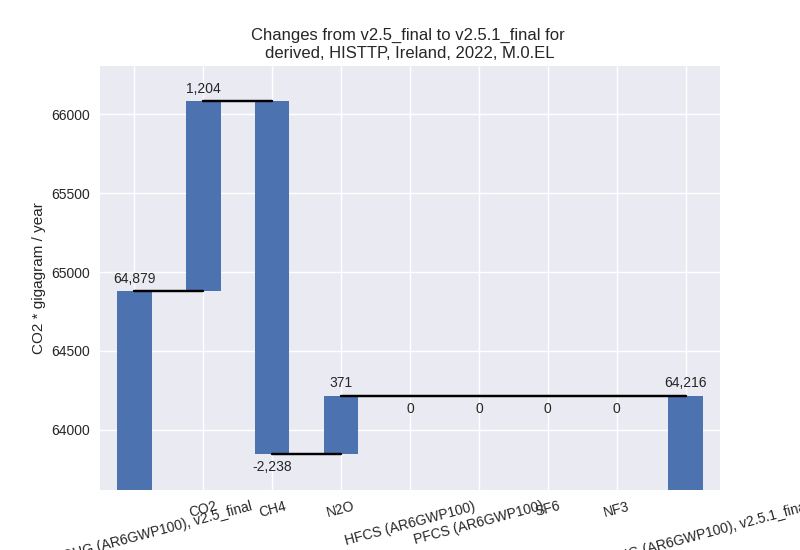
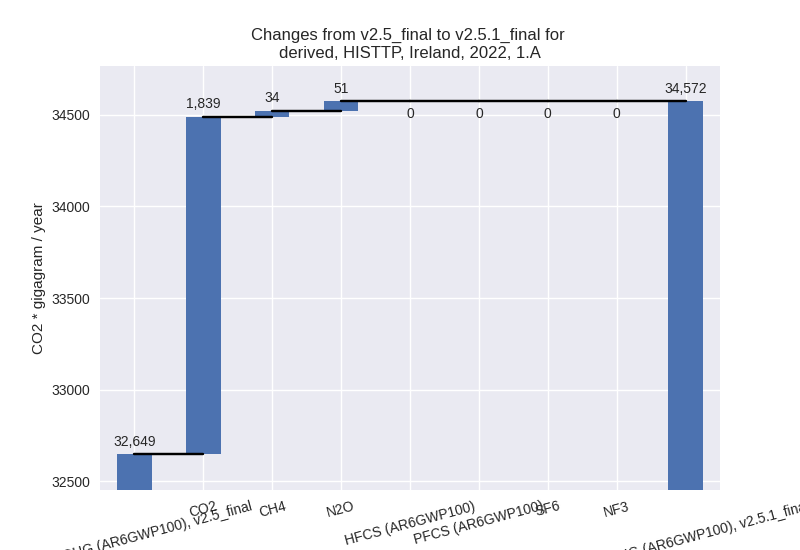
third party scenario (HISTTP):
Most important changes per time frame
For 2022 the following sector-gas combinations have the highest absolute impact on national total KyotoGHG (AR6GWP100) emissions in 2022 (top 5):
- 1: 1.B.2, CH4 with -1945.20 Gg CO2 / year (-74.3%)
- 2: 1.A, CO2 with 1838.98 Gg CO2 / year (5.7%)
- 3: M.AG.ELV, CO2 with -371.38 Gg CO2 / year (-68.3%)
- 4: M.AG.ELV, N2O with 320.62 Gg CO2 / year (4.5%)
- 5: 3.A, CH4 with -295.12 Gg CO2 / year (-1.8%)
For 1990-2022 the following sector-gas combinations have the highest absolute impact on national total KyotoGHG (AR6GWP100) emissions in 1990-2022 (top 5):
- 1: 1.B.2, CH4 with -1346.76 Gg CO2 / year (-66.1%)
- 2: M.AG.ELV, CO2 with -329.48 Gg CO2 / year (-73.9%)
- 3: M.AG.ELV, N2O with 324.02 Gg CO2 / year (4.5%)
- 4: 2, CO2 with -276.37 Gg CO2 / year (-12.0%)
- 5: 1.A, CO2 with 157.60 Gg CO2 / year (0.4%)
Changes in the main sectors for aggregate KyotoGHG (AR6GWP100) are
- 1: Total sectoral emissions in 2022 are 35267.73 Gg
CO2 / year which is 54.9% of M.0.EL emissions. 2022 Emissions have
changed by -0.1% (-31.21 Gg CO2 /
year). 1990-2022 Emissions have changed by -3.1% (-1183.92 Gg CO2 / year). For
1990-2022 the changes per gas
are:

The changes come from the following subsectors:- 1.A: Total sectoral emissions in 2022 are 34572.26
Gg CO2 / year which is 98.0% of category 1 emissions. 2022 Emissions
have changed by 5.9% (1923.61 Gg CO2
/ year). 1990-2022 Emissions have changed by 0.4% (163.58 Gg CO2 / year). For 2022 the
changes per gas
are:
There is no subsector information available in PRIMAP-hist. - 1.B.1: Total sectoral emissions in 2022 are 21.28
Gg CO2 / year which is 0.1% of category 1 emissions. 2022 Emissions have
changed by -31.1% (-9.62 Gg CO2 /
year). 1990-2022 Emissions have changed by -1.1% (-0.73 Gg CO2 / year). For 2022 the
changes per gas
are:

There is no subsector information available in PRIMAP-hist. - 1.B.2: Total sectoral emissions in 2022 are 674.19
Gg CO2 / year which is 1.9% of category 1 emissions. 2022 Emissions have
changed by -74.3% (-1945.20 Gg CO2 /
year). 1990-2022 Emissions have changed by -66.1% (-1346.76 Gg CO2 / year). For 2022
the changes per gas
are:
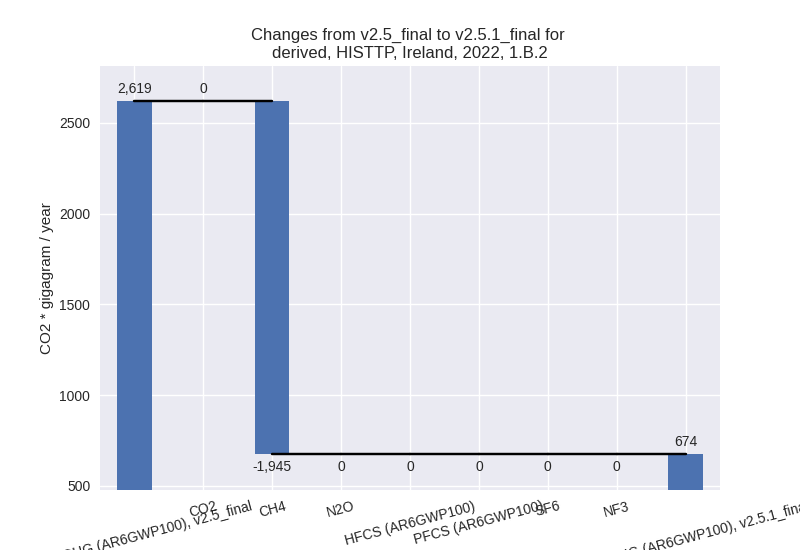
For 1990-2022 the changes per gas are:
There is no subsector information available in PRIMAP-hist.
- 1.A: Total sectoral emissions in 2022 are 34572.26
Gg CO2 / year which is 98.0% of category 1 emissions. 2022 Emissions
have changed by 5.9% (1923.61 Gg CO2
/ year). 1990-2022 Emissions have changed by 0.4% (163.58 Gg CO2 / year). For 2022 the
changes per gas
are:
- 2: Total sectoral emissions in 2022 are 3008.76 Gg
CO2 / year which is 4.7% of M.0.EL emissions. 2022 Emissions have
changed by -7.8% (-255.61 Gg CO2 /
year). 1990-2022 Emissions have changed by -7.9% (-276.12 Gg CO2 / year). For 2022
the changes per gas
are:

For 1990-2022 the changes per gas are: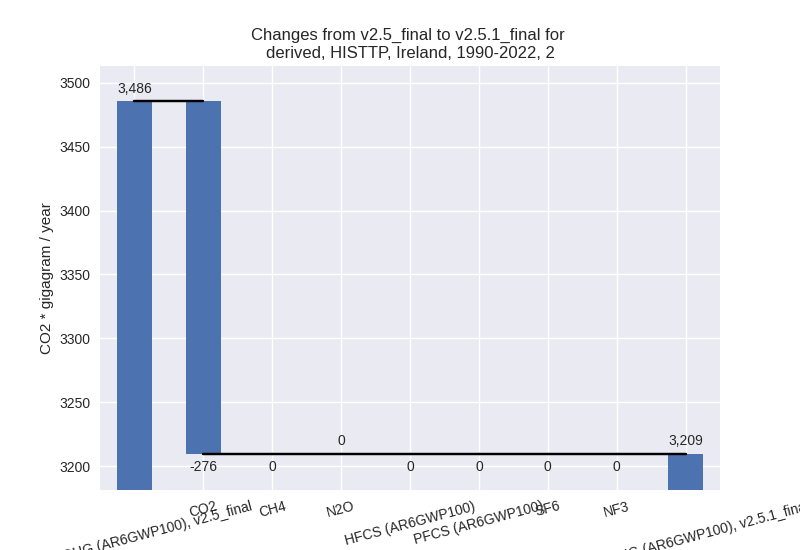
- M.AG: Total sectoral emissions in 2022 are 24806.94 Gg CO2 / year which is 38.6% of M.0.EL emissions. 2022 Emissions have changed by -1.4% (-357.21 Gg CO2 / year). 1990-2022 Emissions have changed by -0.0% (-2.38 Gg CO2 / year).
- 4: Total sectoral emissions in 2022 are 1070.67 Gg
CO2 / year which is 1.7% of M.0.EL emissions. 2022 Emissions have
changed by -2.4% (-26.36 Gg CO2 /
year). 1990-2022 Emissions have changed by -0.0% (-0.80 Gg CO2 / year). For 2022 the
changes per gas
are:
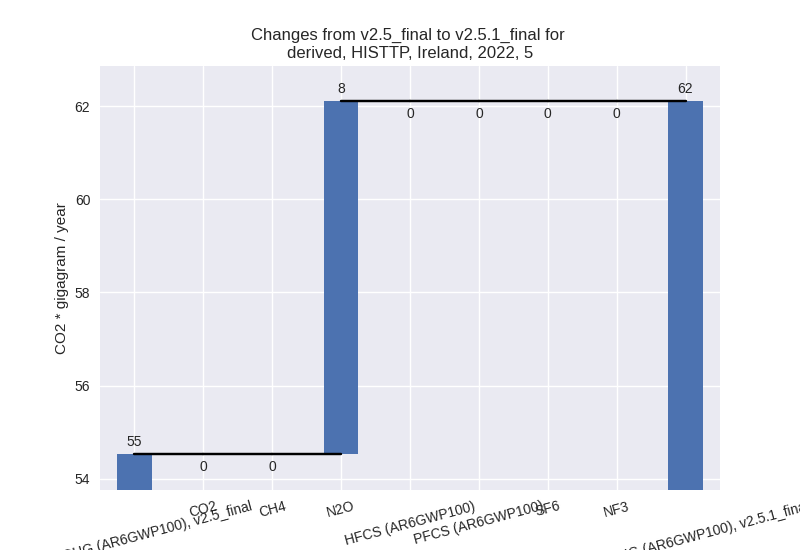
- 5: Total sectoral emissions in 2022 are 62.10 Gg
CO2 / year which is 0.1% of M.0.EL emissions. 2022 Emissions have
changed by 13.9% (7.58 Gg CO2 /
year). 1990-2022 Emissions have changed by 0.2% (0.23 Gg CO2 / year). For 2022 the
changes per gas
are: