Changes in PRIMAP-hist v2.5.1_final compared to v2.5_final for Iran, Islamic Republic of
2024-02-29
Johannes Gütschow
Change analysis for Iran, Islamic Republic of for PRIMAP-hist v2.5.1_final compared to v2.5_final
Overview over emissions by sector and gas
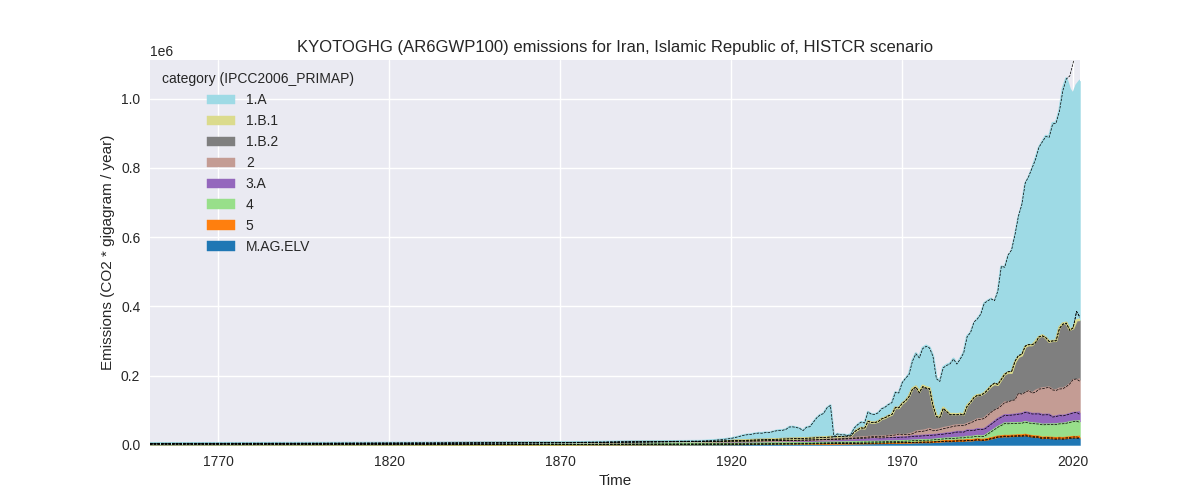
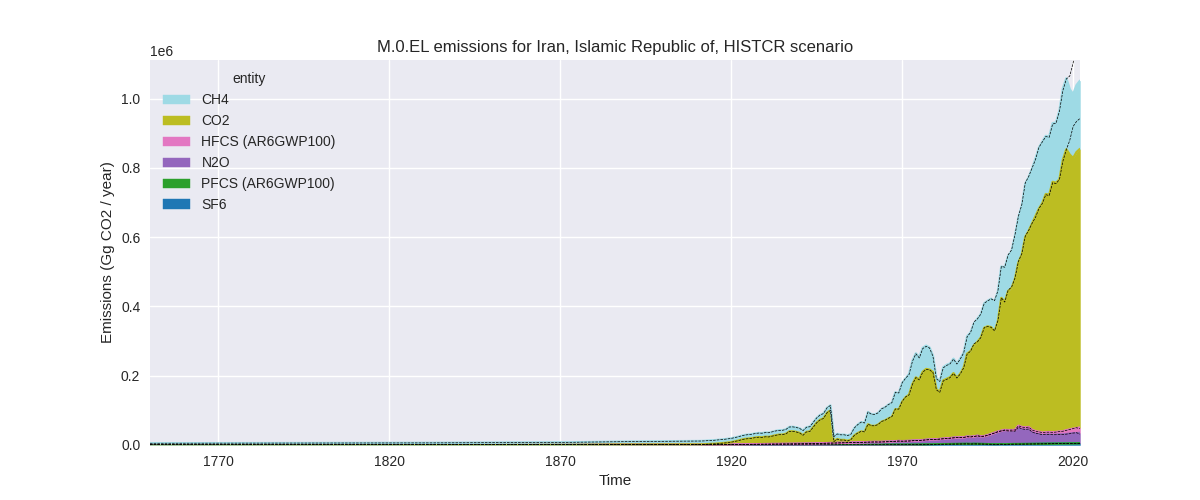
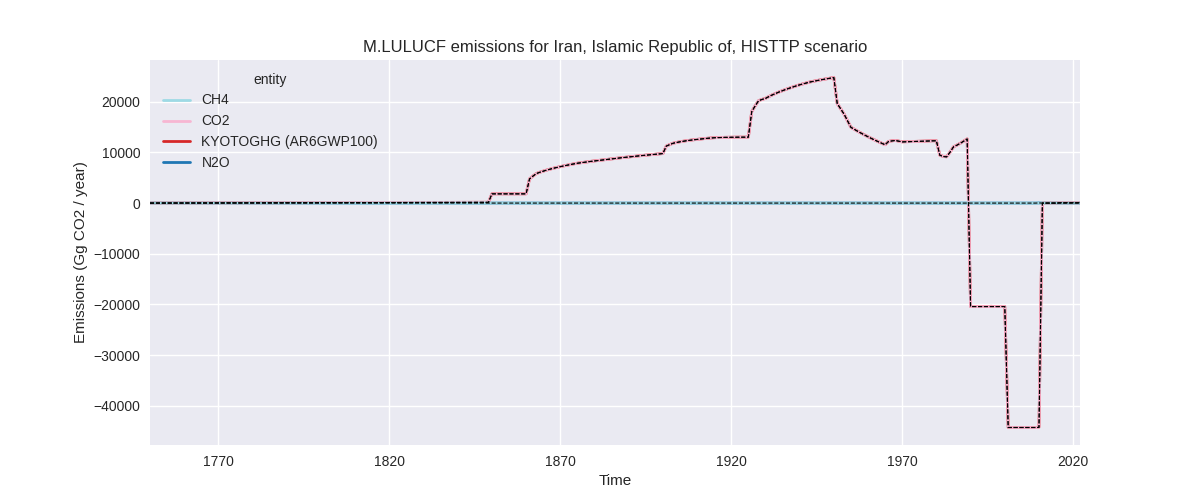
The following figures show the aggregate national total emissions excluding LULUCF AR6GWP100 for the country reported priority scenario. The dotted linesshow the v2.5_final data.

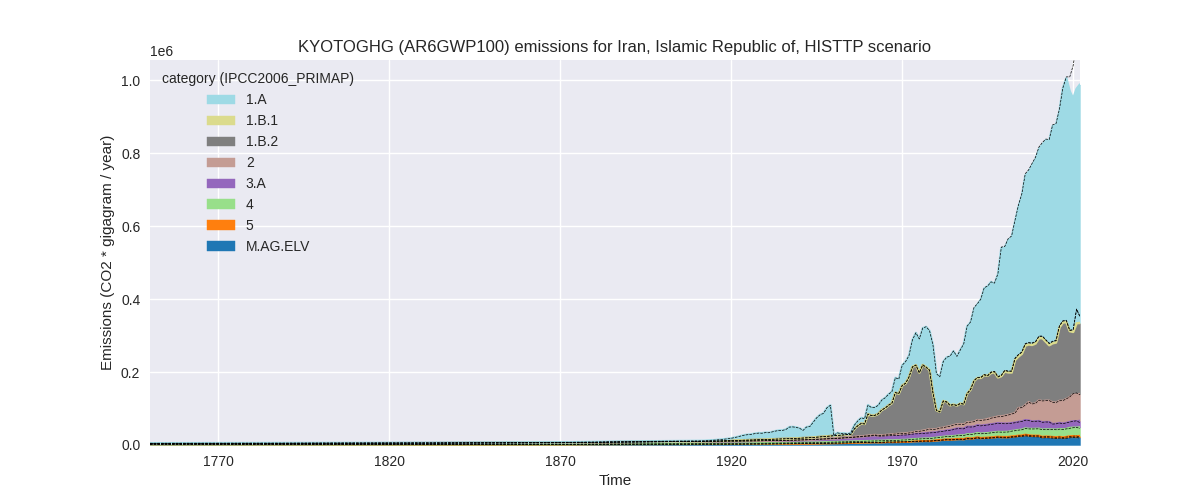
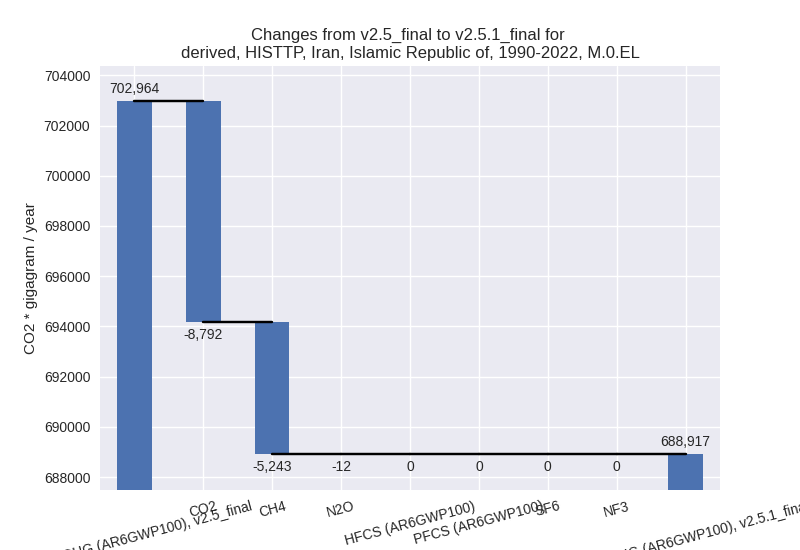
The following figures show the aggregate national total emissions excluding LULUCF AR6GWP100 for the third party priority scenario. The dotted linesshow the v2.5_final data.

Overview over changes
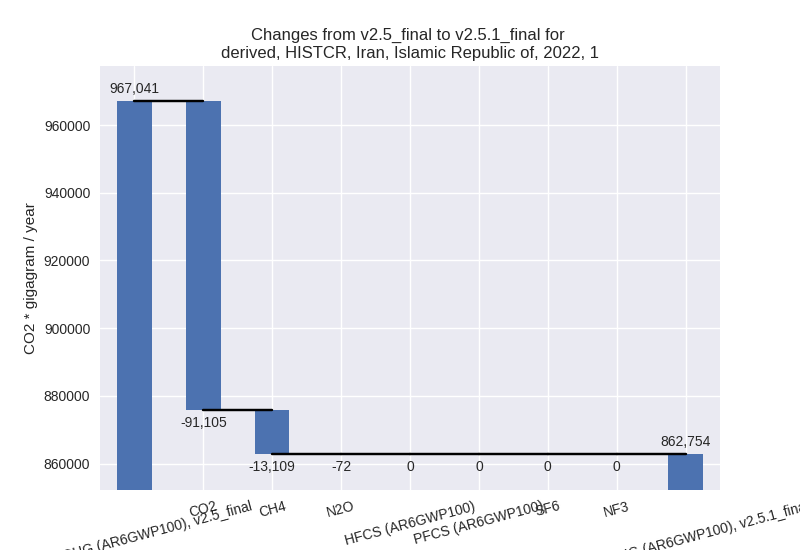
In the country reported priority scenario we have the following changes for aggregate Kyoto GHG and national total emissions excluding LULUCF (M.0.EL):
- Emissions in 2022 have changed by -8.6%% (-98790.80 Gg CO2 / year)
- Emissions in 1990-2022 have changed by -1.5%% (-10812.87 Gg CO2 / year)
In the third party priority scenario we have the following changes for aggregate Kyoto GHG and national total emissions excluding LULUCF (M.0.EL):
- Emissions in 2022 have changed by -9.5%% (-104047.10 Gg CO2 / year)
- Emissions in 1990-2022 have changed by -2.0%% (-14047.12 Gg CO2 / year)
Most important changes per scenario and time frame
In the country reported priority scenario the following sector-gas combinations have the highest absolute impact on national total KyotoGHG (AR6GWP100) emissions in 2022 (top 5):
- 1: 1.A, CO2 with -91016.61 Gg CO2 / year (-11.7%)
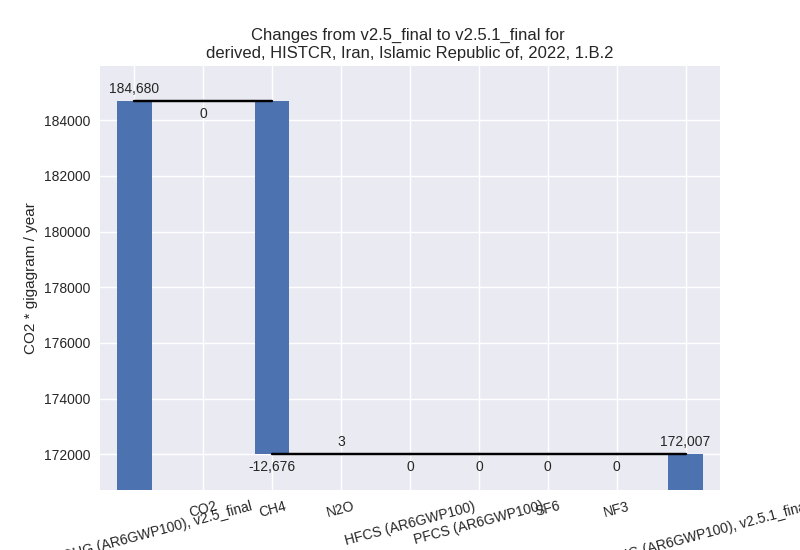
- 2: 1.B.2, CH4 with -12675.94 Gg CO2 / year (-9.2%)
- 3: M.AG.ELV, N2O with 2739.18 Gg CO2 / year (19.7%)
- 4: 3.A, CH4 with 2722.81 Gg CO2 / year (14.4%)
- 5: 2, CO2 with -728.42 Gg CO2 / year (-1.0%)
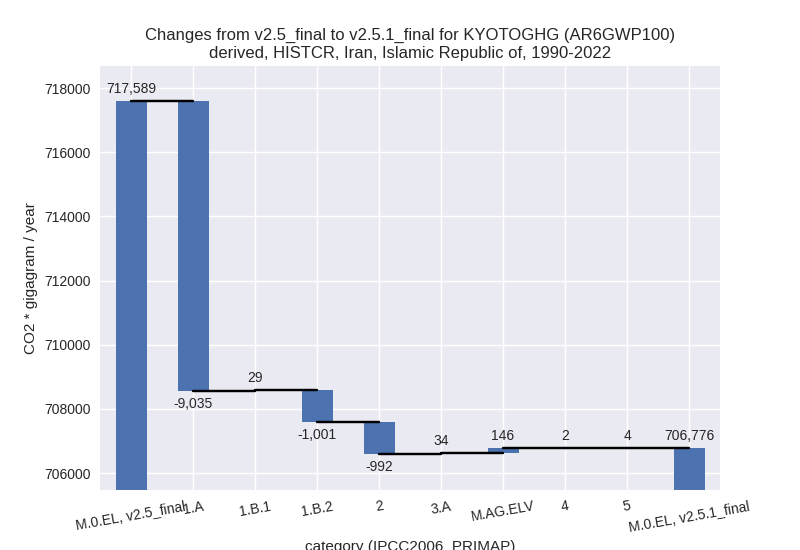
In the country reported priority scenario the following sector-gas combinations have the highest absolute impact on national total KyotoGHG (AR6GWP100) emissions in 1990-2022 (top 5):
- 1: 1.A, CO2 with -9002.34 Gg CO2 / year (-2.0%)
- 2: 1.B.2, CH4 with -1001.10 Gg CO2 / year (-1.2%)
- 3: 2, CO2 with -973.14 Gg CO2 / year (-2.2%)
- 4: M.AG.ELV, CO2 with 77.90 Gg CO2 / year (5.5%)
- 5: M.AG.ELV, N2O with 44.05 Gg CO2 / year (0.3%)
In the third party priority scenario the following sector-gas combinations have the highest absolute impact on national total KyotoGHG (AR6GWP100) emissions in 2022 (top 5):
- 1: 1.A, CO2 with -85475.59 Gg CO2 / year (-11.7%)
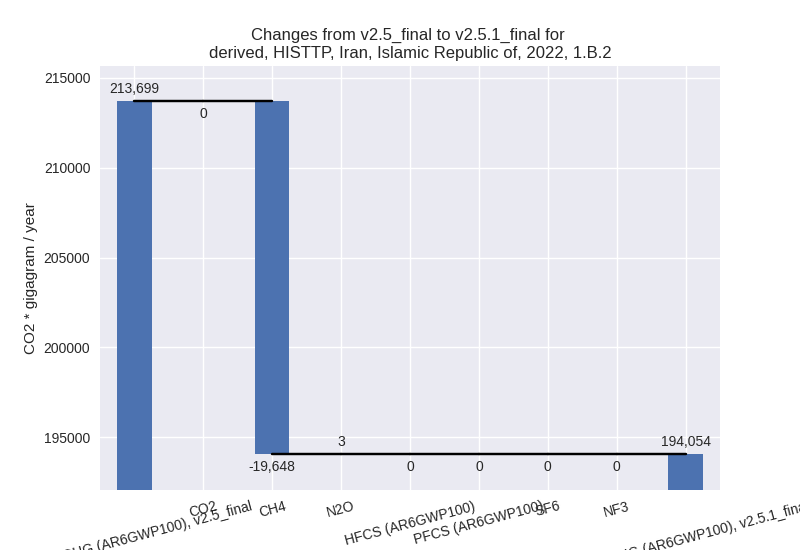
- 2: 1.B.2, CH4 with -19648.47 Gg CO2 / year (-11.1%)
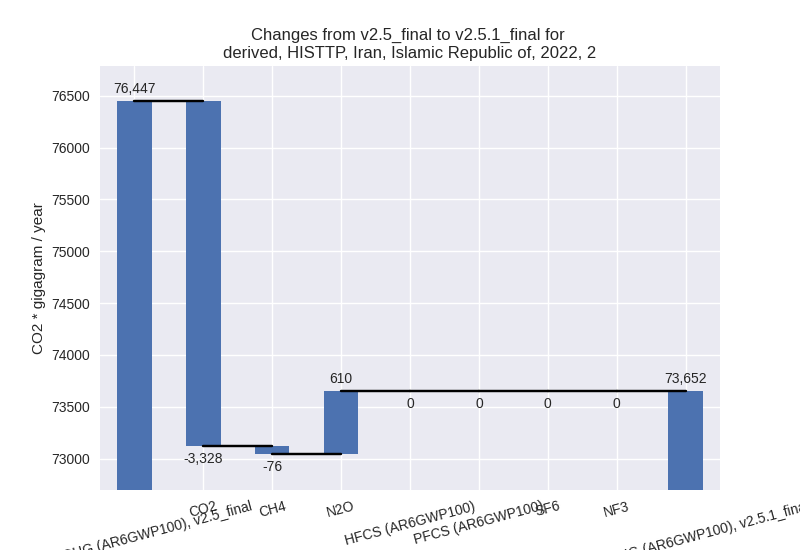
- 3: 2, CO2 with -3327.58 Gg CO2 / year (-6.4%)
- 4: 3.A, CH4 with 2433.31 Gg CO2 / year (16.6%)
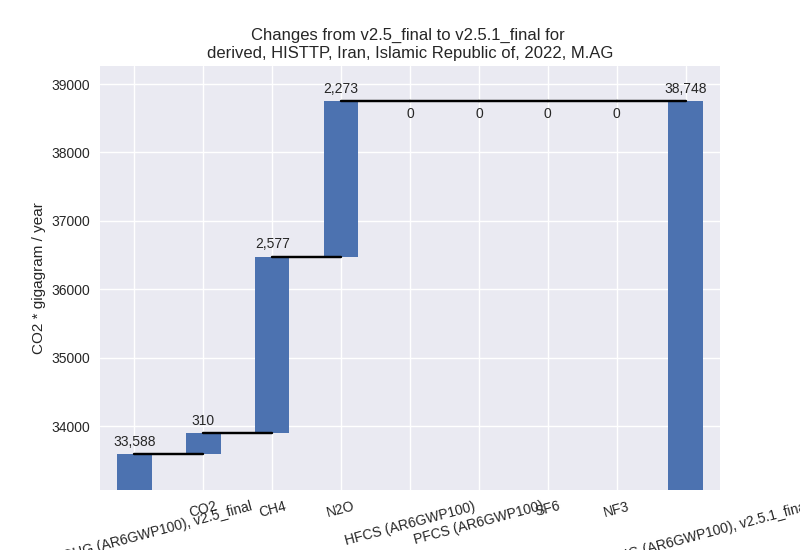
- 5: M.AG.ELV, N2O with 2248.10 Gg CO2 / year (16.2%)
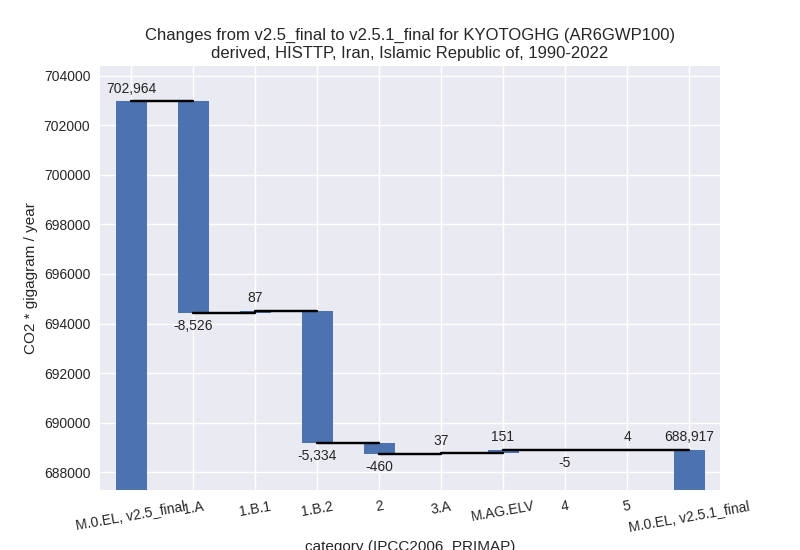
In the third party priority scenario the following sector-gas combinations have the highest absolute impact on national total KyotoGHG (AR6GWP100) emissions in 1990-2022 (top 5):
- 1: 1.A, CO2 with -8450.52 Gg CO2 / year (-1.9%)
- 2: 1.B.2, CH4 with -5334.33 Gg CO2 / year (-4.2%)
- 3: 2, CO2 with -453.32 Gg CO2 / year (-1.6%)
- 4: M.AG.ELV, CO2 with 77.90 Gg CO2 / year (5.5%)
- 5: 1.B.1, CH4 with 53.19 Gg CO2 / year (9.2%)
Notes on data changes
Here we list notes explaining important emissions changes for the country. ’' means that the following text only applies to the TP time series, while means that it only applies to the CR scenario. Otherwise the note applies to both scenarios.
- 1.A, CO2: CDIAC 2023 data show a decline in emissions for 2019 and 2020. This decline is not present in the EI data used for these years in PRIMAP-hist v2.5. Thus 2022 emissions ar elower in PRIMAP-hist v2.5.1.
- 1.B.2, CH4: EDGAR 7.0 emissions showed a steep increase for 2021 while EDGAR 8.0 only shows a slight increase. This leads to lower 2022 emission in PRIMAP-hist.
Changes by sector and gas
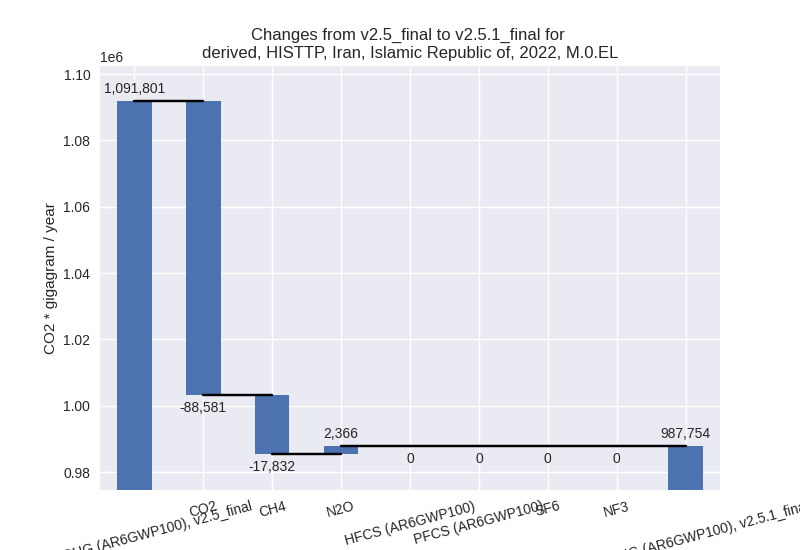
For each scenario and time frame the changes are displayed for all individual sectors and all individual gases. In the sector plot we use aggregate Kyoto GHGs in AR6GWP100. In the gas plot we usenational total emissions without LULUCF. ## country reported scenario
2022


1990-2022

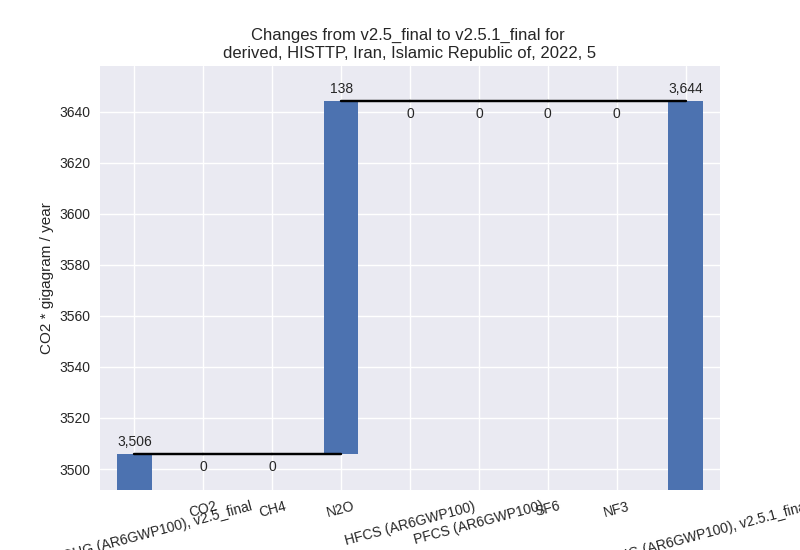
third party scenario
2022

1990-2022
Detailed changes for the scenarios:
country reported scenario (HISTCR):
Most important changes per time frame
For 2022 the following sector-gas combinations have the highest absolute impact on national total KyotoGHG (AR6GWP100) emissions in 2022 (top 5):
- 1: 1.A, CO2 with -91016.61 Gg CO2 / year (-11.7%)
- 2: 1.B.2, CH4 with -12675.94 Gg CO2 / year (-9.2%)
- 3: M.AG.ELV, N2O with 2739.18 Gg CO2 / year (19.7%)
- 4: 3.A, CH4 with 2722.81 Gg CO2 / year (14.4%)
- 5: 2, CO2 with -728.42 Gg CO2 / year (-1.0%)
For 1990-2022 the following sector-gas combinations have the highest absolute impact on national total KyotoGHG (AR6GWP100) emissions in 1990-2022 (top 5):
- 1: 1.A, CO2 with -9002.34 Gg CO2 / year (-2.0%)
- 2: 1.B.2, CH4 with -1001.10 Gg CO2 / year (-1.2%)
- 3: 2, CO2 with -973.14 Gg CO2 / year (-2.2%)
- 4: M.AG.ELV, CO2 with 77.90 Gg CO2 / year (5.5%)
- 5: M.AG.ELV, N2O with 44.05 Gg CO2 / year (0.3%)
Changes in the main sectors for aggregate KyotoGHG (AR6GWP100) are
- 1: Total sectoral emissions in 2022 are 862754.18
Gg CO2 / year which is 82.0% of M.0.EL emissions. 2022 Emissions have
changed by -10.8% (-104286.52 Gg CO2
/ year). 1990-2022 Emissions have changed by -1.7% (-10006.74 Gg CO2 / year). For 2022
the changes per gas
are:
The changes come from the following subsectors:- 1.A: Total sectoral emissions in 2022 are 690163.18
Gg CO2 / year which is 80.0% of category 1 emissions. 2022 Emissions
have changed by -11.7% (-91497.07 Gg
CO2 / year). 1990-2022 Emissions have changed by -2.0% (-9034.94 Gg CO2 / year). For 2022
the changes per gas
are:

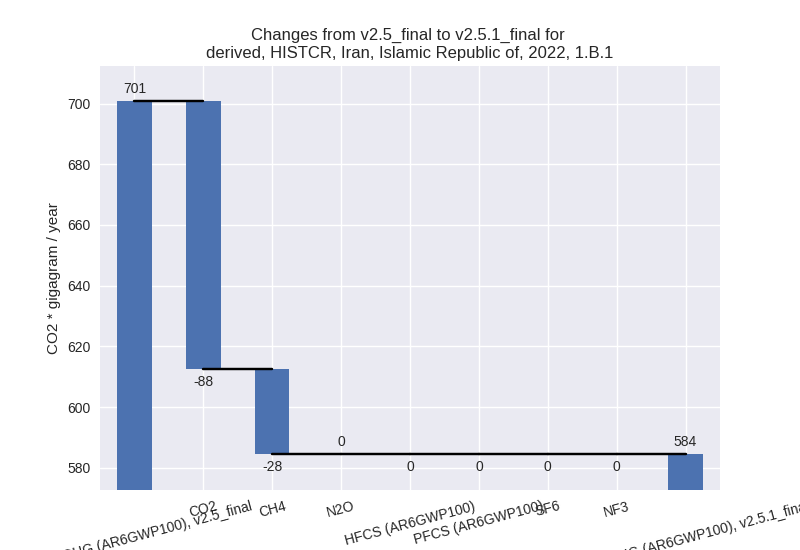
There is no subsector information available in PRIMAP-hist. - 1.B.1: Total sectoral emissions in 2022 are 584.47
Gg CO2 / year which is 0.1% of category 1 emissions. 2022 Emissions have
changed by -16.6% (-116.27 Gg CO2 /
year). 1990-2022 Emissions have changed by 3.4% (29.47 Gg CO2 / year). For 2022 the
changes per gas
are:
For 1990-2022 the changes per gas are:
There is no subsector information available in PRIMAP-hist. - 1.B.2: Total sectoral emissions in 2022 are
172006.52 Gg CO2 / year which is 19.9% of category 1 emissions. 2022
Emissions have changed by -6.9%
(-12673.20 Gg CO2 / year). 1990-2022 Emissions have changed by -0.8% (-1001.27 Gg CO2 / year). For 2022
the changes per gas
are:
There is no subsector information available in PRIMAP-hist.
- 1.A: Total sectoral emissions in 2022 are 690163.18
Gg CO2 / year which is 80.0% of category 1 emissions. 2022 Emissions
have changed by -11.7% (-91497.07 Gg
CO2 / year). 1990-2022 Emissions have changed by -2.0% (-9034.94 Gg CO2 / year). For 2022
the changes per gas
are:
- 2: Total sectoral emissions in 2022 are 94864.07 Gg CO2 / year which is 9.0% of M.0.EL emissions. 2022 Emissions have changed by -0.6% (-543.71 Gg CO2 / year). 1990-2022 Emissions have changed by -1.7% (-991.88 Gg CO2 / year).
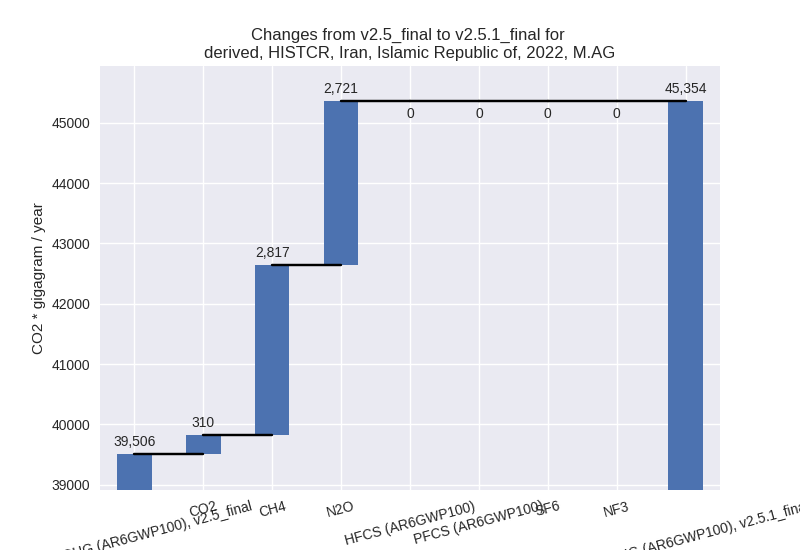
- M.AG: Total sectoral emissions in 2022 are 45354.22
Gg CO2 / year which is 4.3% of M.0.EL emissions. 2022 Emissions have
changed by 14.8% (5847.84 Gg CO2 /
year). 1990-2022 Emissions have changed by 0.4% (179.95 Gg CO2 / year). For 2022 the
changes per gas
are:
The changes come from the following subsectors:- 3.A: Total sectoral emissions in 2022 are 25436.68
Gg CO2 / year which is 56.1% of category M.AG emissions. 2022 Emissions
have changed by 11.9% (2704.18 Gg
CO2 / year). 1990-2022 Emissions have changed by 0.1% (33.68 Gg CO2 / year). For 2022 the
changes per gas
are:

There is no subsector information available in PRIMAP-hist. - M.AG.ELV: Total sectoral emissions in 2022 are
19917.54 Gg CO2 / year which is 43.9% of category M.AG emissions. 2022
Emissions have changed by 18.7%
(3143.66 Gg CO2 / year). 1990-2022 Emissions have changed by 0.8% (146.26 Gg CO2 / year). For 2022 the
changes per gas
are:

There is no subsector information available in PRIMAP-hist.
- 3.A: Total sectoral emissions in 2022 are 25436.68
Gg CO2 / year which is 56.1% of category M.AG emissions. 2022 Emissions
have changed by 11.9% (2704.18 Gg
CO2 / year). 1990-2022 Emissions have changed by 0.1% (33.68 Gg CO2 / year). For 2022 the
changes per gas
are:
- 4: Total sectoral emissions in 2022 are 45057.13 Gg CO2 / year which is 4.3% of M.0.EL emissions. 2022 Emissions have changed by 0.1% (53.26 Gg CO2 / year). 1990-2022 Emissions have changed by 0.0% (1.61 Gg CO2 / year).
- 5: Total sectoral emissions in 2022 are 3644.12 Gg
CO2 / year which is 0.3% of M.0.EL emissions. 2022 Emissions have
changed by 3.9% (138.32 Gg CO2 /
year). 1990-2022 Emissions have changed by 0.2% (4.19 Gg CO2 / year). For 2022 the
changes per gas
are:

third party scenario (HISTTP):
Most important changes per time frame
For 2022 the following sector-gas combinations have the highest absolute impact on national total KyotoGHG (AR6GWP100) emissions in 2022 (top 5):
- 1: 1.A, CO2 with -85475.59 Gg CO2 / year (-11.7%)
- 2: 1.B.2, CH4 with -19648.47 Gg CO2 / year (-11.1%)
- 3: 2, CO2 with -3327.58 Gg CO2 / year (-6.4%)
- 4: 3.A, CH4 with 2433.31 Gg CO2 / year (16.6%)
- 5: M.AG.ELV, N2O with 2248.10 Gg CO2 / year (16.2%)
For 1990-2022 the following sector-gas combinations have the highest absolute impact on national total KyotoGHG (AR6GWP100) emissions in 1990-2022 (top 5):
- 1: 1.A, CO2 with -8450.52 Gg CO2 / year (-1.9%)
- 2: 1.B.2, CH4 with -5334.33 Gg CO2 / year (-4.2%)
- 3: 2, CO2 with -453.32 Gg CO2 / year (-1.6%)
- 4: M.AG.ELV, CO2 with 77.90 Gg CO2 / year (5.5%)
- 5: 1.B.1, CH4 with 53.19 Gg CO2 / year (9.2%)
Changes in the main sectors for aggregate KyotoGHG (AR6GWP100) are
- 1: Total sectoral emissions in 2022 are 848008.42
Gg CO2 / year which is 85.9% of M.0.EL emissions. 2022 Emissions have
changed by -11.1% (-106390.99 Gg CO2
/ year). 1990-2022 Emissions have changed by -2.3% (-13774.07 Gg CO2 / year). For 2022
the changes per gas
are:
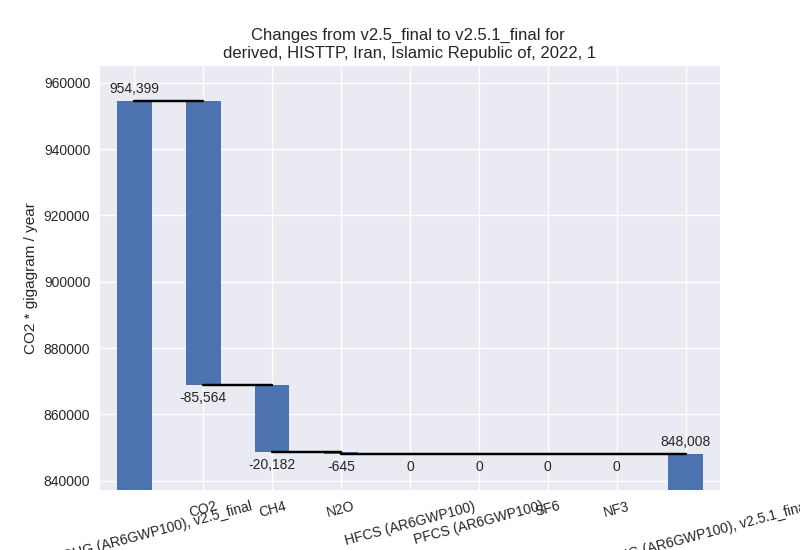
For 1990-2022 the changes per gas are:
The changes come from the following subsectors:- 1.A: Total sectoral emissions in 2022 are 653167.60
Gg CO2 / year which is 77.0% of category 1 emissions. 2022 Emissions
have changed by -11.7% (-86723.13 Gg
CO2 / year). 1990-2022 Emissions have changed by -1.9% (-8526.47 Gg CO2 / year). For 2022
the changes per gas
are:

There is no subsector information available in PRIMAP-hist. - 1.B.1: Total sectoral emissions in 2022 are 787.27
Gg CO2 / year which is 0.1% of category 1 emissions. 2022 Emissions have
changed by -2.7% (-22.13 Gg CO2 /
year). 1990-2022 Emissions have changed by 8.3% (86.89 Gg CO2 / year). For 2022 the
changes per gas
are:

For 1990-2022 the changes per gas are: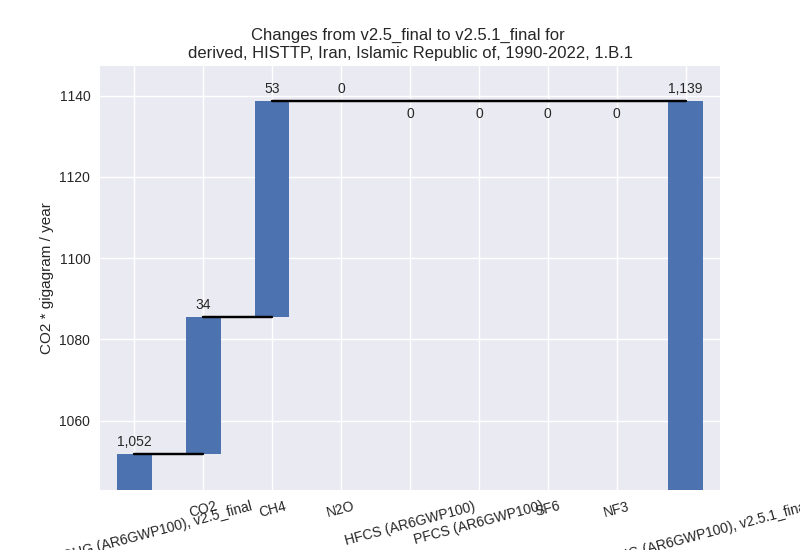
There is no subsector information available in PRIMAP-hist. - 1.B.2: Total sectoral emissions in 2022 are
194053.56 Gg CO2 / year which is 22.9% of category 1 emissions. 2022
Emissions have changed by -9.2%
(-19645.73 Gg CO2 / year). 1990-2022 Emissions have changed by -3.5% (-5334.49 Gg CO2 / year). For 2022
the changes per gas
are:
For 1990-2022 the changes per gas are: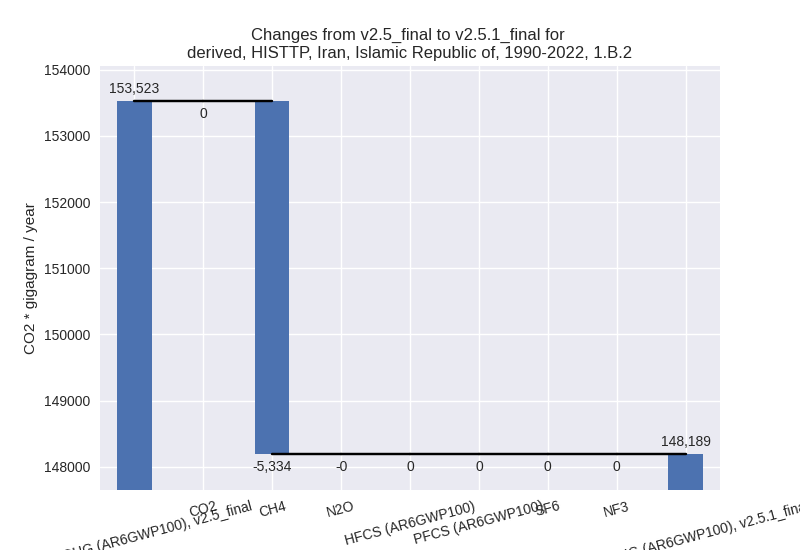
There is no subsector information available in PRIMAP-hist.
- 1.A: Total sectoral emissions in 2022 are 653167.60
Gg CO2 / year which is 77.0% of category 1 emissions. 2022 Emissions
have changed by -11.7% (-86723.13 Gg
CO2 / year). 1990-2022 Emissions have changed by -1.9% (-8526.47 Gg CO2 / year). For 2022
the changes per gas
are:
- 2: Total sectoral emissions in 2022 are 73652.25 Gg
CO2 / year which is 7.5% of M.0.EL emissions. 2022 Emissions have
changed by -3.7% (-2794.25 Gg CO2 /
year). 1990-2022 Emissions have changed by -1.1% (-460.20 Gg CO2 / year). For 2022
the changes per gas
are:
- M.AG: Total sectoral emissions in 2022 are 38747.85
Gg CO2 / year which is 3.9% of M.0.EL emissions. 2022 Emissions have
changed by 15.4% (5159.82 Gg CO2 /
year). 1990-2022 Emissions have changed by 0.5% (187.80 Gg CO2 / year). For 2022 the
changes per gas
are:
The changes come from the following subsectors:- 3.A: Total sectoral emissions in 2022 are 17809.55
Gg CO2 / year which is 46.0% of category M.AG emissions. 2022 Emissions
have changed by 16.0% (2458.13 Gg
CO2 / year). 1990-2022 Emissions have changed by 0.2% (36.97 Gg CO2 / year). For 2022 the
changes per gas
are:

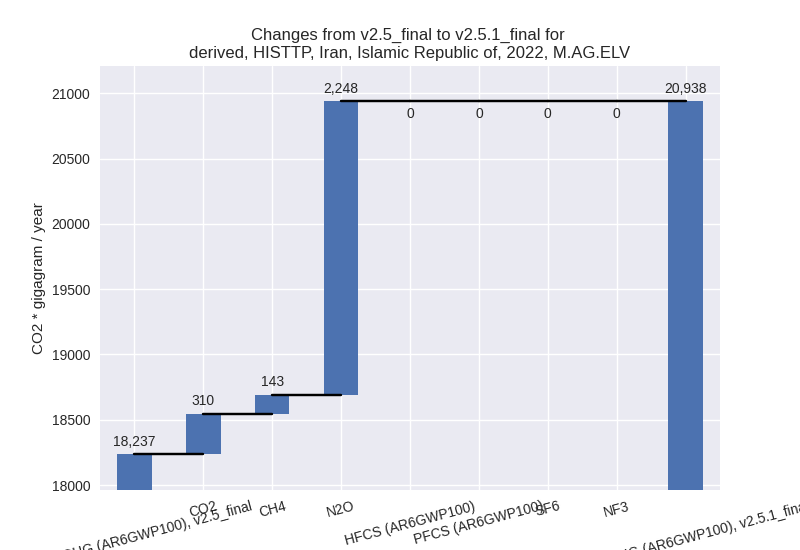
There is no subsector information available in PRIMAP-hist. - M.AG.ELV: Total sectoral emissions in 2022 are
20938.29 Gg CO2 / year which is 54.0% of category M.AG emissions. 2022
Emissions have changed by 14.8%
(2701.69 Gg CO2 / year). 1990-2022 Emissions have changed by 0.8% (150.83 Gg CO2 / year). For 2022 the
changes per gas
are:
There is no subsector information available in PRIMAP-hist.
- 3.A: Total sectoral emissions in 2022 are 17809.55
Gg CO2 / year which is 46.0% of category M.AG emissions. 2022 Emissions
have changed by 16.0% (2458.13 Gg
CO2 / year). 1990-2022 Emissions have changed by 0.2% (36.97 Gg CO2 / year). For 2022 the
changes per gas
are:
- 4: Total sectoral emissions in 2022 are 23701.05 Gg CO2 / year which is 2.4% of M.0.EL emissions. 2022 Emissions have changed by -0.7% (-160.01 Gg CO2 / year). 1990-2022 Emissions have changed by -0.0% (-4.85 Gg CO2 / year).
- 5: Total sectoral emissions in 2022 are 3644.12 Gg
CO2 / year which is 0.4% of M.0.EL emissions. 2022 Emissions have
changed by 3.9% (138.32 Gg CO2 /
year). 1990-2022 Emissions have changed by 0.2% (4.19 Gg CO2 / year). For 2022 the
changes per gas
are: