Changes in PRIMAP-hist v2.5.1_final compared to v2.5_final for Iraq
2024-02-29
Johannes Gütschow
Change analysis for Iraq for PRIMAP-hist v2.5.1_final compared to v2.5_final
Overview over emissions by sector and gas
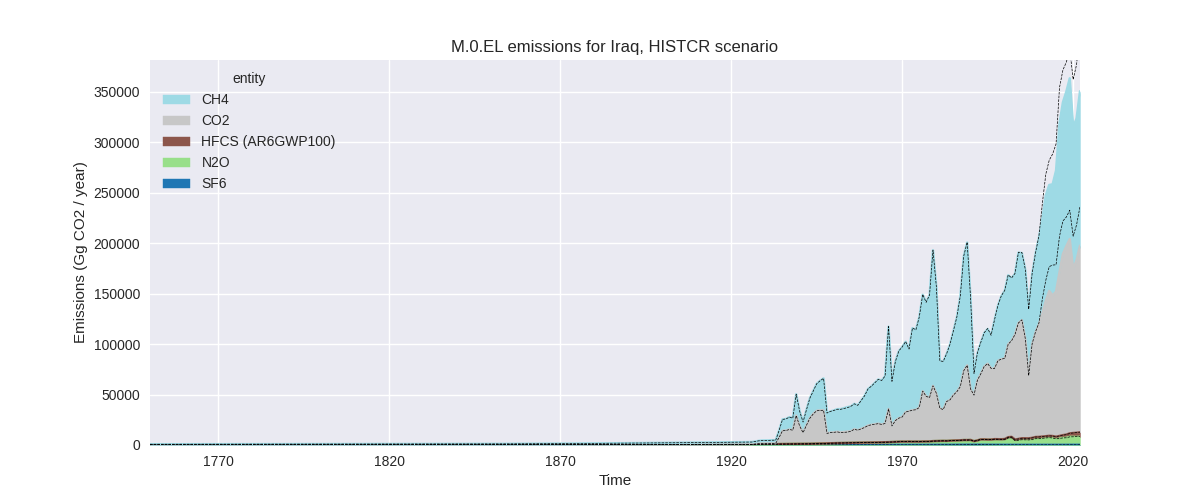
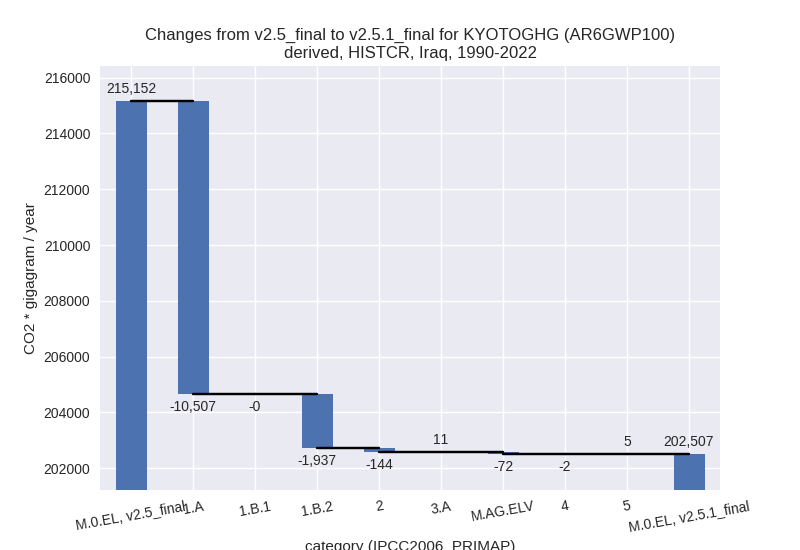
The following figures show the aggregate national total emissions excluding LULUCF AR6GWP100 for the country reported priority scenario. The dotted linesshow the v2.5_final data.


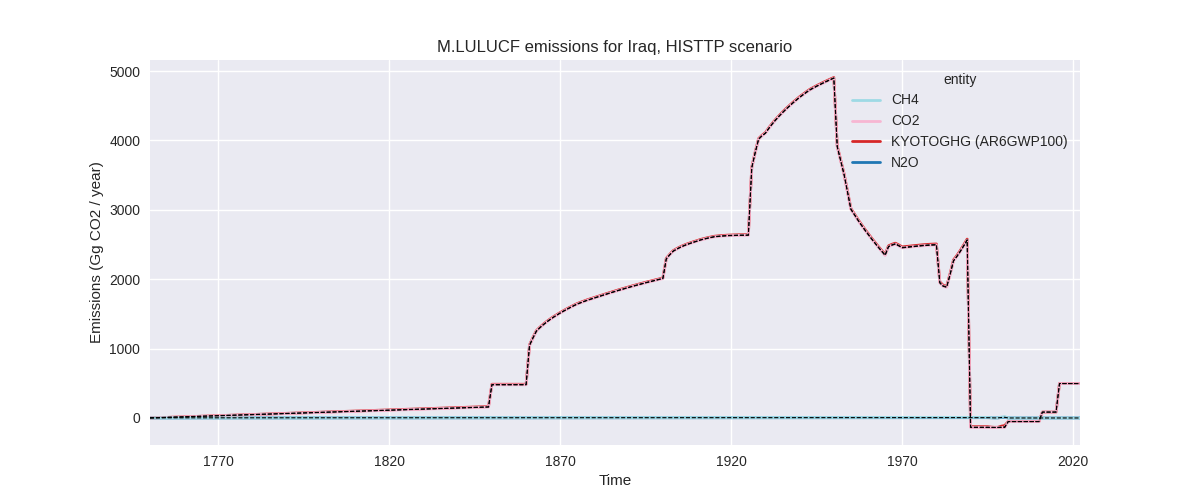
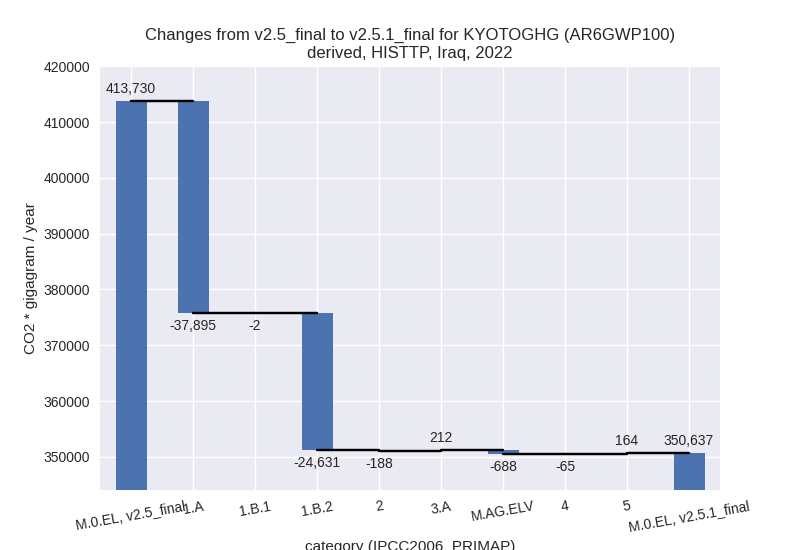
The following figures show the aggregate national total emissions excluding LULUCF AR6GWP100 for the third party priority scenario. The dotted linesshow the v2.5_final data.


Overview over changes
In the country reported priority scenario we have the following changes for aggregate Kyoto GHG and national total emissions excluding LULUCF (M.0.EL):
- Emissions in 2022 have changed by -15.2%% (-63093.46 Gg CO2 / year)
- Emissions in 1990-2022 have changed by -5.9%% (-12645.42 Gg CO2 / year)
In the third party priority scenario we have the following changes for aggregate Kyoto GHG and national total emissions excluding LULUCF (M.0.EL):
- Emissions in 2022 have changed by -15.2%% (-63093.46 Gg CO2 / year)
- Emissions in 1990-2022 have changed by -5.9%% (-12645.42 Gg CO2 / year)
Most important changes per scenario and time frame
In the country reported priority scenario the following sector-gas combinations have the highest absolute impact on national total KyotoGHG (AR6GWP100) emissions in 2022 (top 5):
- 1: 1.A, CO2 with -37951.64 Gg CO2 / year (-21.5%)
- 2: 1.B.2, CH4 with -24606.69 Gg CO2 / year (-15.6%)
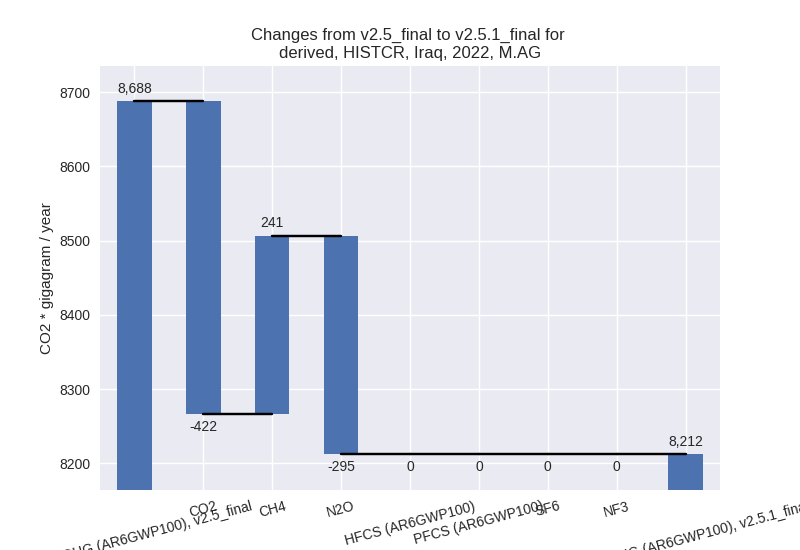
- 3: M.AG.ELV, CO2 with -421.53 Gg CO2 / year (-84.2%)
- 4: M.AG.ELV, N2O with -294.69 Gg CO2 / year (-8.2%)
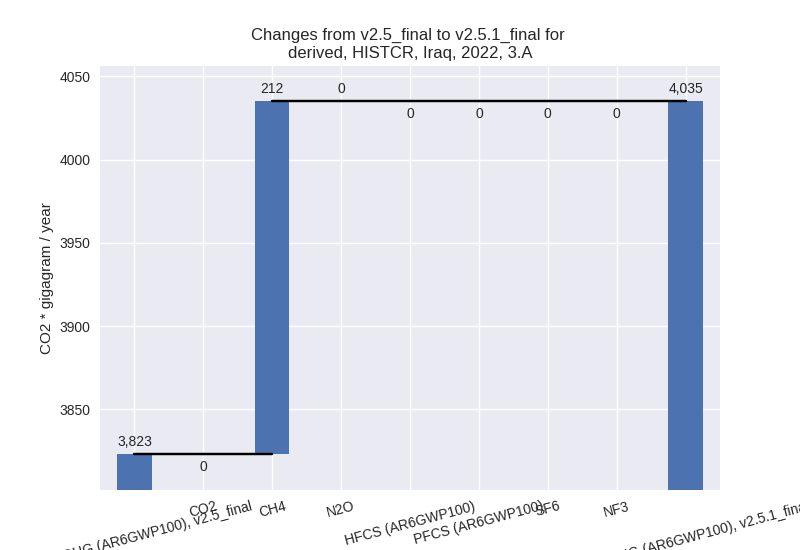
- 5: 3.A, CH4 with 211.95 Gg CO2 / year (5.6%)
In the country reported priority scenario the following sector-gas combinations have the highest absolute impact on national total KyotoGHG (AR6GWP100) emissions in 1990-2022 (top 5):
- 1: 1.A, CO2 with -10507.74 Gg CO2 / year (-10.4%)
- 2: 1.B.2, CH4 with -1936.19 Gg CO2 / year (-2.7%)
- 3: 2, CO2 with -143.97 Gg CO2 / year (-3.6%)
- 4: M.AG.ELV, CO2 with -51.25 Gg CO2 / year (-14.5%)
- 5: M.AG.ELV, N2O with -19.28 Gg CO2 / year (-0.6%)
In the third party priority scenario the following sector-gas combinations have the highest absolute impact on national total KyotoGHG (AR6GWP100) emissions in 2022 (top 5):
- 1: 1.A, CO2 with -37951.64 Gg CO2 / year (-21.5%)
- 2: 1.B.2, CH4 with -24606.69 Gg CO2 / year (-15.6%)
- 3: M.AG.ELV, CO2 with -421.53 Gg CO2 / year (-84.2%)
- 4: M.AG.ELV, N2O with -294.69 Gg CO2 / year (-8.2%)
- 5: 3.A, CH4 with 211.95 Gg CO2 / year (5.6%)
In the third party priority scenario the following sector-gas combinations have the highest absolute impact on national total KyotoGHG (AR6GWP100) emissions in 1990-2022 (top 5):
- 1: 1.A, CO2 with -10507.74 Gg CO2 / year (-10.4%)
- 2: 1.B.2, CH4 with -1936.19 Gg CO2 / year (-2.7%)
- 3: 2, CO2 with -143.97 Gg CO2 / year (-3.6%)
- 4: M.AG.ELV, CO2 with -51.25 Gg CO2 / year (-14.5%)
- 5: M.AG.ELV, N2O with -19.28 Gg CO2 / year (-0.6%)
Notes on data changes
Here we list notes explaining important emissions changes for the country. ’' means that the following text only applies to the TP time series, while means that it only applies to the CR scenario. Otherwise the note applies to both scenarios.
General note: We have no country reported data for Iraq, therefore the CR and TP time-series are identical except for LULUCF.
- 1.A, CO2: CDIAC 2023 emissions estimates are lower than in previous releases from 2010 onward leading to lower emissions in PRIMAP-hist.
- 1.B.2, CH4: EDGAR 8.0 emissions are lower than EDGAR 7.0 in 2020 and 2021 leading to lower 2022 emissions in PRIMAP-hist. Cumulative emissions are slightly lower due to the lower 2020-2022 emissions.
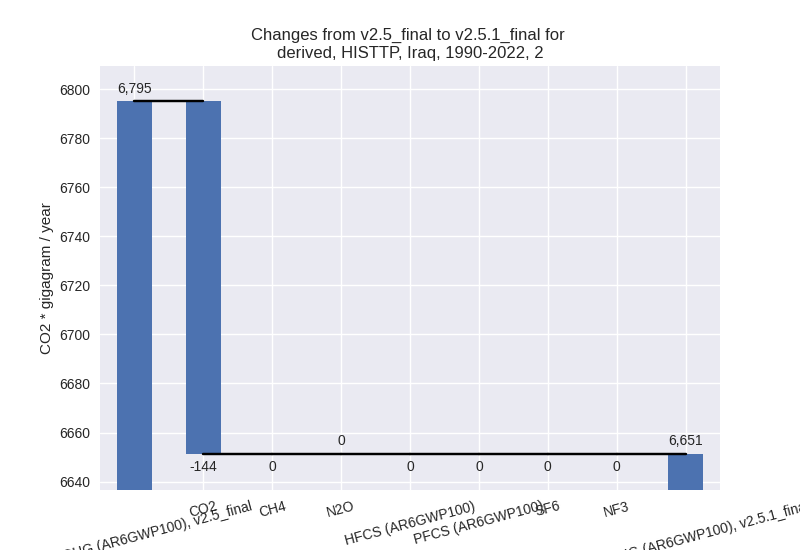
Changes by sector and gas
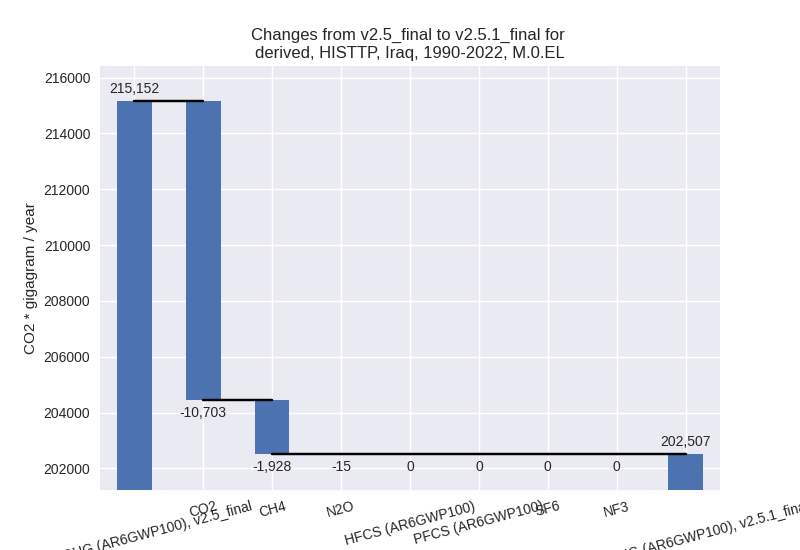
For each scenario and time frame the changes are displayed for all individual sectors and all individual gases. In the sector plot we use aggregate Kyoto GHGs in AR6GWP100. In the gas plot we usenational total emissions without LULUCF. ## country reported scenario
2022

1990-2022

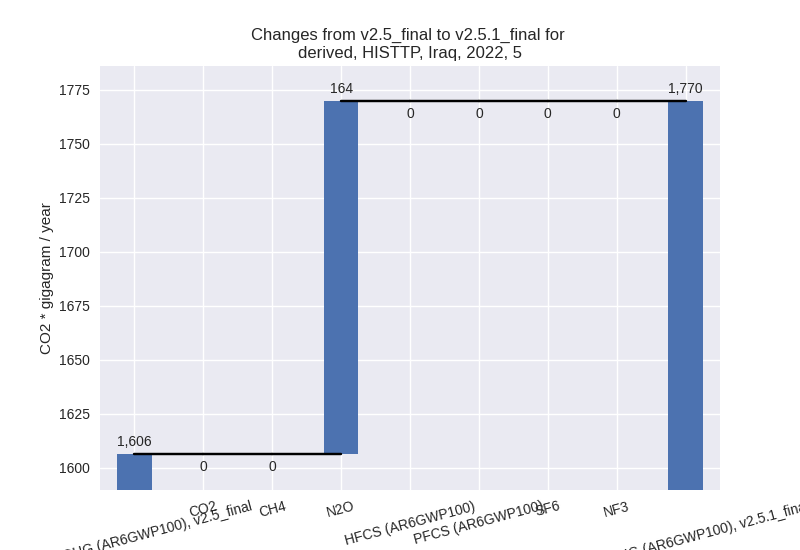
third party scenario
2022

1990-2022

Detailed changes for the scenarios:
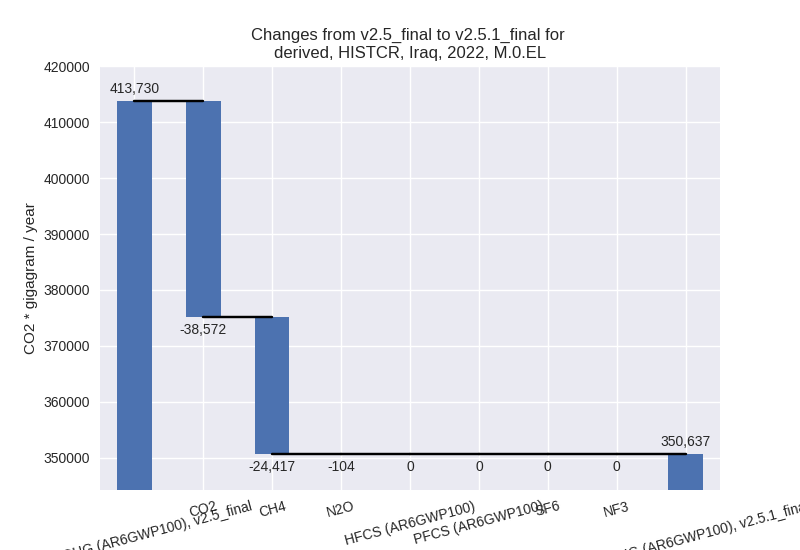
country reported scenario (HISTCR):
Most important changes per time frame
For 2022 the following sector-gas combinations have the highest absolute impact on national total KyotoGHG (AR6GWP100) emissions in 2022 (top 5):
- 1: 1.A, CO2 with -37951.64 Gg CO2 / year (-21.5%)
- 2: 1.B.2, CH4 with -24606.69 Gg CO2 / year (-15.6%)
- 3: M.AG.ELV, CO2 with -421.53 Gg CO2 / year (-84.2%)
- 4: M.AG.ELV, N2O with -294.69 Gg CO2 / year (-8.2%)
- 5: 3.A, CH4 with 211.95 Gg CO2 / year (5.6%)
For 1990-2022 the following sector-gas combinations have the highest absolute impact on national total KyotoGHG (AR6GWP100) emissions in 1990-2022 (top 5):
- 1: 1.A, CO2 with -10507.74 Gg CO2 / year (-10.4%)
- 2: 1.B.2, CH4 with -1936.19 Gg CO2 / year (-2.7%)
- 3: 2, CO2 with -143.97 Gg CO2 / year (-3.6%)
- 4: M.AG.ELV, CO2 with -51.25 Gg CO2 / year (-14.5%)
- 5: M.AG.ELV, N2O with -19.28 Gg CO2 / year (-0.6%)
Changes in the main sectors for aggregate KyotoGHG (AR6GWP100) are
- 1: Total sectoral emissions in 2022 are 308129.86
Gg CO2 / year which is 87.9% of M.0.EL emissions. 2022 Emissions have
changed by -16.9% (-62528.20 Gg CO2
/ year). 1990-2022 Emissions have changed by -6.6% (-12444.42 Gg CO2 / year). For 2022
the changes per gas
are:

For 1990-2022 the changes per gas are:
The changes come from the following subsectors:- 1.A: Total sectoral emissions in 2022 are 139385.56
Gg CO2 / year which is 45.2% of category 1 emissions. 2022 Emissions
have changed by -21.4% (-37895.22 Gg
CO2 / year). 1990-2022 Emissions have changed by -10.4% (-10507.48 Gg CO2 / year). For 2022
the changes per gas
are:

For 1990-2022 the changes per gas are: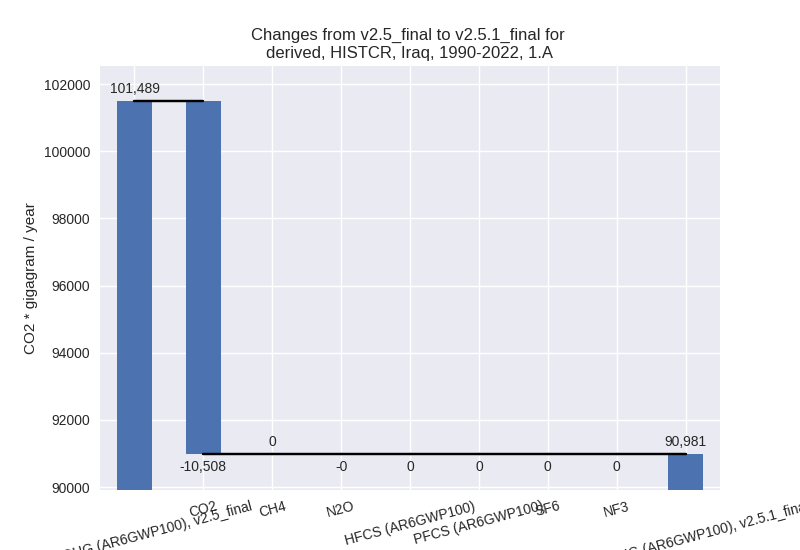
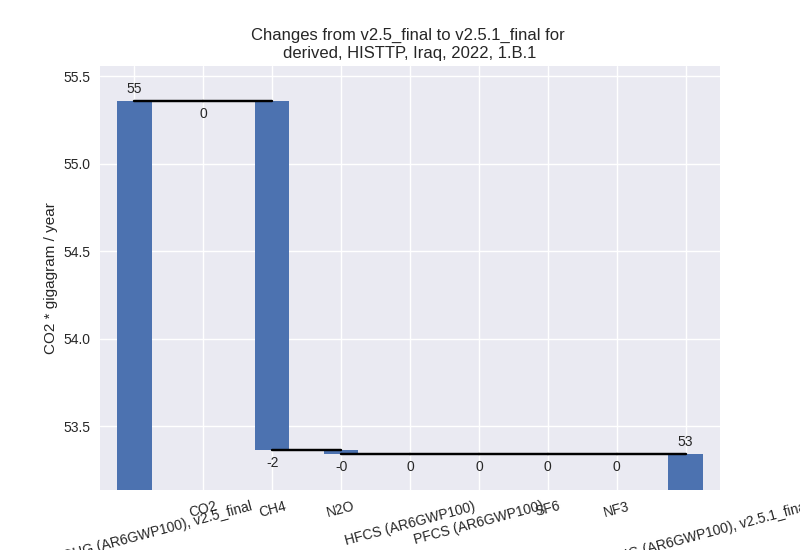
There is no subsector information available in PRIMAP-hist. - 1.B.1: Total sectoral emissions in 2022 are 53.34
Gg CO2 / year which is 0.0% of category 1 emissions. 2022 Emissions have
changed by -3.6% (-2.02 Gg CO2 /
year). 1990-2022 Emissions have changed by -0.0% (-0.01 Gg CO2 / year). For 2022 the
changes per gas
are:

There is no subsector information available in PRIMAP-hist. - 1.B.2: Total sectoral emissions in 2022 are
168690.96 Gg CO2 / year which is 54.7% of category 1 emissions. 2022
Emissions have changed by -12.7%
(-24630.96 Gg CO2 / year). 1990-2022 Emissions have changed by -2.2% (-1936.92 Gg CO2 / year). For 2022
the changes per gas
are:

For 1990-2022 the changes per gas are: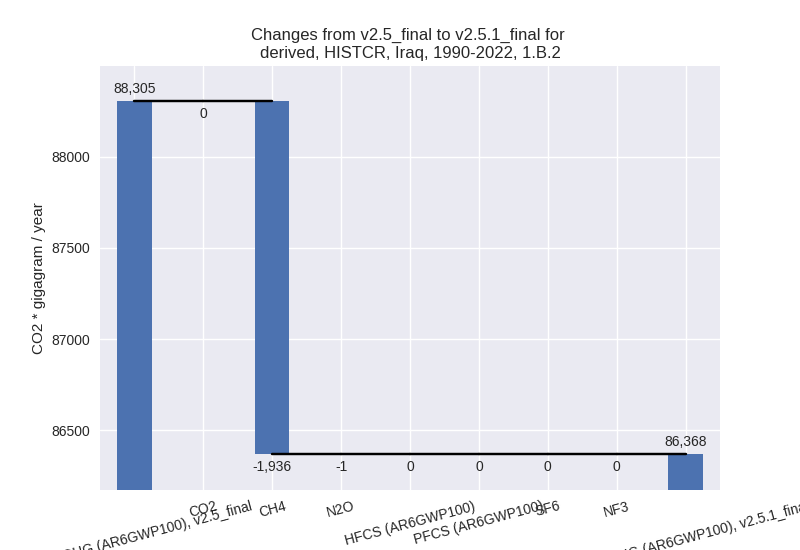
There is no subsector information available in PRIMAP-hist.
- 1.A: Total sectoral emissions in 2022 are 139385.56
Gg CO2 / year which is 45.2% of category 1 emissions. 2022 Emissions
have changed by -21.4% (-37895.22 Gg
CO2 / year). 1990-2022 Emissions have changed by -10.4% (-10507.48 Gg CO2 / year). For 2022
the changes per gas
are:
- 2: Total sectoral emissions in 2022 are 16877.13 Gg
CO2 / year which is 4.8% of M.0.EL emissions. 2022 Emissions have
changed by -1.1% (-188.30 Gg CO2 /
year). 1990-2022 Emissions have changed by -2.1% (-143.78 Gg CO2 / year). For
1990-2022 the changes per gas
are:

- M.AG: Total sectoral emissions in 2022 are 8212.21
Gg CO2 / year which is 2.3% of M.0.EL emissions. 2022 Emissions have
changed by -5.5% (-475.65 Gg CO2 /
year). 1990-2022 Emissions have changed by -0.8% (-60.21 Gg CO2 / year). For 2022 the
changes per gas
are:
The changes come from the following subsectors:- 3.A: Total sectoral emissions in 2022 are 4035.10
Gg CO2 / year which is 49.1% of category M.AG emissions. 2022 Emissions
have changed by 5.5% (211.96 Gg CO2
/ year). 1990-2022 Emissions have changed by 0.3% (11.32 Gg CO2 / year). For 2022 the
changes per gas
are:
There is no subsector information available in PRIMAP-hist. - M.AG.ELV: Total sectoral emissions in 2022 are
4177.11 Gg CO2 / year which is 50.9% of category M.AG emissions. 2022
Emissions have changed by -14.1%
(-687.61 Gg CO2 / year). 1990-2022 Emissions have changed by -1.7% (-71.52 Gg CO2 / year). For 2022 the
changes per gas
are:

There is no subsector information available in PRIMAP-hist.
- 3.A: Total sectoral emissions in 2022 are 4035.10
Gg CO2 / year which is 49.1% of category M.AG emissions. 2022 Emissions
have changed by 5.5% (211.96 Gg CO2
/ year). 1990-2022 Emissions have changed by 0.3% (11.32 Gg CO2 / year). For 2022 the
changes per gas
are:
- 4: Total sectoral emissions in 2022 are 15648.10 Gg CO2 / year which is 4.5% of M.0.EL emissions. 2022 Emissions have changed by -0.4% (-64.85 Gg CO2 / year). 1990-2022 Emissions have changed by -0.0% (-1.96 Gg CO2 / year).
- 5: Total sectoral emissions in 2022 are 1769.73 Gg
CO2 / year which is 0.5% of M.0.EL emissions. 2022 Emissions have
changed by 10.2% (163.55 Gg CO2 /
year). 1990-2022 Emissions have changed by 0.6% (4.96 Gg CO2 / year). For 2022 the
changes per gas
are:

third party scenario (HISTTP):
Most important changes per time frame
For 2022 the following sector-gas combinations have the highest absolute impact on national total KyotoGHG (AR6GWP100) emissions in 2022 (top 5):
- 1: 1.A, CO2 with -37951.64 Gg CO2 / year (-21.5%)
- 2: 1.B.2, CH4 with -24606.69 Gg CO2 / year (-15.6%)
- 3: M.AG.ELV, CO2 with -421.53 Gg CO2 / year (-84.2%)
- 4: M.AG.ELV, N2O with -294.69 Gg CO2 / year (-8.2%)
- 5: 3.A, CH4 with 211.95 Gg CO2 / year (5.6%)
For 1990-2022 the following sector-gas combinations have the highest absolute impact on national total KyotoGHG (AR6GWP100) emissions in 1990-2022 (top 5):
- 1: 1.A, CO2 with -10507.74 Gg CO2 / year (-10.4%)
- 2: 1.B.2, CH4 with -1936.19 Gg CO2 / year (-2.7%)
- 3: 2, CO2 with -143.97 Gg CO2 / year (-3.6%)
- 4: M.AG.ELV, CO2 with -51.25 Gg CO2 / year (-14.5%)
- 5: M.AG.ELV, N2O with -19.28 Gg CO2 / year (-0.6%)
Changes in the main sectors for aggregate KyotoGHG (AR6GWP100) are
- 1: Total sectoral emissions in 2022 are 308129.86
Gg CO2 / year which is 87.9% of M.0.EL emissions. 2022 Emissions have
changed by -16.9% (-62528.20 Gg CO2
/ year). 1990-2022 Emissions have changed by -6.6% (-12444.42 Gg CO2 / year). For 2022
the changes per gas
are:

For 1990-2022 the changes per gas are:
The changes come from the following subsectors:- 1.A: Total sectoral emissions in 2022 are 139385.56
Gg CO2 / year which is 45.2% of category 1 emissions. 2022 Emissions
have changed by -21.4% (-37895.22 Gg
CO2 / year). 1990-2022 Emissions have changed by -10.4% (-10507.48 Gg CO2 / year). For 2022
the changes per gas
are:

For 1990-2022 the changes per gas are:
There is no subsector information available in PRIMAP-hist. - 1.B.1: Total sectoral emissions in 2022 are 53.34
Gg CO2 / year which is 0.0% of category 1 emissions. 2022 Emissions have
changed by -3.6% (-2.02 Gg CO2 /
year). 1990-2022 Emissions have changed by -0.0% (-0.01 Gg CO2 / year). For 2022 the
changes per gas
are:
There is no subsector information available in PRIMAP-hist. - 1.B.2: Total sectoral emissions in 2022 are
168690.96 Gg CO2 / year which is 54.7% of category 1 emissions. 2022
Emissions have changed by -12.7%
(-24630.96 Gg CO2 / year). 1990-2022 Emissions have changed by -2.2% (-1936.92 Gg CO2 / year). For 2022
the changes per gas
are:

For 1990-2022 the changes per gas are:
There is no subsector information available in PRIMAP-hist.
- 1.A: Total sectoral emissions in 2022 are 139385.56
Gg CO2 / year which is 45.2% of category 1 emissions. 2022 Emissions
have changed by -21.4% (-37895.22 Gg
CO2 / year). 1990-2022 Emissions have changed by -10.4% (-10507.48 Gg CO2 / year). For 2022
the changes per gas
are:
- 2: Total sectoral emissions in 2022 are 16877.13 Gg
CO2 / year which is 4.8% of M.0.EL emissions. 2022 Emissions have
changed by -1.1% (-188.30 Gg CO2 /
year). 1990-2022 Emissions have changed by -2.1% (-143.78 Gg CO2 / year). For
1990-2022 the changes per gas
are:
- M.AG: Total sectoral emissions in 2022 are 8212.21
Gg CO2 / year which is 2.3% of M.0.EL emissions. 2022 Emissions have
changed by -5.5% (-475.65 Gg CO2 /
year). 1990-2022 Emissions have changed by -0.8% (-60.21 Gg CO2 / year). For 2022 the
changes per gas
are:

The changes come from the following subsectors:- 3.A: Total sectoral emissions in 2022 are 4035.10
Gg CO2 / year which is 49.1% of category M.AG emissions. 2022 Emissions
have changed by 5.5% (211.96 Gg CO2
/ year). 1990-2022 Emissions have changed by 0.3% (11.32 Gg CO2 / year). For 2022 the
changes per gas
are:

There is no subsector information available in PRIMAP-hist. - M.AG.ELV: Total sectoral emissions in 2022 are
4177.11 Gg CO2 / year which is 50.9% of category M.AG emissions. 2022
Emissions have changed by -14.1%
(-687.61 Gg CO2 / year). 1990-2022 Emissions have changed by -1.7% (-71.52 Gg CO2 / year). For 2022 the
changes per gas
are:

There is no subsector information available in PRIMAP-hist.
- 3.A: Total sectoral emissions in 2022 are 4035.10
Gg CO2 / year which is 49.1% of category M.AG emissions. 2022 Emissions
have changed by 5.5% (211.96 Gg CO2
/ year). 1990-2022 Emissions have changed by 0.3% (11.32 Gg CO2 / year). For 2022 the
changes per gas
are:
- 4: Total sectoral emissions in 2022 are 15648.10 Gg CO2 / year which is 4.5% of M.0.EL emissions. 2022 Emissions have changed by -0.4% (-64.85 Gg CO2 / year). 1990-2022 Emissions have changed by -0.0% (-1.96 Gg CO2 / year).
- 5: Total sectoral emissions in 2022 are 1769.73 Gg
CO2 / year which is 0.5% of M.0.EL emissions. 2022 Emissions have
changed by 10.2% (163.55 Gg CO2 /
year). 1990-2022 Emissions have changed by 0.6% (4.96 Gg CO2 / year). For 2022 the
changes per gas
are: