Changes in PRIMAP-hist v2.5.1_final compared to v2.5_final for Iceland
2024-02-29
Johannes Gütschow
Change analysis for Iceland for PRIMAP-hist v2.5.1_final compared to v2.5_final
Overview over emissions by sector and gas
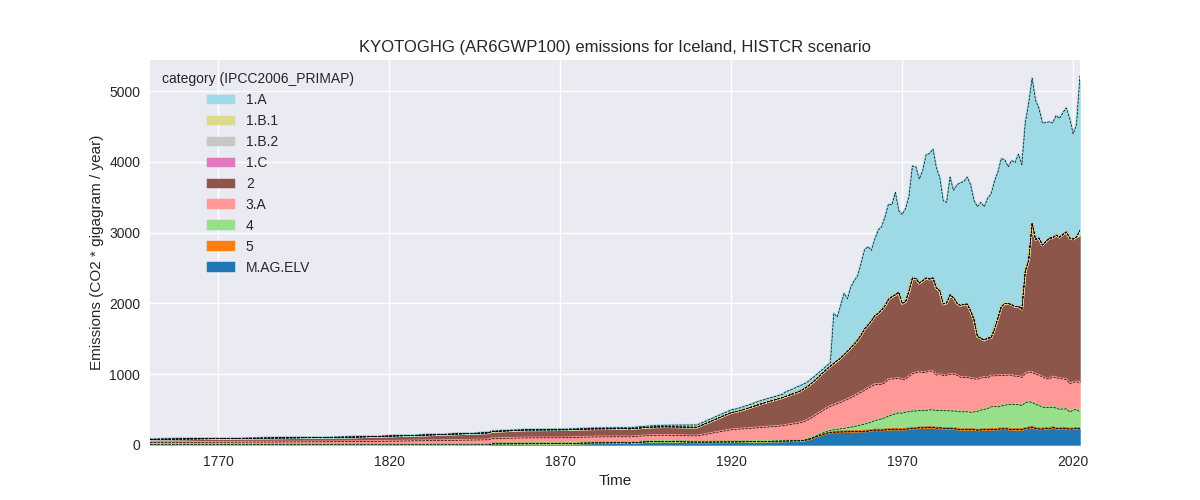
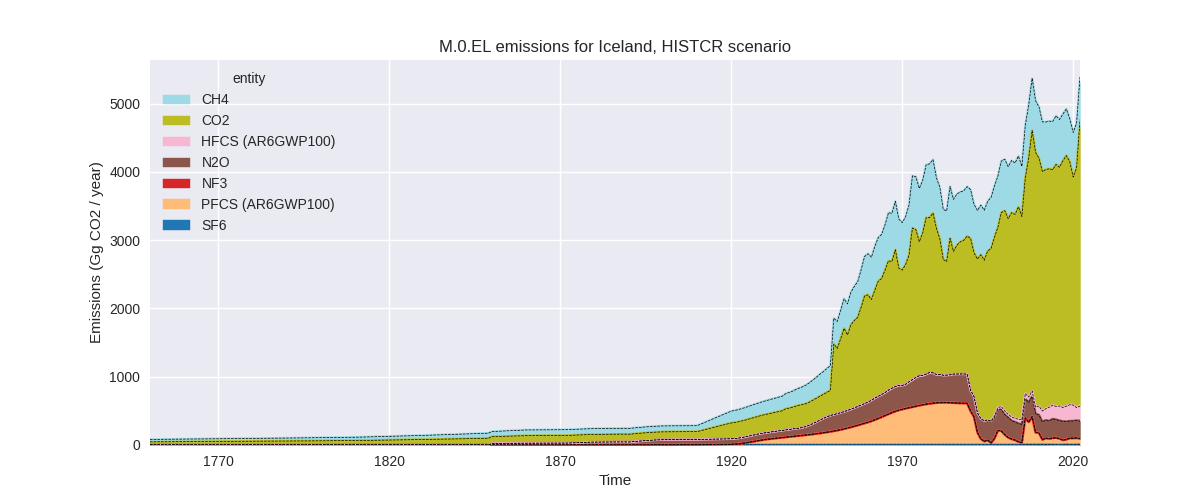
The following figures show the aggregate national total emissions excluding LULUCF AR6GWP100 for the country reported priority scenario. The dotted linesshow the v2.5_final data.

The following figures show the aggregate national total emissions excluding LULUCF AR6GWP100 for the third party priority scenario. The dotted linesshow the v2.5_final data.


Overview over changes
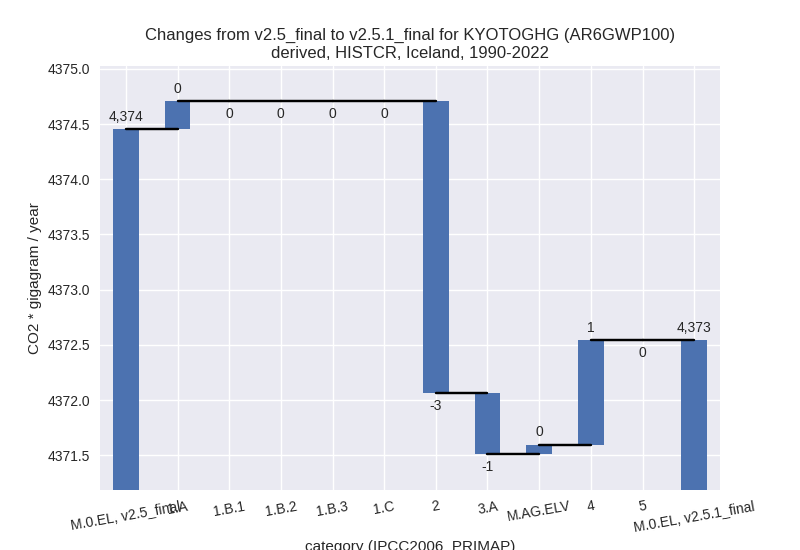
In the country reported priority scenario we have the following changes for aggregate Kyoto GHG and national total emissions excluding LULUCF (M.0.EL):
- Emissions in 2022 have changed by -1.2%% (-63.14 Gg CO2 / year)
- Emissions in 1990-2022 have changed by -0.0%% (-1.91 Gg CO2 / year)
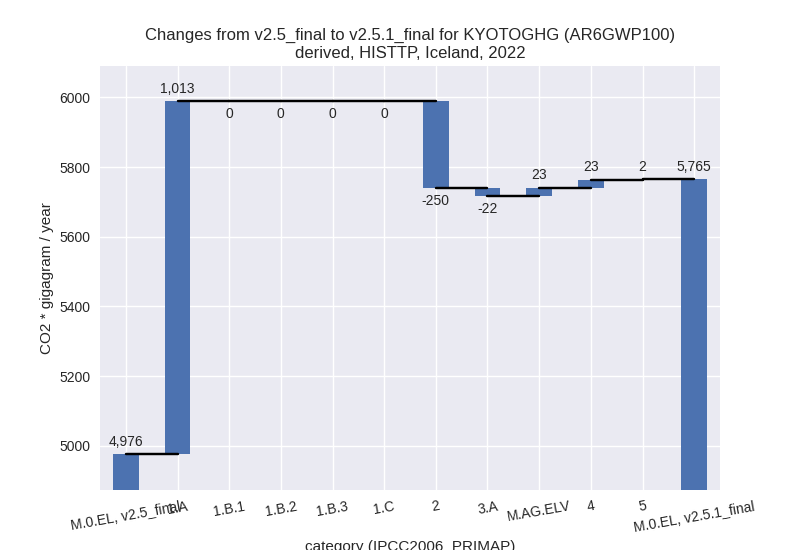
In the third party priority scenario we have the following changes for aggregate Kyoto GHG and national total emissions excluding LULUCF (M.0.EL):
- Emissions in 2022 have changed by 15.8%% (788.69 Gg CO2 / year)
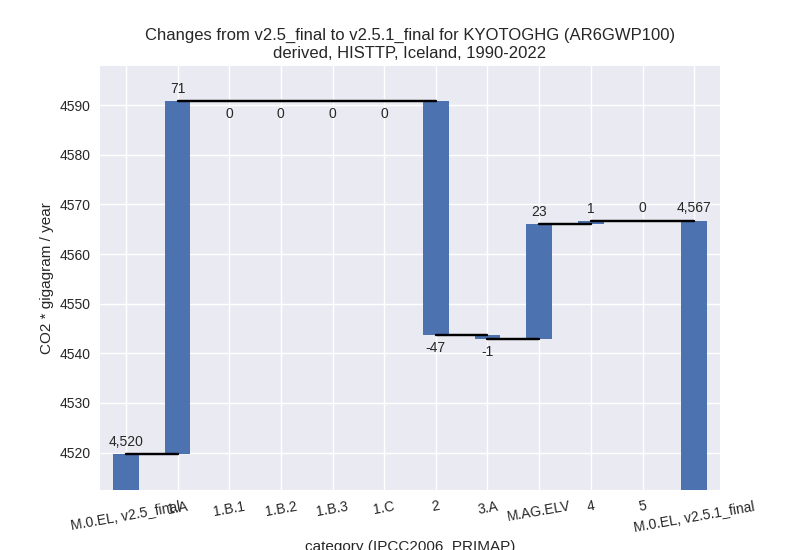
- Emissions in 1990-2022 have changed by 1.0%% (47.04 Gg CO2 / year)
Most important changes per scenario and time frame
In the country reported priority scenario the following sector-gas combinations have the highest absolute impact on national total KyotoGHG (AR6GWP100) emissions in 2022 (top 5):
- 1: 2, CO2 with -87.34 Gg CO2 / year (-4.7%)
- 2: 4, CH4 with 32.05 Gg CO2 / year (14.4%)
- 3: 3.A, CH4 with -18.07 Gg CO2 / year (-4.5%)
- 4: 1.A, N2O with 7.01 Gg CO2 / year (43.4%)
- 5: M.AG.ELV, N2O with 2.83 Gg CO2 / year (1.3%)
In the country reported priority scenario the following sector-gas combinations have the highest absolute impact on national total KyotoGHG (AR6GWP100) emissions in 1990-2022 (top 5):
- 1: 2, CO2 with -2.65 Gg CO2 / year (-0.2%)
- 2: 4, CH4 with 0.97 Gg CO2 / year (0.3%)
- 3: 3.A, CH4 with -0.55 Gg CO2 / year (-0.1%)
- 4: 1.A, N2O with 0.21 Gg CO2 / year (0.8%)
- 5: M.AG.ELV, N2O with 0.09 Gg CO2 / year (0.0%)
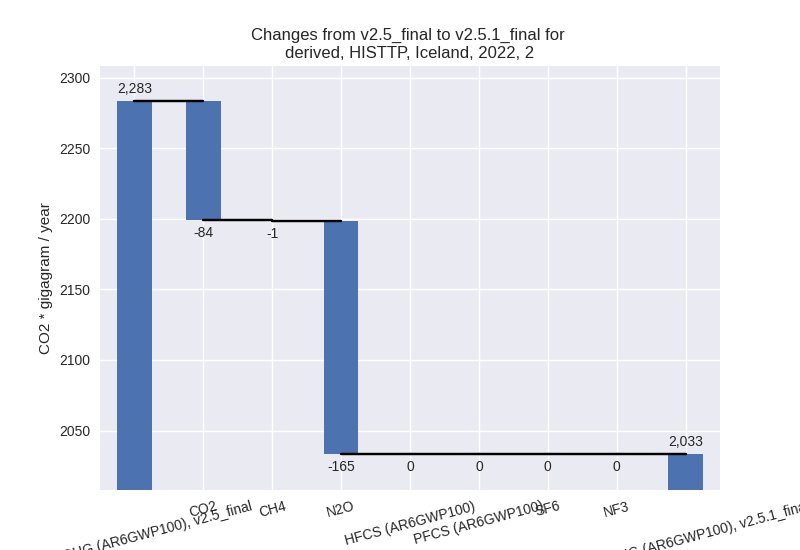
In the third party priority scenario the following sector-gas combinations have the highest absolute impact on national total KyotoGHG (AR6GWP100) emissions in 2022 (top 5):
- 1: 1.A, CO2 with 1005.71 Gg CO2 / year (61.6%)
- 2: 2, N2O with -165.06 Gg CO2 / year (-90.5%)
- 3: 2, CO2 with -84.30 Gg CO2 / year (-4.9%)
- 4: M.AG.ELV, N2O with 23.38 Gg CO2 / year (8.6%)
- 5: 4, CH4 with 22.53 Gg CO2 / year (9.5%)
In the third party priority scenario the following sector-gas combinations have the highest absolute impact on national total KyotoGHG (AR6GWP100) emissions in 1990-2022 (top 5):
- 1: 1.A, CO2 with 70.67 Gg CO2 / year (3.6%)
- 2: 2, N2O with -26.56 Gg CO2 / year (-63.0%)
- 3: M.AG.ELV, N2O with 22.65 Gg CO2 / year (8.2%)
- 4: 2, CO2 with -20.47 Gg CO2 / year (-1.8%)
- 5: 3.A, CH4 with -0.77 Gg CO2 / year (-0.2%)
Notes on data changes
Here we list notes explaining important emissions changes for the country. ’' means that the following text only applies to the TP time series, while means that it only applies to the CR scenario. Otherwise the note applies to both scenarios.
- 1.A, CO2: EI 2023 data shows a deep emissions drop in 2020 and 2021 which is not as pronounced in CDIAC 2023 leading to higher emissions in 2020-2022 which also affect cumulative emissions.
- 2, N2O: EDGAR 7.0 data has very high emissions in 2.B (chemical industry) for 2019-2021 which are not present in EDGAR 8.0 leading to much lower emissions in PRIMAP-hist v2.5.1 for 2019-2022.
Changes by sector and gas
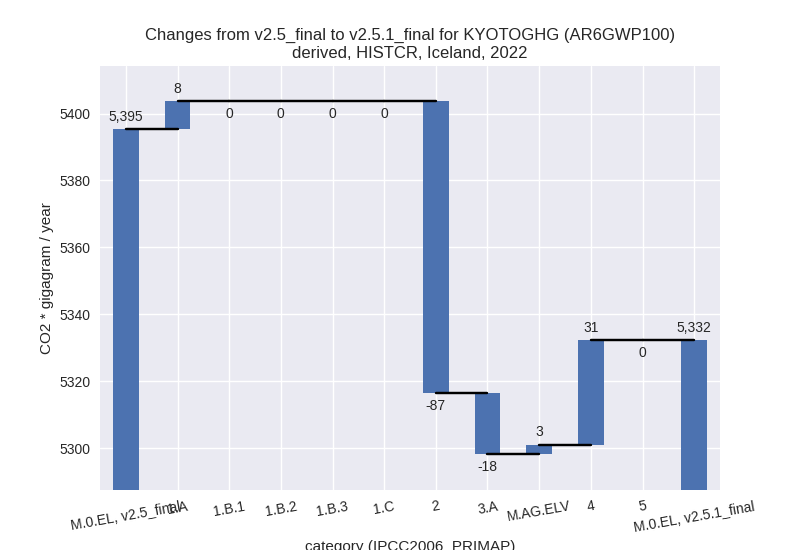
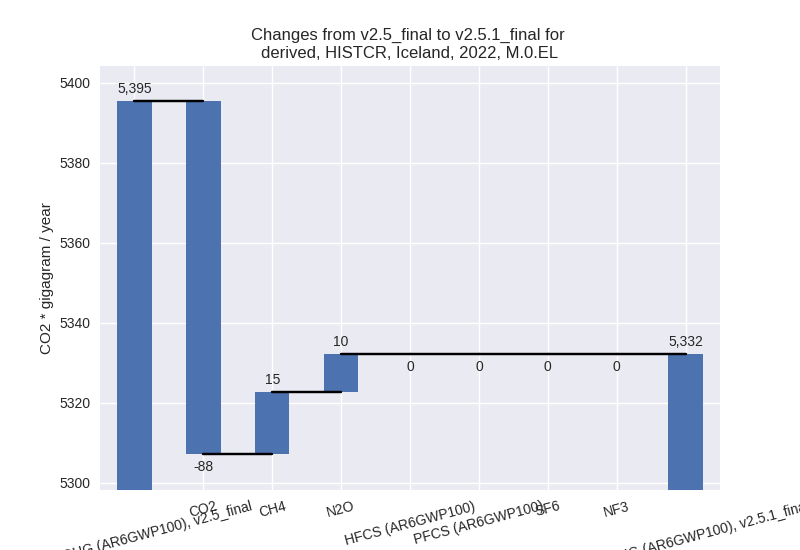
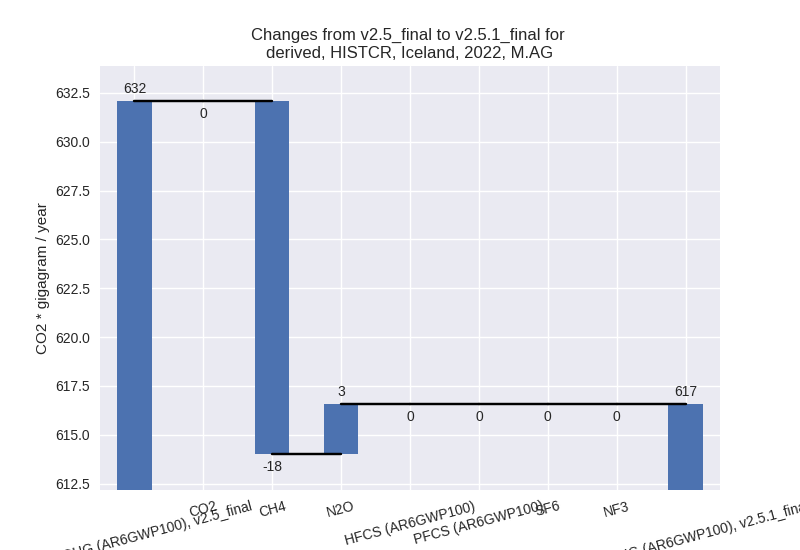
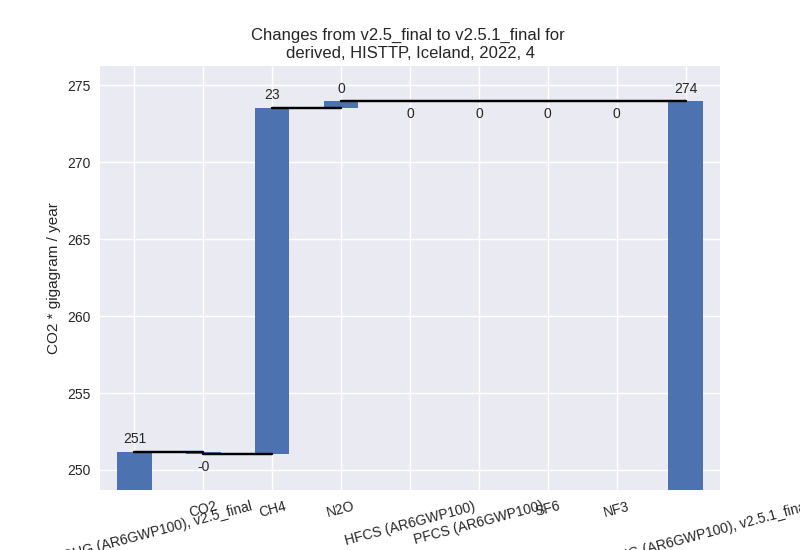
For each scenario and time frame the changes are displayed for all individual sectors and all individual gases. In the sector plot we use aggregate Kyoto GHGs in AR6GWP100. In the gas plot we usenational total emissions without LULUCF. ## country reported scenario
2022
1990-2022

third party scenario
2022

1990-2022

Detailed changes for the scenarios:
country reported scenario (HISTCR):
Most important changes per time frame
For 2022 the following sector-gas combinations have the highest absolute impact on national total KyotoGHG (AR6GWP100) emissions in 2022 (top 5):
- 1: 2, CO2 with -87.34 Gg CO2 / year (-4.7%)
- 2: 4, CH4 with 32.05 Gg CO2 / year (14.4%)
- 3: 3.A, CH4 with -18.07 Gg CO2 / year (-4.5%)
- 4: 1.A, N2O with 7.01 Gg CO2 / year (43.4%)
- 5: M.AG.ELV, N2O with 2.83 Gg CO2 / year (1.3%)
For 1990-2022 the following sector-gas combinations have the highest absolute impact on national total KyotoGHG (AR6GWP100) emissions in 1990-2022 (top 5):
- 1: 2, CO2 with -2.65 Gg CO2 / year (-0.2%)
- 2: 4, CH4 with 0.97 Gg CO2 / year (0.3%)
- 3: 3.A, CH4 with -0.55 Gg CO2 / year (-0.1%)
- 4: 1.A, N2O with 0.21 Gg CO2 / year (0.8%)
- 5: M.AG.ELV, N2O with 0.09 Gg CO2 / year (0.0%)
Changes in the main sectors for aggregate KyotoGHG (AR6GWP100) are
- 1: Total sectoral emissions in 2022 are 2370.57 Gg CO2 / year which is 44.5% of M.0.EL emissions. 2022 Emissions have changed by 0.4% (8.31 Gg CO2 / year). 1990-2022 Emissions have changed by 0.0% (0.25 Gg CO2 / year).
- 2: Total sectoral emissions in 2022 are 2075.77 Gg
CO2 / year which is 38.9% of M.0.EL emissions. 2022 Emissions have
changed by -4.0% (-87.18 Gg CO2 /
year). 1990-2022 Emissions have changed by -0.2% (-2.64 Gg CO2 / year). For 2022 the
changes per gas
are:

- M.AG: Total sectoral emissions in 2022 are 616.56
Gg CO2 / year which is 11.6% of M.0.EL emissions. 2022 Emissions have
changed by -2.5% (-15.51 Gg CO2 /
year). 1990-2022 Emissions have changed by -0.1% (-0.47 Gg CO2 / year). For 2022 the
changes per gas
are:
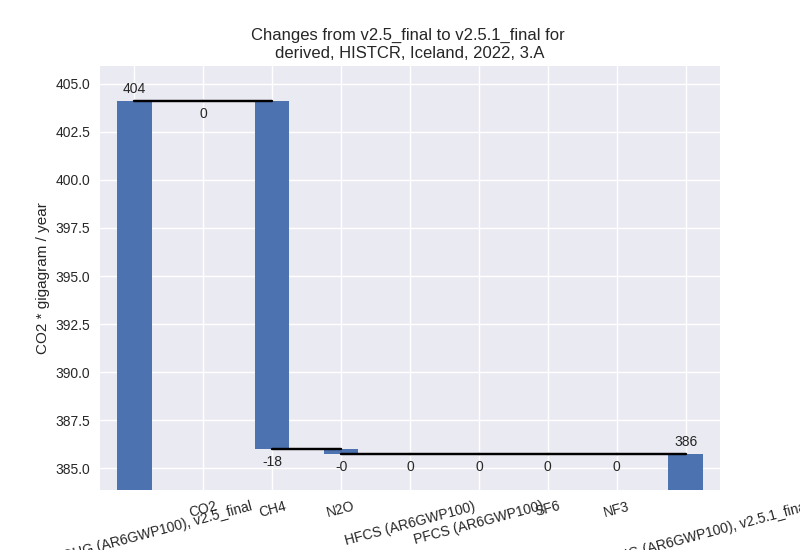
The changes come from the following subsectors:- 3.A: Total sectoral emissions in 2022 are 385.74 Gg
CO2 / year which is 62.6% of category M.AG emissions. 2022 Emissions
have changed by -4.5% (-18.34 Gg CO2
/ year). 1990-2022 Emissions have changed by -0.1% (-0.56 Gg CO2 / year). For 2022 the
changes per gas
are:
There is no subsector information available in PRIMAP-hist. - M.AG.ELV: Total sectoral emissions in 2022 are 230.81 Gg CO2 / year which is 37.4% of category M.AG emissions. 2022 Emissions have changed by 1.2% (2.83 Gg CO2 / year). 1990-2022 Emissions have changed by 0.0% (0.09 Gg CO2 / year).
- 3.A: Total sectoral emissions in 2022 are 385.74 Gg
CO2 / year which is 62.6% of category M.AG emissions. 2022 Emissions
have changed by -4.5% (-18.34 Gg CO2
/ year). 1990-2022 Emissions have changed by -0.1% (-0.56 Gg CO2 / year). For 2022 the
changes per gas
are:
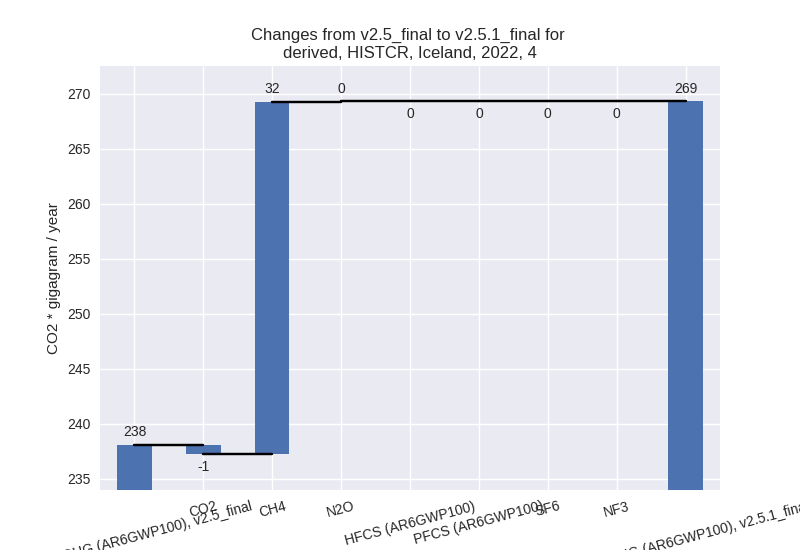
- 4: Total sectoral emissions in 2022 are 269.33 Gg
CO2 / year which is 5.1% of M.0.EL emissions. 2022 Emissions have
changed by 13.1% (31.24 Gg CO2 /
year). 1990-2022 Emissions have changed by 0.3% (0.95 Gg CO2 / year). For 2022 the
changes per gas
are:
- 5: No data
third party scenario (HISTTP):
Most important changes per time frame
For 2022 the following sector-gas combinations have the highest absolute impact on national total KyotoGHG (AR6GWP100) emissions in 2022 (top 5):
- 1: 1.A, CO2 with 1005.71 Gg CO2 / year (61.6%)
- 2: 2, N2O with -165.06 Gg CO2 / year (-90.5%)
- 3: 2, CO2 with -84.30 Gg CO2 / year (-4.9%)
- 4: M.AG.ELV, N2O with 23.38 Gg CO2 / year (8.6%)
- 5: 4, CH4 with 22.53 Gg CO2 / year (9.5%)
For 1990-2022 the following sector-gas combinations have the highest absolute impact on national total KyotoGHG (AR6GWP100) emissions in 1990-2022 (top 5):
- 1: 1.A, CO2 with 70.67 Gg CO2 / year (3.6%)
- 2: 2, N2O with -26.56 Gg CO2 / year (-63.0%)
- 3: M.AG.ELV, N2O with 22.65 Gg CO2 / year (8.2%)
- 4: 2, CO2 with -20.47 Gg CO2 / year (-1.8%)
- 5: 3.A, CH4 with -0.77 Gg CO2 / year (-0.2%)
Changes in the main sectors for aggregate KyotoGHG (AR6GWP100) are
- 1: Total sectoral emissions in 2022 are 2826.00 Gg
CO2 / year which is 49.0% of M.0.EL emissions. 2022 Emissions have
changed by 55.8% (1012.63 Gg CO2 /
year). 1990-2022 Emissions have changed by 3.4% (71.12 Gg CO2 / year). For 2022 the
changes per gas
are:

For 1990-2022 the changes per gas are:
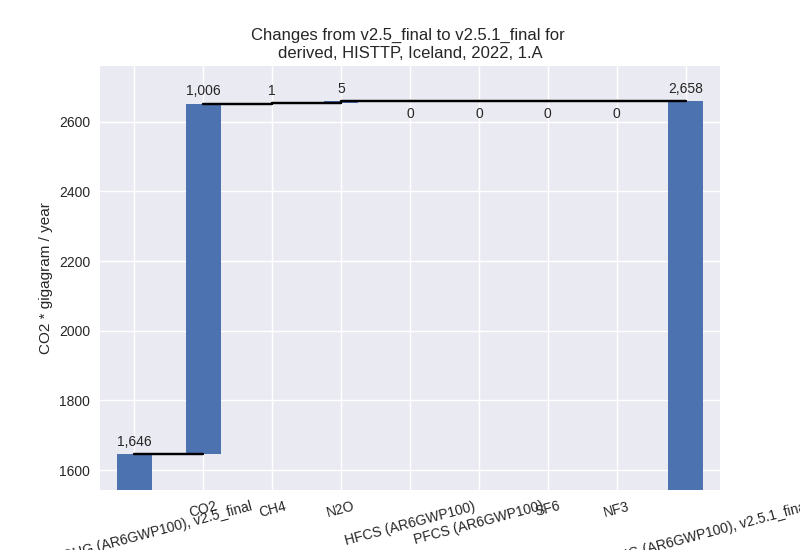
The changes come from the following subsectors:- 1.A: Total sectoral emissions in 2022 are 2658.27
Gg CO2 / year which is 100.0% of category 1 emissions. 2022 Emissions
have changed by 61.5% (1012.63 Gg
CO2 / year). 1990-2022 Emissions have changed by 3.6% (71.12 Gg CO2 / year). For 2022 the
changes per gas
are:
For 1990-2022 the changes per gas are: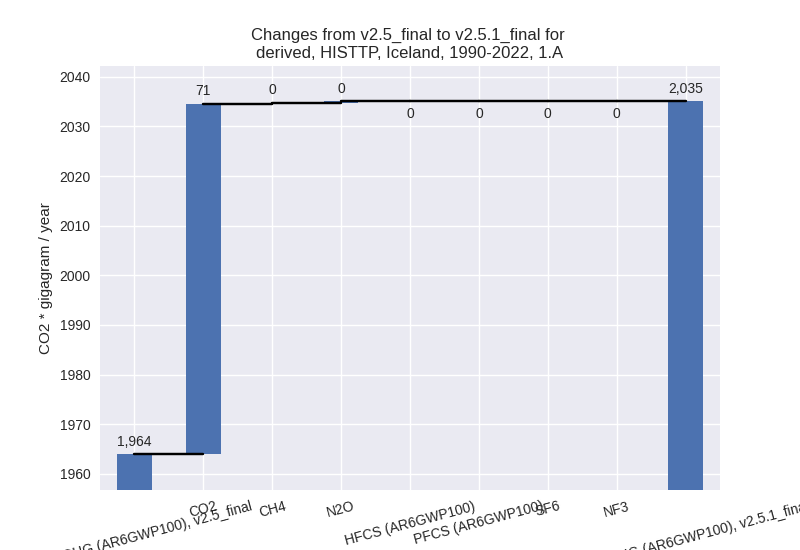
There is no subsector information available in PRIMAP-hist. - 1.B.2: Total sectoral emissions in 2022 are 0.68 Gg CO2 / year which is 0.0% of category 1 emissions. 2022 Emissions have changed by 0.0% (0.00 Gg CO2 / year). 1990-2022 Emissions have changed by 0.0% (0.00 Gg CO2 / year).
- 1.A: Total sectoral emissions in 2022 are 2658.27
Gg CO2 / year which is 100.0% of category 1 emissions. 2022 Emissions
have changed by 61.5% (1012.63 Gg
CO2 / year). 1990-2022 Emissions have changed by 3.6% (71.12 Gg CO2 / year). For 2022 the
changes per gas
are:
- 2: Total sectoral emissions in 2022 are 2033.23 Gg
CO2 / year which is 35.3% of M.0.EL emissions. 2022 Emissions have
changed by -10.9% (-249.93 Gg CO2 /
year). 1990-2022 Emissions have changed by -3.1% (-47.10 Gg CO2 / year). For 2022 the
changes per gas
are:
For 1990-2022 the changes per gas are: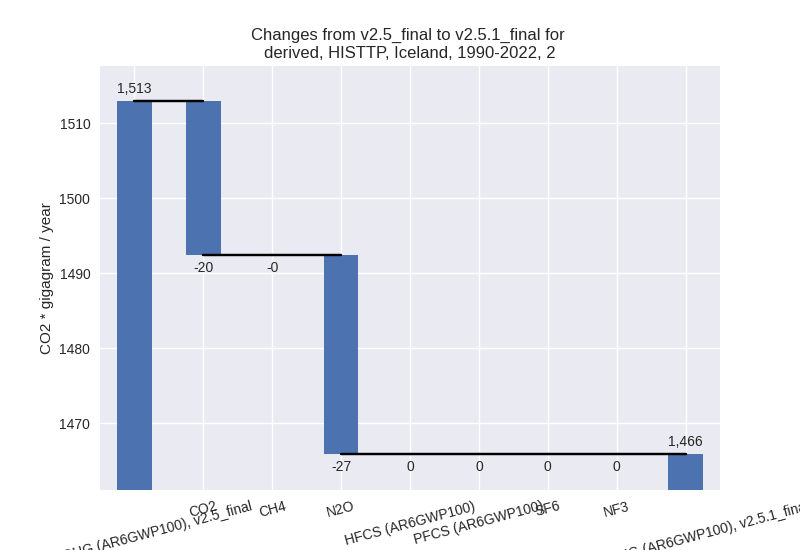
- M.AG: Total sectoral emissions in 2022 are 624.54
Gg CO2 / year which is 10.8% of M.0.EL emissions. 2022 Emissions have
changed by 0.3% (1.64 Gg CO2 /
year). 1990-2022 Emissions have changed by 3.5% (22.28 Gg CO2 / year). For 1990-2022
the changes per gas
are:

The changes come from the following subsectors:- 3.A: Total sectoral emissions in 2022 are 330.34 Gg
CO2 / year which is 52.9% of category M.AG emissions. 2022 Emissions
have changed by -6.2% (-21.74 Gg CO2
/ year). 1990-2022 Emissions have changed by -0.2% (-0.79 Gg CO2 / year). For 2022 the
changes per gas
are:

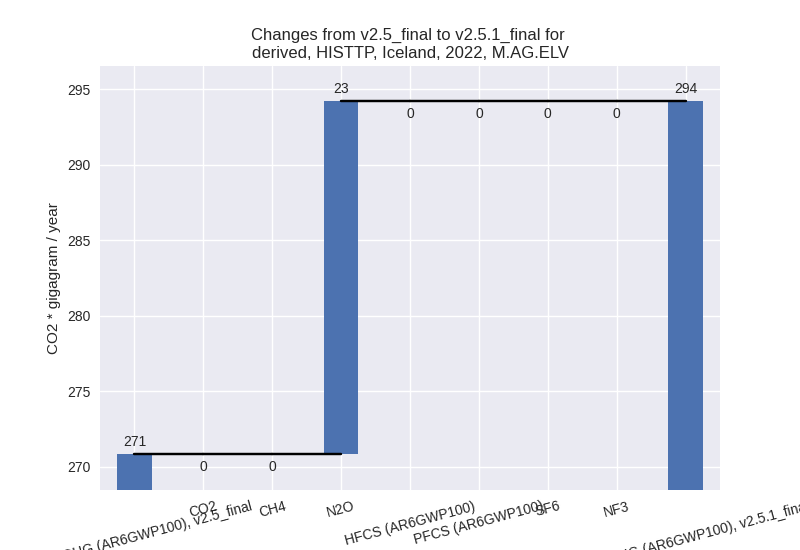
There is no subsector information available in PRIMAP-hist. - M.AG.ELV: Total sectoral emissions in 2022 are
294.20 Gg CO2 / year which is 47.1% of category M.AG emissions. 2022
Emissions have changed by 8.6%
(23.38 Gg CO2 / year). 1990-2022 Emissions have changed by 8.3% (23.07 Gg CO2 / year). For 2022 the
changes per gas
are:
For 1990-2022 the changes per gas are: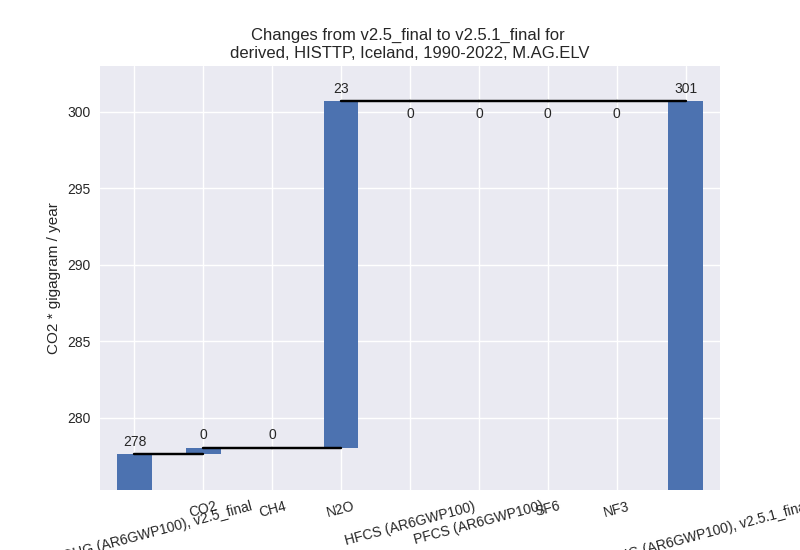
There is no subsector information available in PRIMAP-hist.
- 3.A: Total sectoral emissions in 2022 are 330.34 Gg
CO2 / year which is 52.9% of category M.AG emissions. 2022 Emissions
have changed by -6.2% (-21.74 Gg CO2
/ year). 1990-2022 Emissions have changed by -0.2% (-0.79 Gg CO2 / year). For 2022 the
changes per gas
are:
- 4: Total sectoral emissions in 2022 are 273.96 Gg
CO2 / year which is 4.8% of M.0.EL emissions. 2022 Emissions have
changed by 9.1% (22.79 Gg CO2 /
year). 1990-2022 Emissions have changed by 0.3% (0.69 Gg CO2 / year). For 2022 the
changes per gas
are:
- 5: Total sectoral emissions in 2022 are 7.07 Gg CO2
/ year which is 0.1% of M.0.EL emissions. 2022 Emissions have changed by
28.3% (1.56 Gg CO2 / year).
1990-2022 Emissions have changed by 0.5% (0.05 Gg CO2 / year). For 2022 the
changes per gas
are:
