Changes in PRIMAP-hist v2.5.1_final compared to v2.5_final for Japan
2024-02-29
Johannes Gütschow
Change analysis for Japan for PRIMAP-hist v2.5.1_final compared to v2.5_final
Overview over emissions by sector and gas
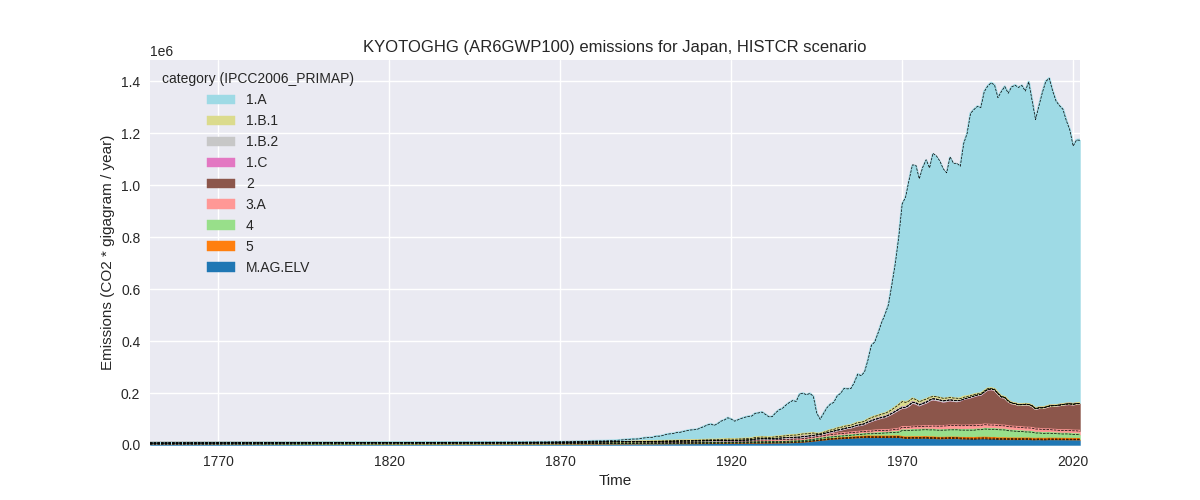
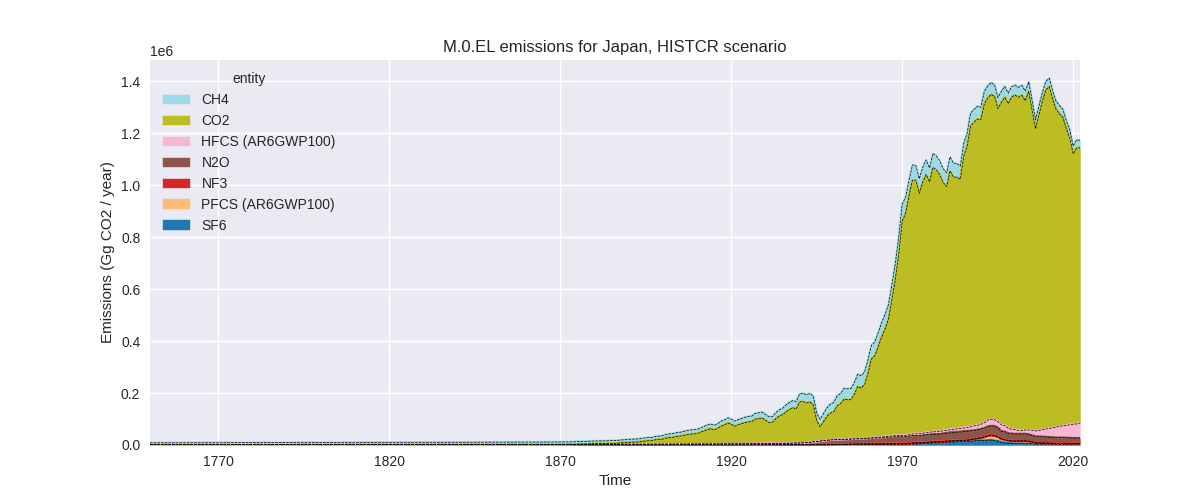
The following figures show the aggregate national total emissions excluding LULUCF AR6GWP100 for the country reported priority scenario. The dotted linesshow the v2.5_final data.

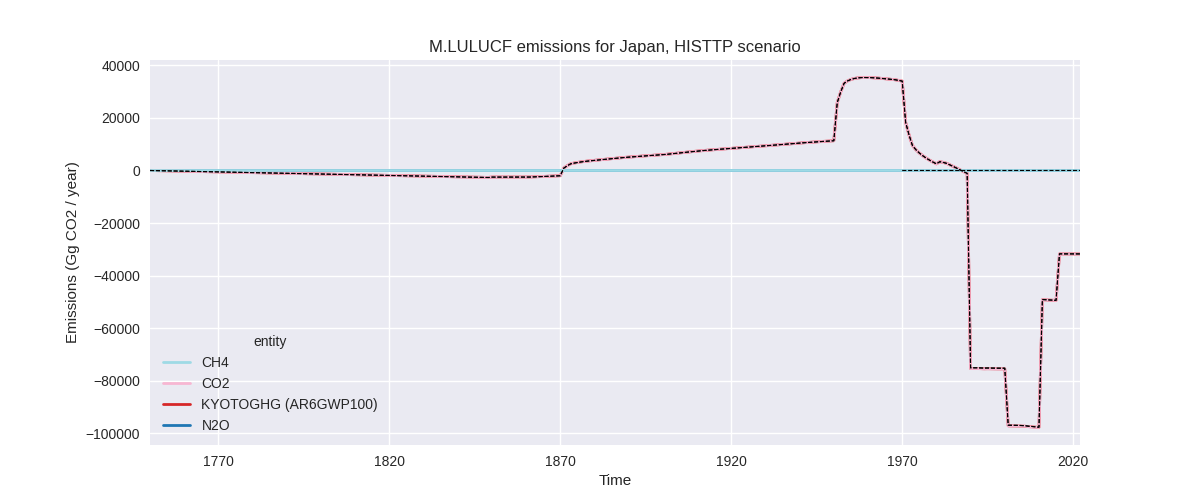
The following figures show the aggregate national total emissions excluding LULUCF AR6GWP100 for the third party priority scenario. The dotted linesshow the v2.5_final data.


Overview over changes
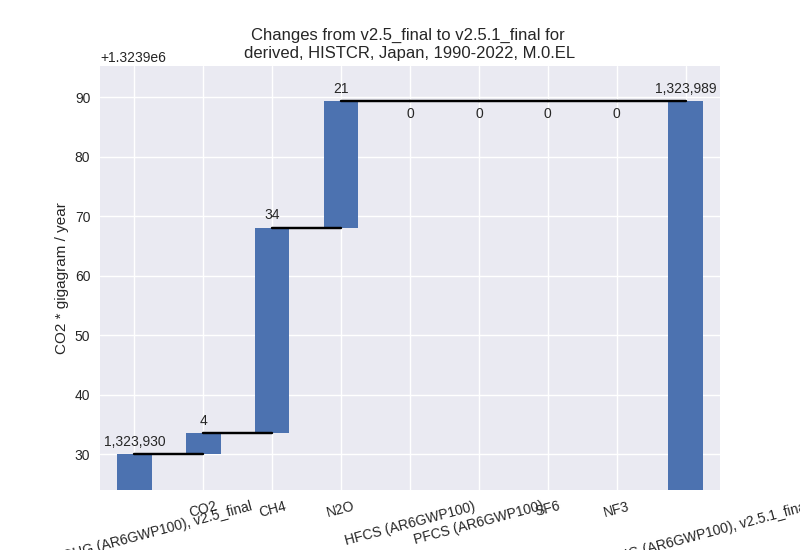
In the country reported priority scenario we have the following changes for aggregate Kyoto GHG and national total emissions excluding LULUCF (M.0.EL):
- Emissions in 2022 have changed by 0.2%% (1955.60 Gg CO2 / year)
- Emissions in 1990-2022 have changed by 0.0%% (59.26 Gg CO2 / year)
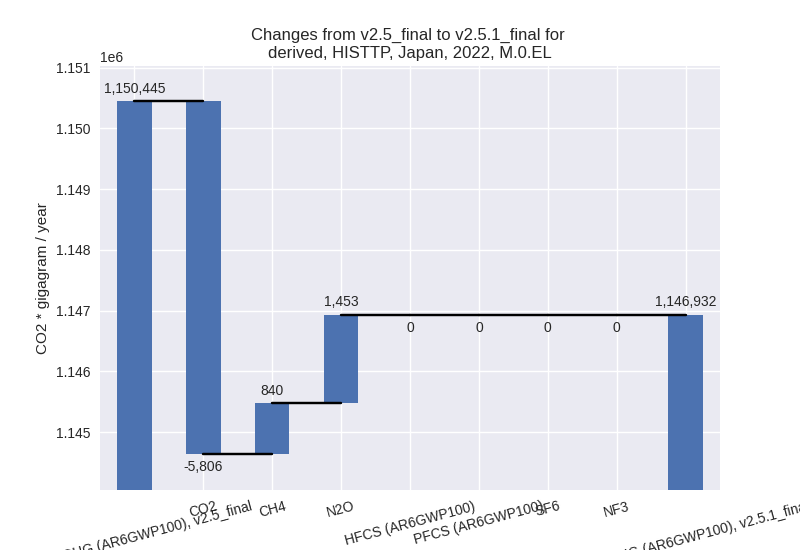
In the third party priority scenario we have the following changes for aggregate Kyoto GHG and national total emissions excluding LULUCF (M.0.EL):
- Emissions in 2022 have changed by -0.3%% (-3512.50 Gg CO2 / year)
- Emissions in 1990-2022 have changed by 0.2%% (2710.84 Gg CO2 / year)
Most important changes per scenario and time frame
In the country reported priority scenario the following sector-gas combinations have the highest absolute impact on national total KyotoGHG (AR6GWP100) emissions in 2022 (top 5):
- 1: 3.A, CH4 with 724.11 Gg CO2 / year (6.8%)
- 2: 4, CH4 with 560.73 Gg CO2 / year (18.9%)
- 3: 2, N2O with 418.95 Gg CO2 / year (80.6%)
- 4: 4, CO2 with 298.20 Gg CO2 / year (2.8%)
- 5: M.AG.ELV, CO2 with -269.49 Gg CO2 / year (-58.4%)
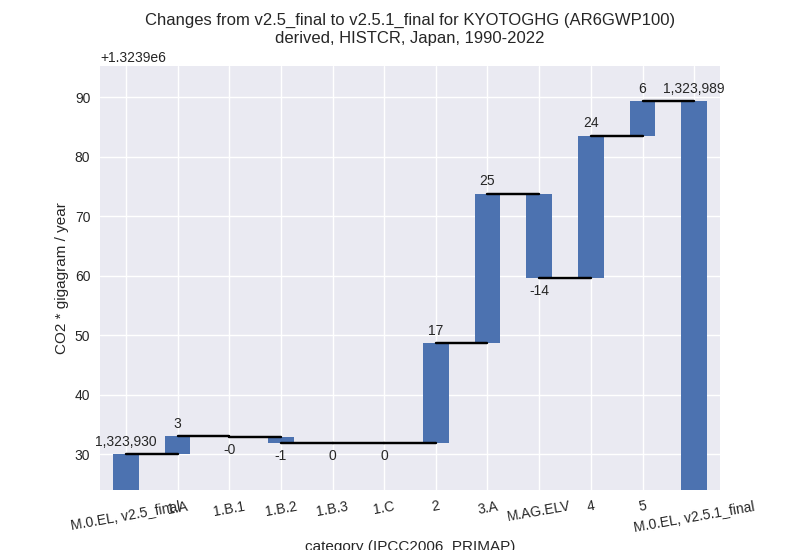
In the country reported priority scenario the following sector-gas combinations have the highest absolute impact on national total KyotoGHG (AR6GWP100) emissions in 1990-2022 (top 5):
- 1: 3.A, CH4 with 21.94 Gg CO2 / year (0.2%)
- 2: 4, CH4 with 16.99 Gg CO2 / year (0.2%)
- 3: 2, N2O with 12.70 Gg CO2 / year (0.3%)
- 4: 4, CO2 with 9.04 Gg CO2 / year (0.1%)
- 5: M.AG.ELV, CO2 with -8.17 Gg CO2 / year (-1.7%)
In the third party priority scenario the following sector-gas combinations have the highest absolute impact on national total KyotoGHG (AR6GWP100) emissions in 2022 (top 5):
- 1: 1.A, CO2 with -6703.30 Gg CO2 / year (-0.7%)
- 2: 2, CO2 with 3730.17 Gg CO2 / year (7.6%)
- 3: 1.B.1, CO2 with -2893.79 Gg CO2 / year (-22.6%)
- 4: 4, CH4 with 649.89 Gg CO2 / year (9.0%)
- 5: 1.A, N2O with 523.51 Gg CO2 / year (9.0%)
In the third party priority scenario the following sector-gas combinations have the highest absolute impact on national total KyotoGHG (AR6GWP100) emissions in 1990-2022 (top 5):
- 1: 1.B.1, CO2 with -4780.93 Gg CO2 / year (-28.5%)
- 2: 2, CO2 with 4717.10 Gg CO2 / year (7.6%)
- 3: 1.A, CO2 with 1460.90 Gg CO2 / year (0.1%)
- 4: 2, N2O with 438.37 Gg CO2 / year (12.1%)
- 5: M.AG.ELV, CO2 with 414.96 Gg CO2 / year (89.9%)
Notes on data changes
No country specific notes present for this changelog.
Changes by sector and gas
For each scenario and time frame the changes are displayed for all individual sectors and all individual gases. In the sector plot we use aggregate Kyoto GHGs in AR6GWP100. In the gas plot we usenational total emissions without LULUCF. ## country reported scenario
2022


1990-2022
third party scenario
2022

1990-2022


Detailed changes for the scenarios:
country reported scenario (HISTCR):
Most important changes per time frame
For 2022 the following sector-gas combinations have the highest absolute impact on national total KyotoGHG (AR6GWP100) emissions in 2022 (top 5):
- 1: 3.A, CH4 with 724.11 Gg CO2 / year (6.8%)
- 2: 4, CH4 with 560.73 Gg CO2 / year (18.9%)
- 3: 2, N2O with 418.95 Gg CO2 / year (80.6%)
- 4: 4, CO2 with 298.20 Gg CO2 / year (2.8%)
- 5: M.AG.ELV, CO2 with -269.49 Gg CO2 / year (-58.4%)
For 1990-2022 the following sector-gas combinations have the highest absolute impact on national total KyotoGHG (AR6GWP100) emissions in 1990-2022 (top 5):
- 1: 3.A, CH4 with 21.94 Gg CO2 / year (0.2%)
- 2: 4, CH4 with 16.99 Gg CO2 / year (0.2%)
- 3: 2, N2O with 12.70 Gg CO2 / year (0.3%)
- 4: 4, CO2 with 9.04 Gg CO2 / year (0.1%)
- 5: M.AG.ELV, CO2 with -8.17 Gg CO2 / year (-1.7%)
Changes in the main sectors for aggregate KyotoGHG (AR6GWP100) are
- 1: Total sectoral emissions in 2022 are 1013886.80 Gg CO2 / year which is 86.3% of M.0.EL emissions. 2022 Emissions have changed by 0.0% (60.50 Gg CO2 / year). 1990-2022 Emissions have changed by 0.0% (1.83 Gg CO2 / year).
- 2: Total sectoral emissions in 2022 are 106603.46 Gg CO2 / year which is 9.1% of M.0.EL emissions. 2022 Emissions have changed by 0.5% (555.42 Gg CO2 / year). 1990-2022 Emissions have changed by 0.0% (16.83 Gg CO2 / year).
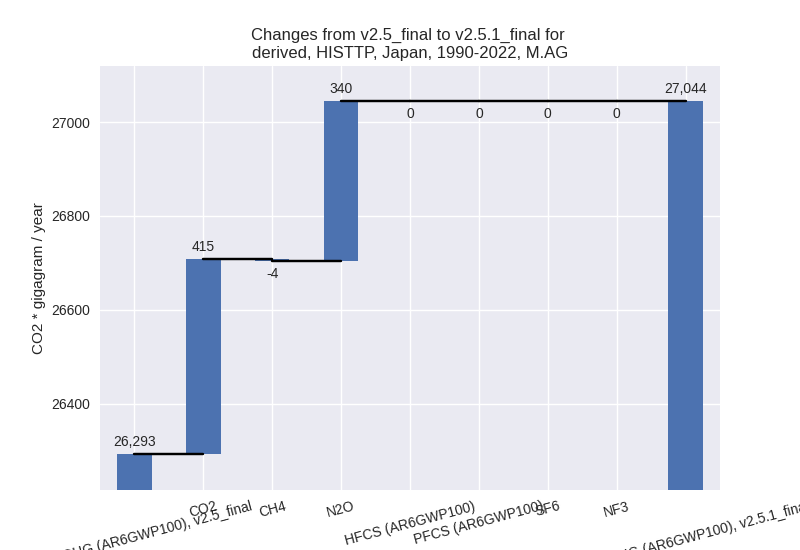
- M.AG: Total sectoral emissions in 2022 are 33543.36 Gg CO2 / year which is 2.9% of M.0.EL emissions. 2022 Emissions have changed by 1.1% (359.70 Gg CO2 / year). 1990-2022 Emissions have changed by 0.0% (10.90 Gg CO2 / year).
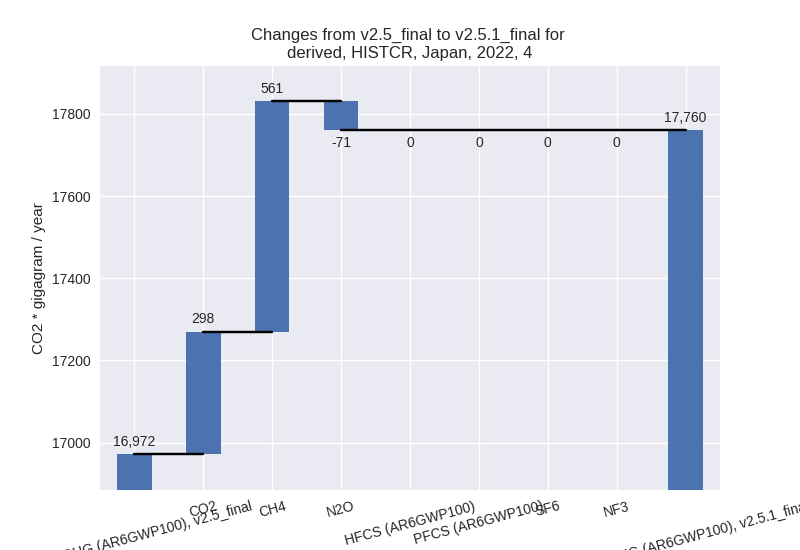
- 4: Total sectoral emissions in 2022 are 17759.72 Gg
CO2 / year which is 1.5% of M.0.EL emissions. 2022 Emissions have
changed by 4.6% (787.98 Gg CO2 /
year). 1990-2022 Emissions have changed by 0.1% (23.88 Gg CO2 / year). For 2022 the
changes per gas
are:
- 5: Total sectoral emissions in 2022 are 2766.39 Gg
CO2 / year which is 0.2% of M.0.EL emissions. 2022 Emissions have
changed by 7.5% (192.10 Gg CO2 /
year). 1990-2022 Emissions have changed by 0.2% (5.82 Gg CO2 / year). For 2022 the
changes per gas
are:

third party scenario (HISTTP):
Most important changes per time frame
For 2022 the following sector-gas combinations have the highest absolute impact on national total KyotoGHG (AR6GWP100) emissions in 2022 (top 5):
- 1: 1.A, CO2 with -6703.30 Gg CO2 / year (-0.7%)
- 2: 2, CO2 with 3730.17 Gg CO2 / year (7.6%)
- 3: 1.B.1, CO2 with -2893.79 Gg CO2 / year (-22.6%)
- 4: 4, CH4 with 649.89 Gg CO2 / year (9.0%)
- 5: 1.A, N2O with 523.51 Gg CO2 / year (9.0%)
For 1990-2022 the following sector-gas combinations have the highest absolute impact on national total KyotoGHG (AR6GWP100) emissions in 1990-2022 (top 5):
- 1: 1.B.1, CO2 with -4780.93 Gg CO2 / year (-28.5%)
- 2: 2, CO2 with 4717.10 Gg CO2 / year (7.6%)
- 3: 1.A, CO2 with 1460.90 Gg CO2 / year (0.1%)
- 4: 2, N2O with 438.37 Gg CO2 / year (12.1%)
- 5: M.AG.ELV, CO2 with 414.96 Gg CO2 / year (89.9%)
Changes in the main sectors for aggregate KyotoGHG (AR6GWP100) are
- 1: Total sectoral emissions in 2022 are 1027979.30 Gg CO2 / year which is 89.6% of M.0.EL emissions. 2022 Emissions have changed by -0.9% (-8968.40 Gg CO2 / year). 1990-2022 Emissions have changed by -0.3% (-3231.43 Gg CO2 / year).
- 2: Total sectoral emissions in 2022 are 79895.95 Gg
CO2 / year which is 7.0% of M.0.EL emissions. 2022 Emissions have
changed by 5.3% (4017.89 Gg CO2 /
year). 1990-2022 Emissions have changed by 5.5% (5158.26 Gg CO2 / year). For 2022 the
changes per gas
are:

For 1990-2022 the changes per gas are:
- M.AG: Total sectoral emissions in 2022 are 22791.99
Gg CO2 / year which is 2.0% of M.0.EL emissions. 2022 Emissions have
changed by 1.6% (356.31 Gg CO2 /
year). 1990-2022 Emissions have changed by 2.9% (751.23 Gg CO2 / year). For 1990-2022
the changes per gas
are:
The changes come from the following subsectors:- 3.A: Total sectoral emissions in 2022 are 8354.55
Gg CO2 / year which is 36.7% of category M.AG emissions. 2022 Emissions
have changed by 6.5% (512.67 Gg CO2
/ year). 1990-2022 Emissions have changed by 0.2% (17.33 Gg CO2 / year). For 2022 the
changes per gas
are:

There is no subsector information available in PRIMAP-hist. - M.AG.ELV: Total sectoral emissions in 2022 are
14437.43 Gg CO2 / year which is 63.3% of category M.AG emissions. 2022
Emissions have changed by -1.1%
(-156.36 Gg CO2 / year). 1990-2022 Emissions have changed by 4.3% (733.89 Gg CO2 / year). For 1990-2022
the changes per gas
are:

There is no subsector information available in PRIMAP-hist.
- 3.A: Total sectoral emissions in 2022 are 8354.55
Gg CO2 / year which is 36.7% of category M.AG emissions. 2022 Emissions
have changed by 6.5% (512.67 Gg CO2
/ year). 1990-2022 Emissions have changed by 0.2% (17.33 Gg CO2 / year). For 2022 the
changes per gas
are:
- 4: Total sectoral emissions in 2022 are 13498.55 Gg
CO2 / year which is 1.2% of M.0.EL emissions. 2022 Emissions have
changed by 7.1% (889.61 Gg CO2 /
year). 1990-2022 Emissions have changed by 0.1% (26.96 Gg CO2 / year). For 2022 the
changes per gas
are:

- 5: Total sectoral emissions in 2022 are 2766.39 Gg
CO2 / year which is 0.2% of M.0.EL emissions. 2022 Emissions have
changed by 7.5% (192.10 Gg CO2 /
year). 1990-2022 Emissions have changed by 0.2% (5.82 Gg CO2 / year). For 2022 the
changes per gas
are:
