Changes in PRIMAP-hist v2.5.1_final compared to v2.5_final for Kazakhstan
2024-02-29
Johannes Gütschow
Change analysis for Kazakhstan for PRIMAP-hist v2.5.1_final compared to v2.5_final
Overview over emissions by sector and gas
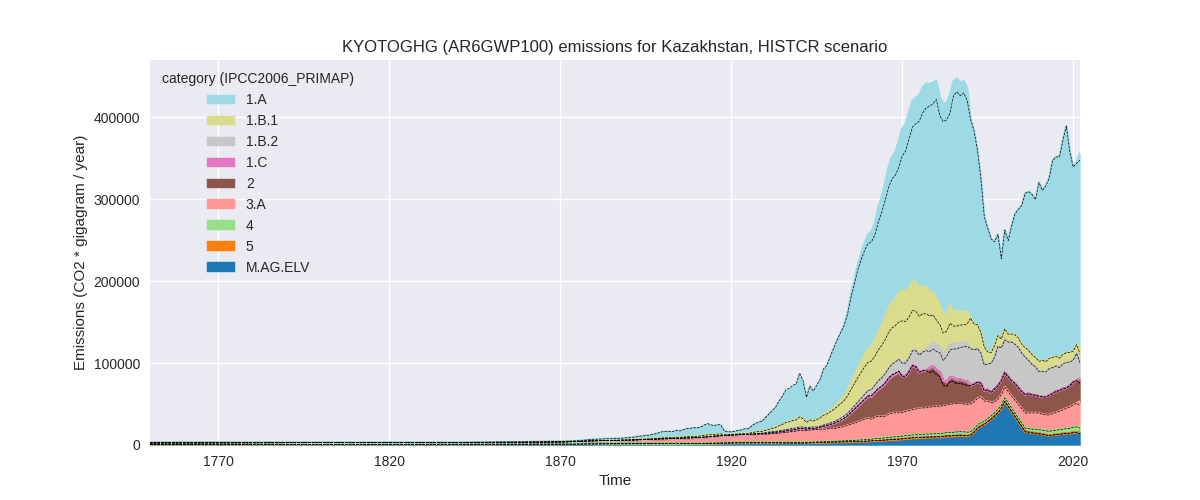
The following figures show the aggregate national total emissions excluding LULUCF AR6GWP100 for the country reported priority scenario. The dotted linesshow the v2.5_final data.


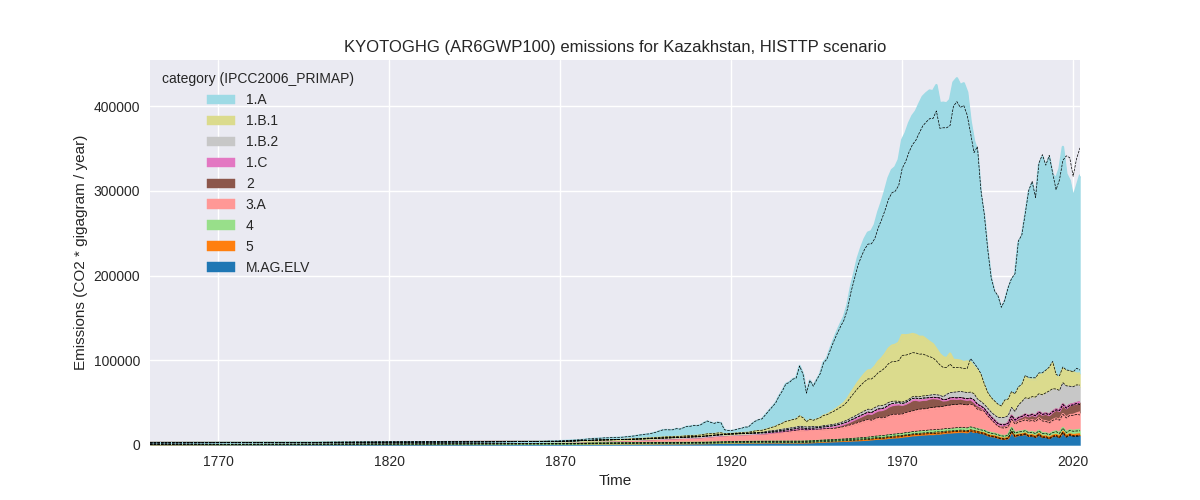
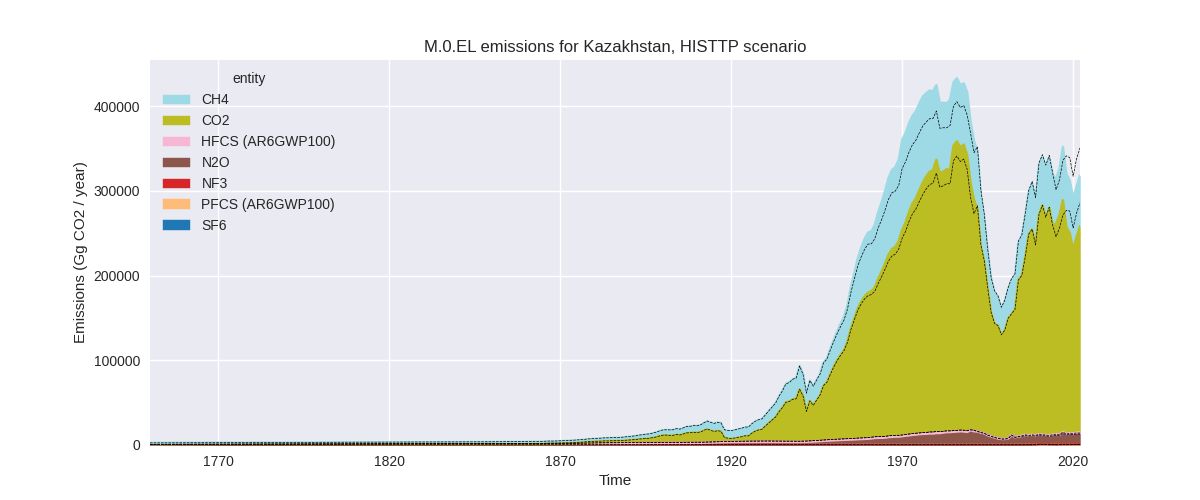
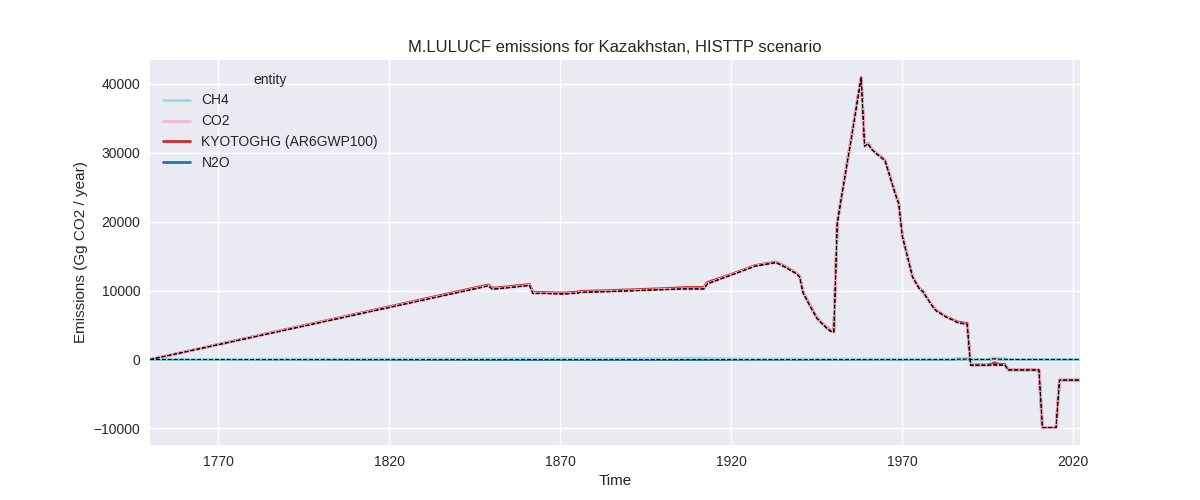
The following figures show the aggregate national total emissions excluding LULUCF AR6GWP100 for the third party priority scenario. The dotted linesshow the v2.5_final data.
Overview over changes
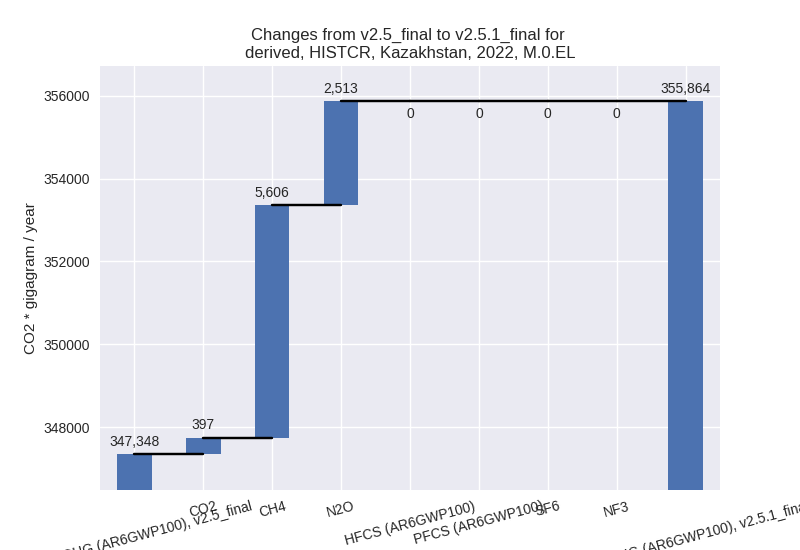
In the country reported priority scenario we have the following changes for aggregate Kyoto GHG and national total emissions excluding LULUCF (M.0.EL):
- Emissions in 2022 have changed by 2.5%% (8515.95 Gg CO2 / year)
- Emissions in 1990-2022 have changed by 0.1%% (258.06 Gg CO2 / year)
In the third party priority scenario we have the following changes for aggregate Kyoto GHG and national total emissions excluding LULUCF (M.0.EL):
- Emissions in 2022 have changed by -9.3%% (-32662.68 Gg CO2 / year)
- Emissions in 1990-2022 have changed by -1.3%% (-3753.42 Gg CO2 / year)
Most important changes per scenario and time frame
In the country reported priority scenario the following sector-gas combinations have the highest absolute impact on national total KyotoGHG (AR6GWP100) emissions in 2022 (top 5):
- 1: 1.B.2, CH4 with 4535.83 Gg CO2 / year (24.4%)
- 2: 3.A, CH4 with 2353.96 Gg CO2 / year (9.3%)
- 3: M.AG.ELV, N2O with 2304.71 Gg CO2 / year (17.5%)
- 4: 1.A, CH4 with -1047.06 Gg CO2 / year (-54.8%)
- 5: 1.B.1, CH4 with -499.42 Gg CO2 / year (-5.4%)
In the country reported priority scenario the following sector-gas combinations have the highest absolute impact on national total KyotoGHG (AR6GWP100) emissions in 1990-2022 (top 5):
- 1: 1.B.2, CH4 with 137.45 Gg CO2 / year (0.5%)
- 2: 3.A, CH4 with 71.33 Gg CO2 / year (0.4%)
- 3: M.AG.ELV, N2O with 69.84 Gg CO2 / year (0.3%)
- 4: 1.A, CH4 with -31.73 Gg CO2 / year (-2.6%)
- 5: 1.B.1, CH4 with -15.13 Gg CO2 / year (-0.1%)
In the third party priority scenario the following sector-gas combinations have the highest absolute impact on national total KyotoGHG (AR6GWP100) emissions in 2022 (top 5):
- 1: 1.A, CO2 with -28872.31 Gg CO2 / year (-11.1%)
- 2: 1.B.2, CH4 with -4560.18 Gg CO2 / year (-21.9%)
- 3: 1.B.1, CH4 with -2274.74 Gg CO2 / year (-12.9%)
- 4: 3.A, CH4 with 1695.43 Gg CO2 / year (9.8%)
- 5: M.AG.ELV, CO2 with 435.34 Gg CO2 / year (2320.5%)
In the third party priority scenario the following sector-gas combinations have the highest absolute impact on national total KyotoGHG (AR6GWP100) emissions in 1990-2022 (top 5):
- 1: 1.B.2, CH4 with -1548.76 Gg CO2 / year (-12.2%)
- 2: 1.A, CO2 with -1415.56 Gg CO2 / year (-0.7%)
- 3: 1.B.1, CH4 with -415.16 Gg CO2 / year (-2.1%)
- 4: 2, CO2 with -341.72 Gg CO2 / year (-5.7%)
- 5: 1.B.1, CO2 with -162.45 Gg CO2 / year (-5.3%)
Notes on data changes
Here we list notes explaining important emissions changes for the country. ’' means that the following text only applies to the TP time series, while means that it only applies to the CR scenario. Otherwise the note applies to both scenarios.
- 1.B.2, CH4: Updated EDGAR data leads to lower emissions for all years. EDGAR 8.0 growth rates replace numerical extrapolation leading to higher emissions in 2022.
- 1.A, CO2: A change in downscaling of CDIAC data for the former Soviet Union to its member states has lowered pre-1990 emissions. The shares are now calculated based on the shares in the first year with data for the individual states instead of a multi year average. This is more realistic as the rapid emissions decline after 1990 differs by country.
- 1.B.1, CH4: EDGAR 8.0 emissions are much higher than EDGAR 7.0 pre-1990 leading to higher emissions in PRIMAP-hist.
Changes by sector and gas
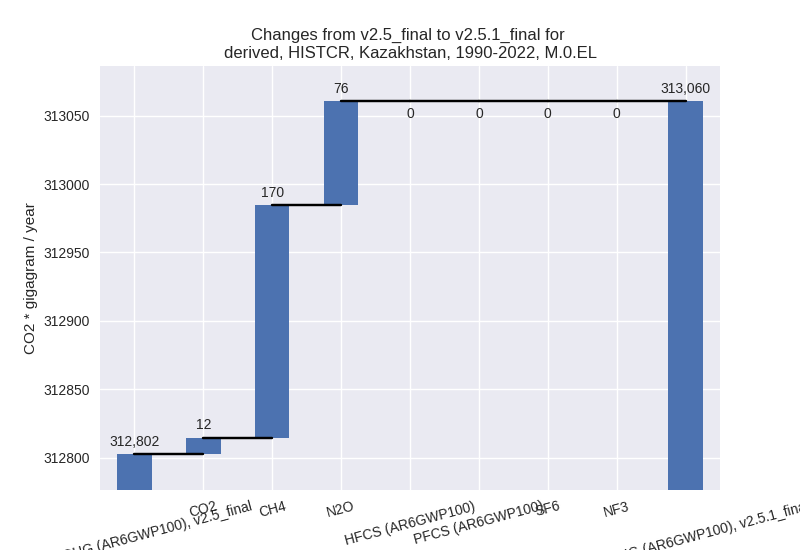
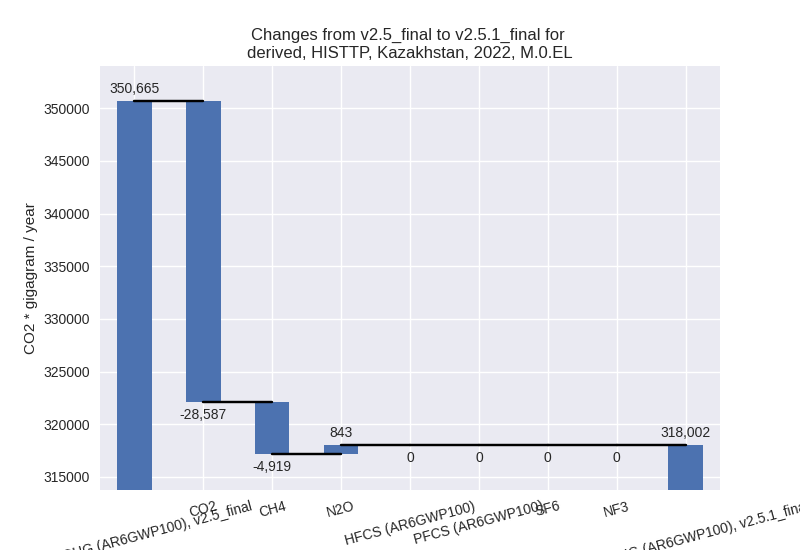
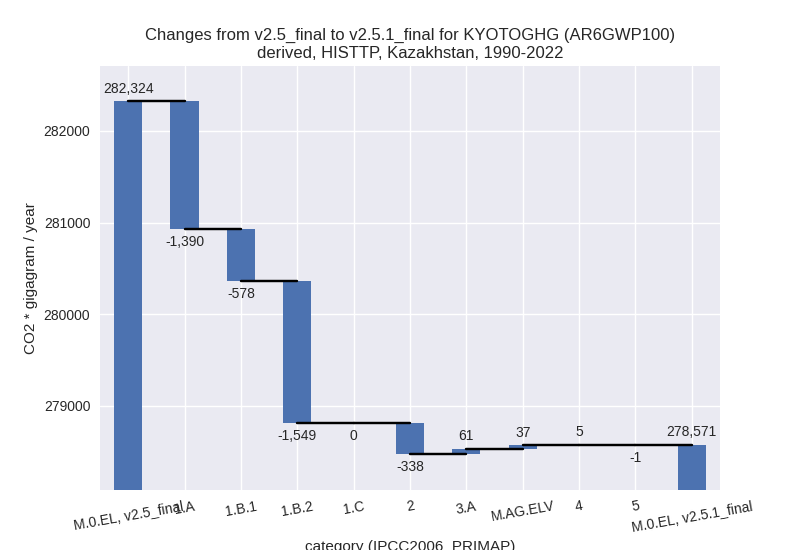
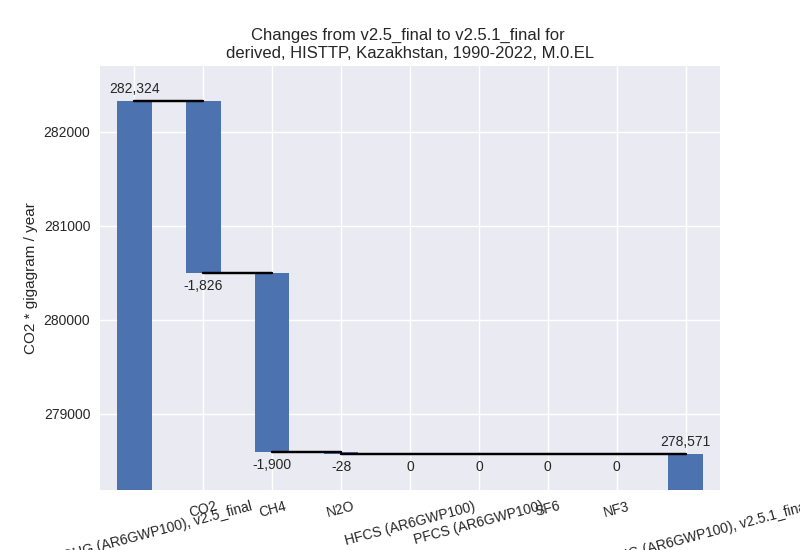
For each scenario and time frame the changes are displayed for all individual sectors and all individual gases. In the sector plot we use aggregate Kyoto GHGs in AR6GWP100. In the gas plot we usenational total emissions without LULUCF. ## country reported scenario
2022
1990-2022
third party scenario
2022

1990-2022
Detailed changes for the scenarios:
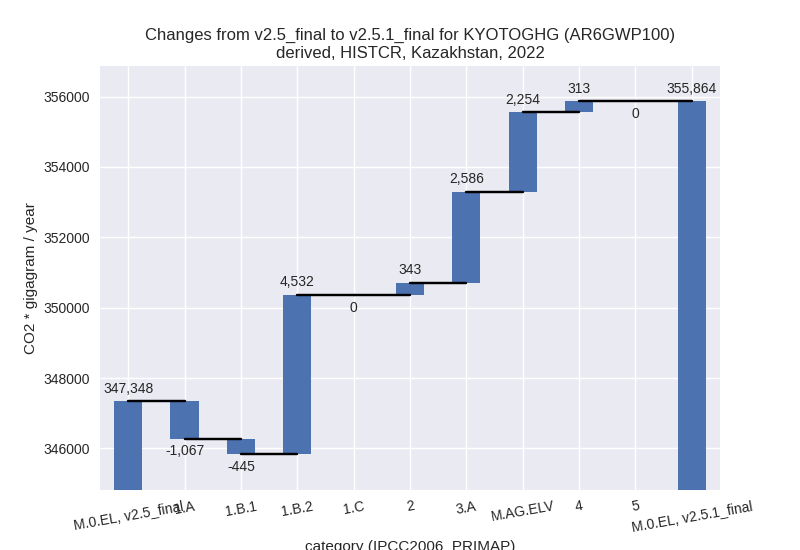
country reported scenario (HISTCR):
Most important changes per time frame
For 2022 the following sector-gas combinations have the highest absolute impact on national total KyotoGHG (AR6GWP100) emissions in 2022 (top 5):
- 1: 1.B.2, CH4 with 4535.83 Gg CO2 / year (24.4%)
- 2: 3.A, CH4 with 2353.96 Gg CO2 / year (9.3%)
- 3: M.AG.ELV, N2O with 2304.71 Gg CO2 / year (17.5%)
- 4: 1.A, CH4 with -1047.06 Gg CO2 / year (-54.8%)
- 5: 1.B.1, CH4 with -499.42 Gg CO2 / year (-5.4%)
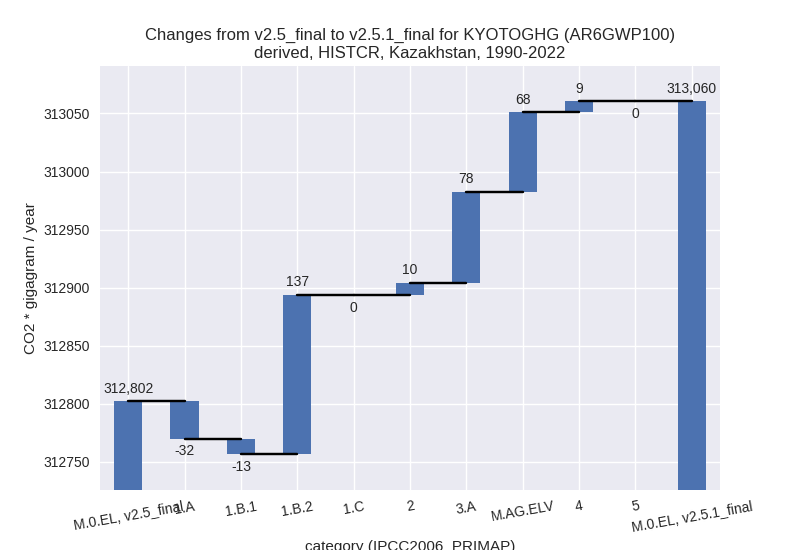
For 1990-2022 the following sector-gas combinations have the highest absolute impact on national total KyotoGHG (AR6GWP100) emissions in 1990-2022 (top 5):
- 1: 1.B.2, CH4 with 137.45 Gg CO2 / year (0.5%)
- 2: 3.A, CH4 with 71.33 Gg CO2 / year (0.4%)
- 3: M.AG.ELV, N2O with 69.84 Gg CO2 / year (0.3%)
- 4: 1.A, CH4 with -31.73 Gg CO2 / year (-2.6%)
- 5: 1.B.1, CH4 with -15.13 Gg CO2 / year (-0.1%)
Changes in the main sectors for aggregate KyotoGHG (AR6GWP100) are
- 1: Total sectoral emissions in 2022 are 274997.74 Gg CO2 / year which is 77.3% of M.0.EL emissions. 2022 Emissions have changed by 1.1% (3019.49 Gg CO2 / year). 1990-2022 Emissions have changed by 0.0% (91.50 Gg CO2 / year).
- 2: Total sectoral emissions in 2022 are 27799.70 Gg CO2 / year which is 7.8% of M.0.EL emissions. 2022 Emissions have changed by 1.3% (343.39 Gg CO2 / year). 1990-2022 Emissions have changed by 0.0% (10.41 Gg CO2 / year).
- M.AG: Total sectoral emissions in 2022 are 46074.52
Gg CO2 / year which is 12.9% of M.0.EL emissions. 2022 Emissions have
changed by 11.7% (4840.04 Gg CO2 /
year). 1990-2022 Emissions have changed by 0.3% (146.67 Gg CO2 / year). For 2022 the
changes per gas
are:

The changes come from the following subsectors:- 3.A: Total sectoral emissions in 2022 are 29996.48
Gg CO2 / year which is 65.1% of category M.AG emissions. 2022 Emissions
have changed by 9.4% (2586.49 Gg CO2
/ year). 1990-2022 Emissions have changed by 0.4% (78.38 Gg CO2 / year). For 2022 the
changes per gas
are:

There is no subsector information available in PRIMAP-hist. - M.AG.ELV: Total sectoral emissions in 2022 are
16078.04 Gg CO2 / year which is 34.9% of category M.AG emissions. 2022
Emissions have changed by 16.3%
(2253.56 Gg CO2 / year). 1990-2022 Emissions have changed by 0.3% (68.29 Gg CO2 / year). For 2022 the
changes per gas
are:

There is no subsector information available in PRIMAP-hist.
- 3.A: Total sectoral emissions in 2022 are 29996.48
Gg CO2 / year which is 65.1% of category M.AG emissions. 2022 Emissions
have changed by 9.4% (2586.49 Gg CO2
/ year). 1990-2022 Emissions have changed by 0.4% (78.38 Gg CO2 / year). For 2022 the
changes per gas
are:
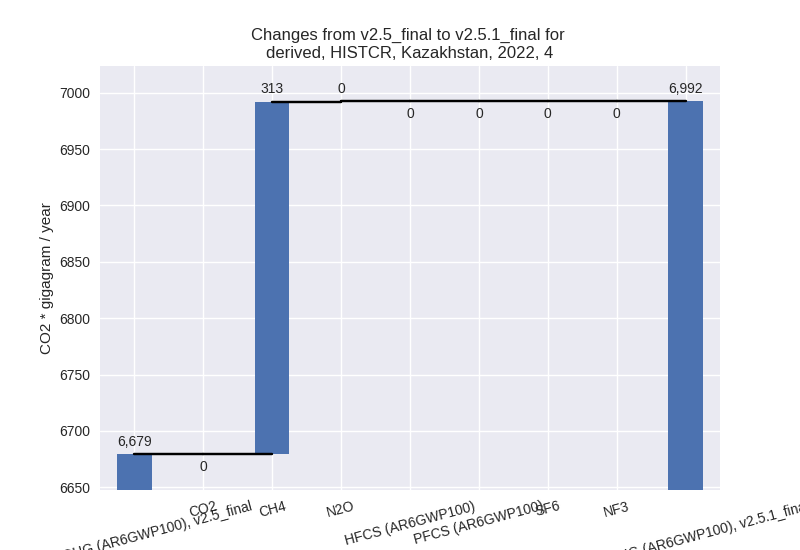
- 4: Total sectoral emissions in 2022 are 6992.34 Gg
CO2 / year which is 2.0% of M.0.EL emissions. 2022 Emissions have
changed by 4.7% (313.02 Gg CO2 /
year). 1990-2022 Emissions have changed by 0.2% (9.49 Gg CO2 / year). For 2022 the
changes per gas
are:
- 5: No data
third party scenario (HISTTP):
Most important changes per time frame
For 2022 the following sector-gas combinations have the highest absolute impact on national total KyotoGHG (AR6GWP100) emissions in 2022 (top 5):
- 1: 1.A, CO2 with -28872.31 Gg CO2 / year (-11.1%)
- 2: 1.B.2, CH4 with -4560.18 Gg CO2 / year (-21.9%)
- 3: 1.B.1, CH4 with -2274.74 Gg CO2 / year (-12.9%)
- 4: 3.A, CH4 with 1695.43 Gg CO2 / year (9.8%)
- 5: M.AG.ELV, CO2 with 435.34 Gg CO2 / year (2320.5%)
For 1990-2022 the following sector-gas combinations have the highest absolute impact on national total KyotoGHG (AR6GWP100) emissions in 1990-2022 (top 5):
- 1: 1.B.2, CH4 with -1548.76 Gg CO2 / year (-12.2%)
- 2: 1.A, CO2 with -1415.56 Gg CO2 / year (-0.7%)
- 3: 1.B.1, CH4 with -415.16 Gg CO2 / year (-2.1%)
- 4: 2, CO2 with -341.72 Gg CO2 / year (-5.7%)
- 5: 1.B.1, CO2 with -162.45 Gg CO2 / year (-5.3%)
Changes in the main sectors for aggregate KyotoGHG (AR6GWP100) are
- 1: Total sectoral emissions in 2022 are 267454.23
Gg CO2 / year which is 84.1% of M.0.EL emissions. 2022 Emissions have
changed by -11.7% (-35317.23 Gg CO2
/ year). 1990-2022 Emissions have changed by -1.4% (-3516.60 Gg CO2 / year). For 2022
the changes per gas
are:

The changes come from the following subsectors:- 1.A: Total sectoral emissions in 2022 are 233651.50
Gg CO2 / year which is 87.4% of category 1 emissions. 2022 Emissions
have changed by -10.9% (-28593.37 Gg
CO2 / year). 1990-2022 Emissions have changed by -0.7% (-1390.23 Gg CO2 / year). For 2022
the changes per gas
are:

There is no subsector information available in PRIMAP-hist. - 1.B.1: Total sectoral emissions in 2022 are
15575.10 Gg CO2 / year which is 5.8% of category 1 emissions. 2022
Emissions have changed by -12.2%
(-2164.22 Gg CO2 / year). 1990-2022 Emissions have changed by -2.5% (-577.61 Gg CO2 / year). For 2022
the changes per gas
are:
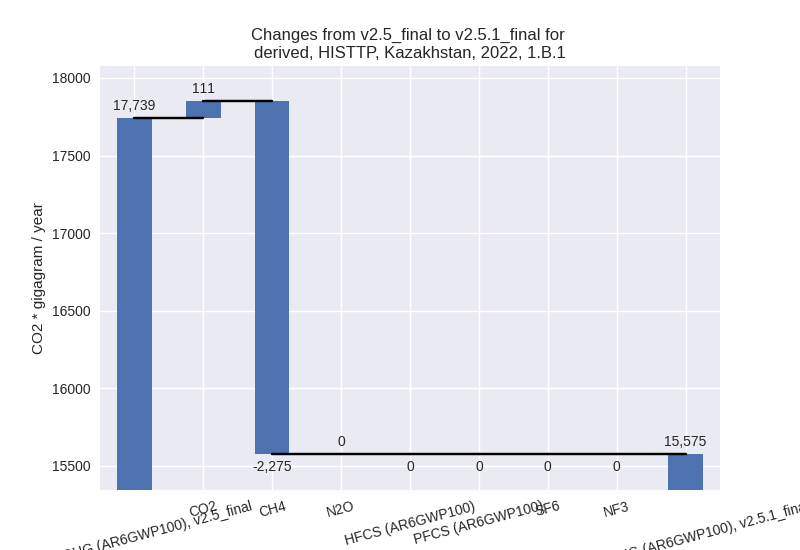
For 1990-2022 the changes per gas are: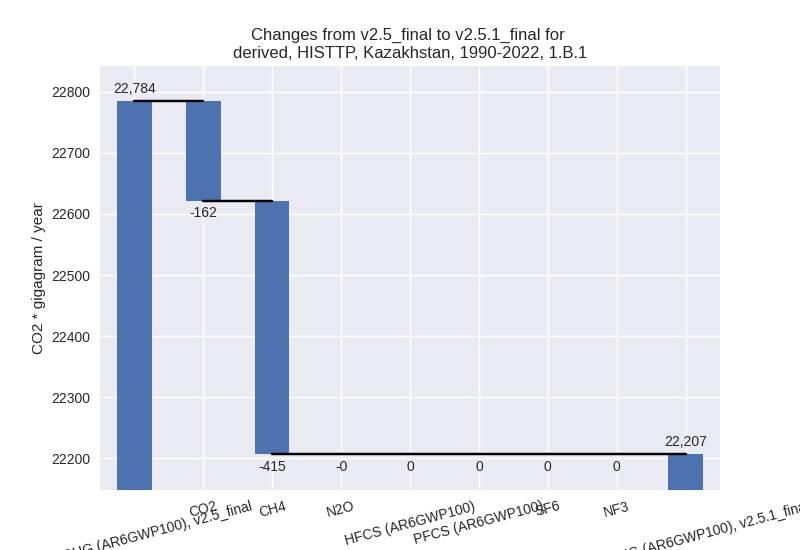
There is no subsector information available in PRIMAP-hist. - 1.B.2: Total sectoral emissions in 2022 are
18227.63 Gg CO2 / year which is 6.8% of category 1 emissions. 2022
Emissions have changed by -20.0%
(-4559.64 Gg CO2 / year). 1990-2022 Emissions have changed by -9.6% (-1548.76 Gg CO2 / year). For 2022
the changes per gas
are:

For 1990-2022 the changes per gas are: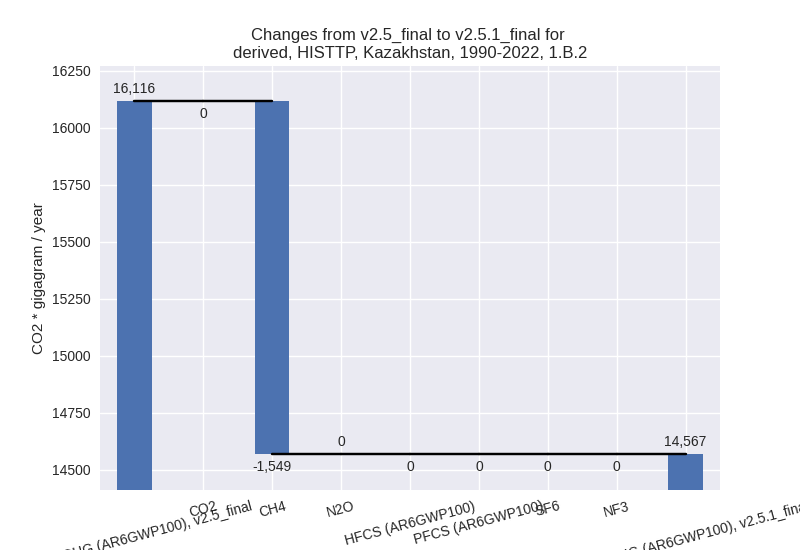
There is no subsector information available in PRIMAP-hist.
- 1.A: Total sectoral emissions in 2022 are 233651.50
Gg CO2 / year which is 87.4% of category 1 emissions. 2022 Emissions
have changed by -10.9% (-28593.37 Gg
CO2 / year). 1990-2022 Emissions have changed by -0.7% (-1390.23 Gg CO2 / year). For 2022
the changes per gas
are:
- 2: Total sectoral emissions in 2022 are 12171.82 Gg
CO2 / year which is 3.8% of M.0.EL emissions. 2022 Emissions have
changed by -2.0% (-254.50 Gg CO2 /
year). 1990-2022 Emissions have changed by -4.7% (-338.40 Gg CO2 / year). For 2022
the changes per gas
are:

For 1990-2022 the changes per gas are: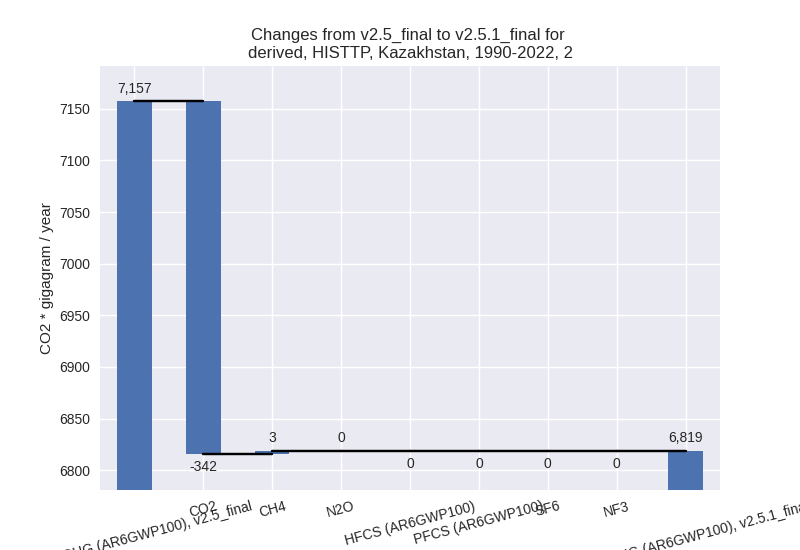
- M.AG: Total sectoral emissions in 2022 are 31967.80
Gg CO2 / year which is 10.1% of M.0.EL emissions. 2022 Emissions have
changed by 9.5% (2773.50 Gg CO2 /
year). 1990-2022 Emissions have changed by 0.4% (97.47 Gg CO2 / year). For 2022 the
changes per gas
are:
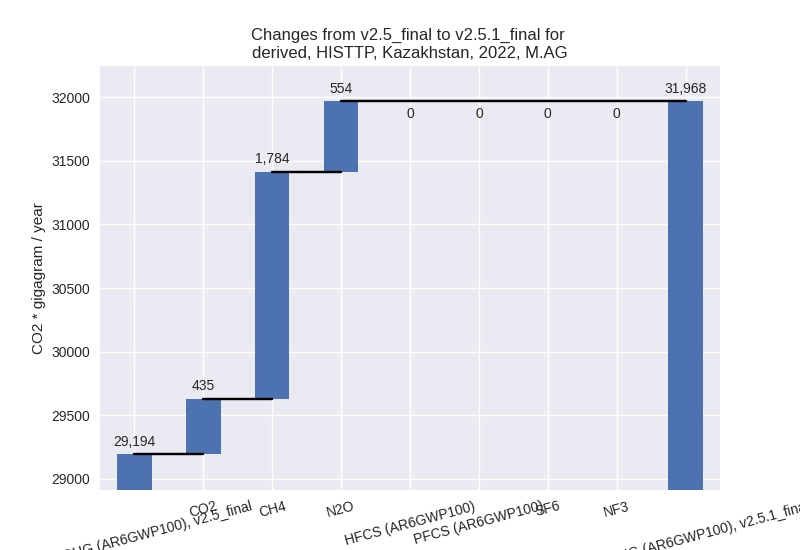
The changes come from the following subsectors:- 3.A: Total sectoral emissions in 2022 are 20552.05
Gg CO2 / year which is 64.3% of category M.AG emissions. 2022 Emissions
have changed by 9.8% (1832.12 Gg CO2
/ year). 1990-2022 Emissions have changed by 0.4% (60.62 Gg CO2 / year). For 2022 the
changes per gas
are:

There is no subsector information available in PRIMAP-hist. - M.AG.ELV: Total sectoral emissions in 2022 are
11415.75 Gg CO2 / year which is 35.7% of category M.AG emissions. 2022
Emissions have changed by 9.0%
(941.37 Gg CO2 / year). 1990-2022 Emissions have changed by 0.3% (36.85 Gg CO2 / year). For 2022 the
changes per gas
are:
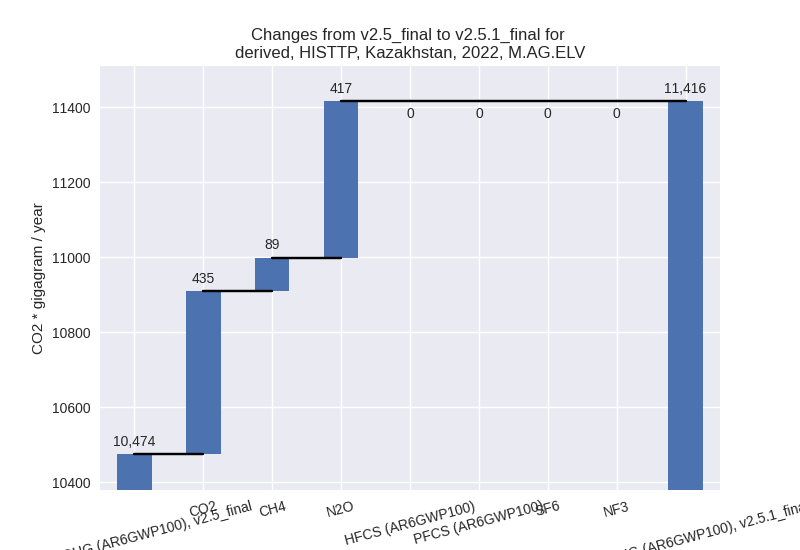
There is no subsector information available in PRIMAP-hist.
- 3.A: Total sectoral emissions in 2022 are 20552.05
Gg CO2 / year which is 64.3% of category M.AG emissions. 2022 Emissions
have changed by 9.8% (1832.12 Gg CO2
/ year). 1990-2022 Emissions have changed by 0.4% (60.62 Gg CO2 / year). For 2022 the
changes per gas
are:
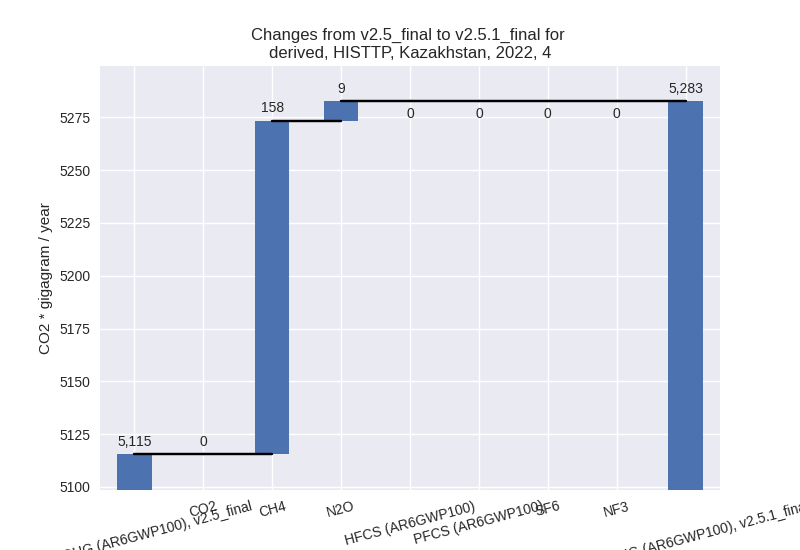
- 4: Total sectoral emissions in 2022 are 5282.58 Gg
CO2 / year which is 1.7% of M.0.EL emissions. 2022 Emissions have
changed by 3.3% (167.10 Gg CO2 /
year). 1990-2022 Emissions have changed by 0.1% (5.06 Gg CO2 / year). For 2022 the
changes per gas
are:
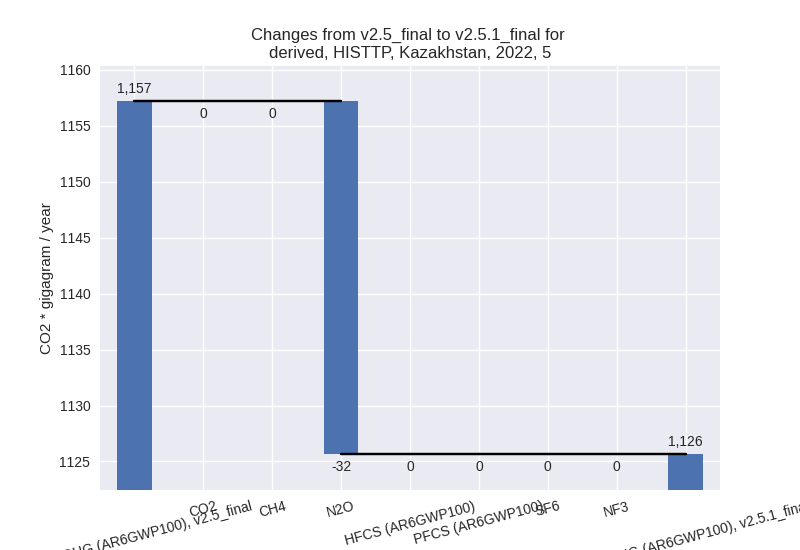
- 5: Total sectoral emissions in 2022 are 1125.65 Gg
CO2 / year which is 0.4% of M.0.EL emissions. 2022 Emissions have
changed by -2.7% (-31.54 Gg CO2 /
year). 1990-2022 Emissions have changed by -0.1% (-0.96 Gg CO2 / year). For 2022 the
changes per gas
are: