Changes in PRIMAP-hist v2.5.1_final compared to v2.5_final for Cambodia
2024-02-29
Johannes Gütschow
Change analysis for Cambodia for PRIMAP-hist v2.5.1_final compared to v2.5_final
Overview over emissions by sector and gas
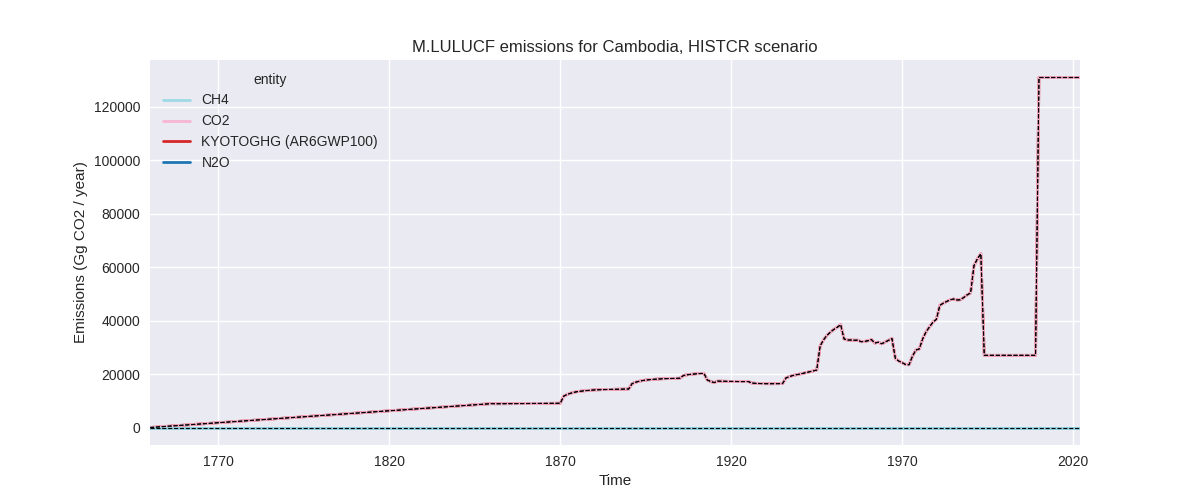
The following figures show the aggregate national total emissions excluding LULUCF AR6GWP100 for the country reported priority scenario. The dotted linesshow the v2.5_final data.
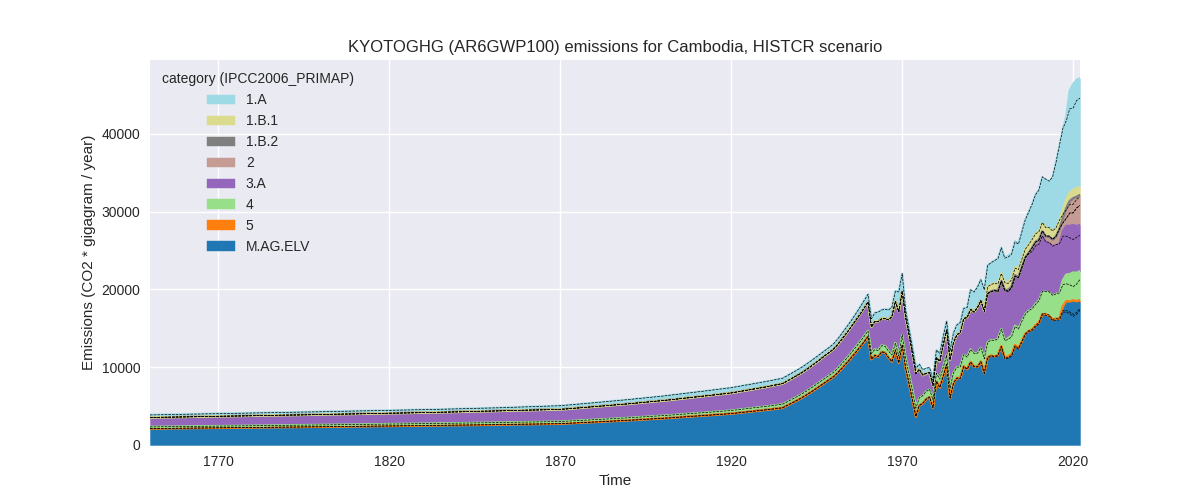

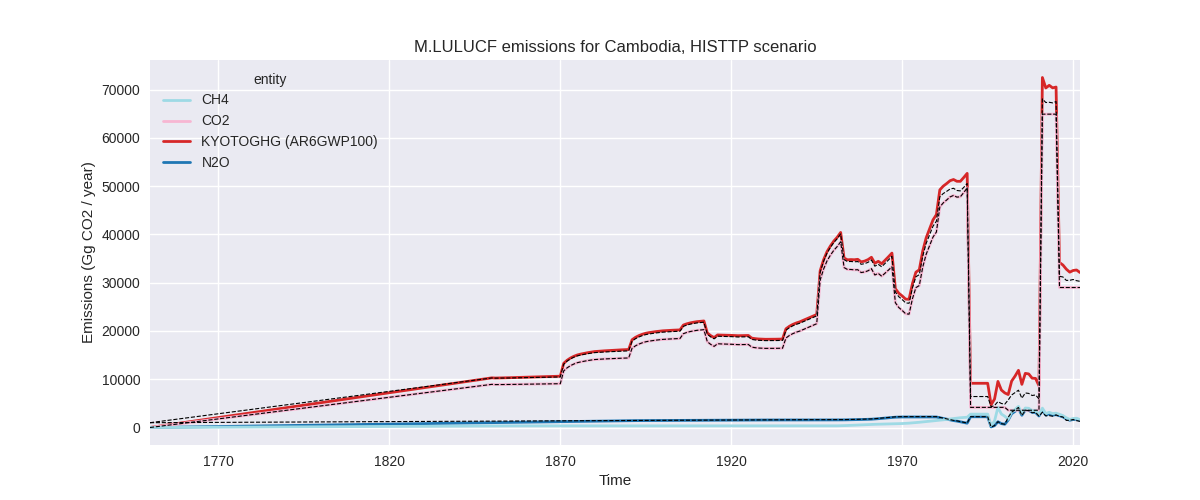
The following figures show the aggregate national total emissions excluding LULUCF AR6GWP100 for the third party priority scenario. The dotted linesshow the v2.5_final data.


Overview over changes
In the country reported priority scenario we have the following changes for aggregate Kyoto GHG and national total emissions excluding LULUCF (M.0.EL):
- Emissions in 2022 have changed by 5.7%% (2542.98 Gg CO2 / year)
- Emissions in 1990-2022 have changed by 1.1%% (331.58 Gg CO2 / year)
In the third party priority scenario we have the following changes for aggregate Kyoto GHG and national total emissions excluding LULUCF (M.0.EL):
- Emissions in 2022 have changed by 6.6%% (3128.57 Gg CO2 / year)
- Emissions in 1990-2022 have changed by 1.5%% (450.02 Gg CO2 / year)
Most important changes per scenario and time frame
In the country reported priority scenario the following sector-gas combinations have the highest absolute impact on national total KyotoGHG (AR6GWP100) emissions in 2022 (top 5):
- 1: 1.A, CO2 with 1250.21 Gg CO2 / year (10.6%)
- 2: M.AG.ELV, CH4 with 1075.97 Gg CO2 / year (7.7%)
- 3: 3.A, CH4 with 235.69 Gg CO2 / year (4.7%)
- 4: 5, N2O with -44.54 Gg CO2 / year (-17.1%)
- 5: 4, CO2 with 42.74 Gg CO2 / year (4.5%)
In the country reported priority scenario the following sector-gas combinations have the highest absolute impact on national total KyotoGHG (AR6GWP100) emissions in 1990-2022 (top 5):
- 1: M.AG.ELV, CH4 with 208.97 Gg CO2 / year (1.9%)
- 2: 1.A, CO2 with 91.09 Gg CO2 / year (1.9%)
- 3: 3.A, CH4 with 17.60 Gg CO2 / year (0.3%)
- 4: M.AG.ELV, N2O with 16.35 Gg CO2 / year (0.6%)
- 5: 1.B.1, CH4 with -2.48 Gg CO2 / year (-0.3%)
In the third party priority scenario the following sector-gas combinations have the highest absolute impact on national total KyotoGHG (AR6GWP100) emissions in 2022 (top 5):
- 1: 1.A, CO2 with 1864.53 Gg CO2 / year (15.3%)
- 2: M.AG.ELV, CH4 with 1075.97 Gg CO2 / year (7.7%)
- 3: 3.A, CH4 with 235.69 Gg CO2 / year (4.7%)
- 4: 5, N2O with -44.54 Gg CO2 / year (-17.1%)
- 5: 3.A, N2O with 29.20 Gg CO2 / year (4.6%)
In the third party priority scenario the following sector-gas combinations have the highest absolute impact on national total KyotoGHG (AR6GWP100) emissions in 1990-2022 (top 5):
- 1: 1.A, CO2 with 211.95 Gg CO2 / year (4.5%)
- 2: M.AG.ELV, CH4 with 208.97 Gg CO2 / year (1.9%)
- 3: 3.A, CH4 with 17.60 Gg CO2 / year (0.3%)
- 4: M.AG.ELV, N2O with 16.35 Gg CO2 / year (0.6%)
- 5: 2, CO2 with -3.58 Gg CO2 / year (-0.3%)
Notes on data changes
Here we list notes explaining important emissions changes for the country. ’' means that the following text only applies to the TP time series, while means that it only applies to the CR scenario. Otherwise the note applies to both scenarios.
- 1.A, CO2: CDIAC 2023 shows a continued steep emission increase which is not present in the EI 2023 data that is used to extend CDIAC 2020 in PRIMAP-hist v2.5. Thus emissions for the latest years are higher in PRIMAP-hist v2.5.1.
- M.AG.ELV, CH4: Emissions for the last years are higher in FAO 2023 than in FAO2022.
Changes by sector and gas
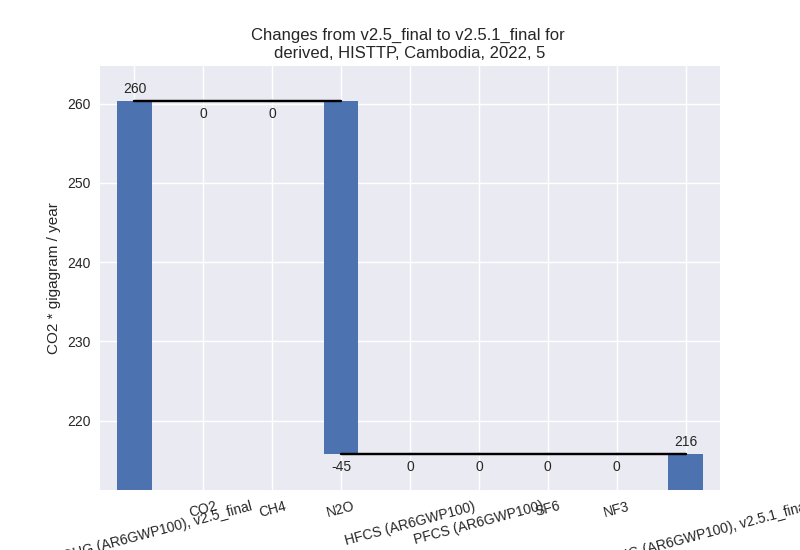
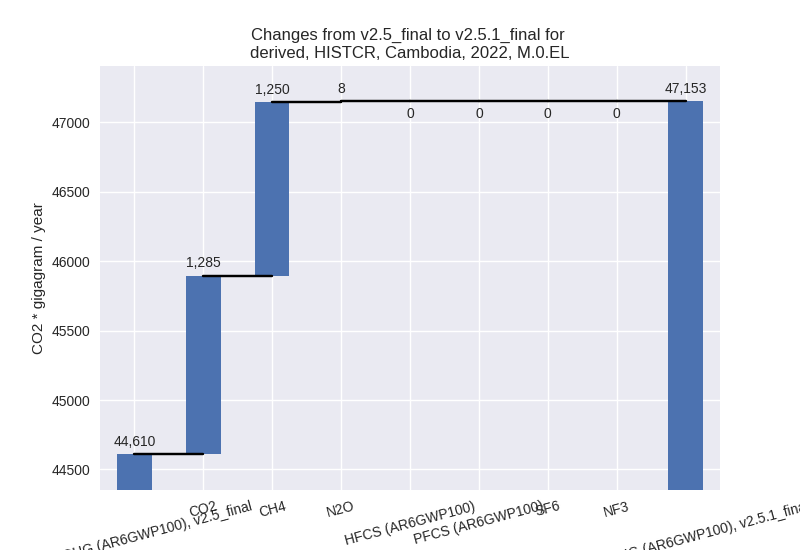
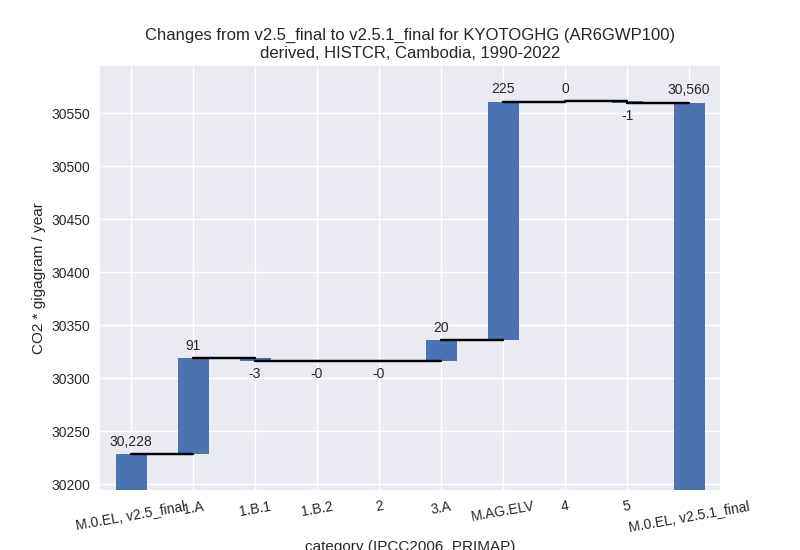
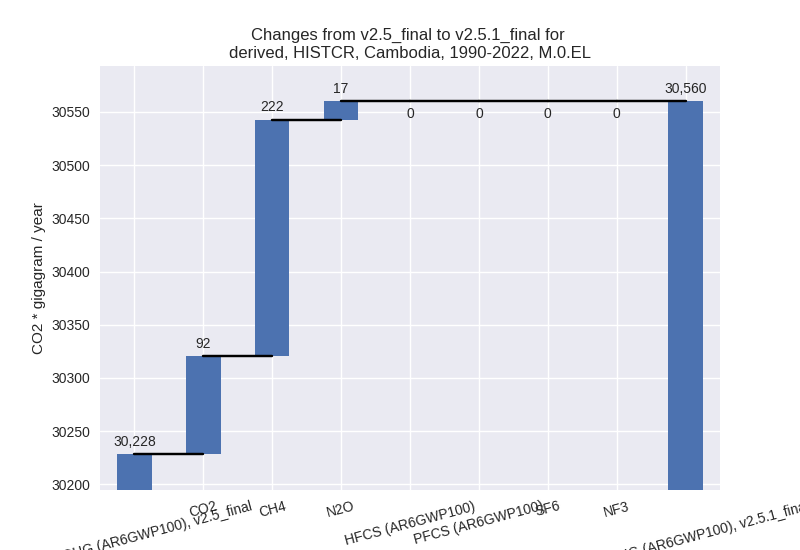
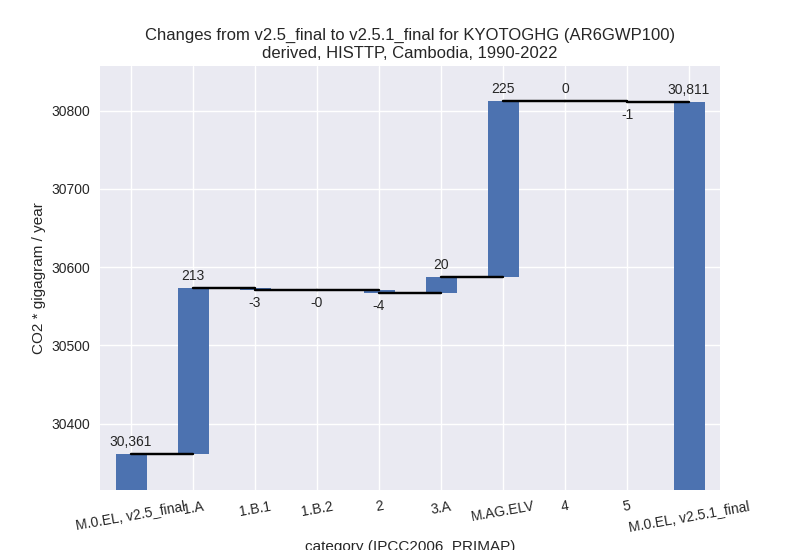
For each scenario and time frame the changes are displayed for all individual sectors and all individual gases. In the sector plot we use aggregate Kyoto GHGs in AR6GWP100. In the gas plot we usenational total emissions without LULUCF. ## country reported scenario
2022

1990-2022
third party scenario
2022


1990-2022

Detailed changes for the scenarios:
country reported scenario (HISTCR):
Most important changes per time frame
For 2022 the following sector-gas combinations have the highest absolute impact on national total KyotoGHG (AR6GWP100) emissions in 2022 (top 5):
- 1: 1.A, CO2 with 1250.21 Gg CO2 / year (10.6%)
- 2: M.AG.ELV, CH4 with 1075.97 Gg CO2 / year (7.7%)
- 3: 3.A, CH4 with 235.69 Gg CO2 / year (4.7%)
- 4: 5, N2O with -44.54 Gg CO2 / year (-17.1%)
- 5: 4, CO2 with 42.74 Gg CO2 / year (4.5%)
For 1990-2022 the following sector-gas combinations have the highest absolute impact on national total KyotoGHG (AR6GWP100) emissions in 1990-2022 (top 5):
- 1: M.AG.ELV, CH4 with 208.97 Gg CO2 / year (1.9%)
- 2: 1.A, CO2 with 91.09 Gg CO2 / year (1.9%)
- 3: 3.A, CH4 with 17.60 Gg CO2 / year (0.3%)
- 4: M.AG.ELV, N2O with 16.35 Gg CO2 / year (0.6%)
- 5: 1.B.1, CH4 with -2.48 Gg CO2 / year (-0.3%)
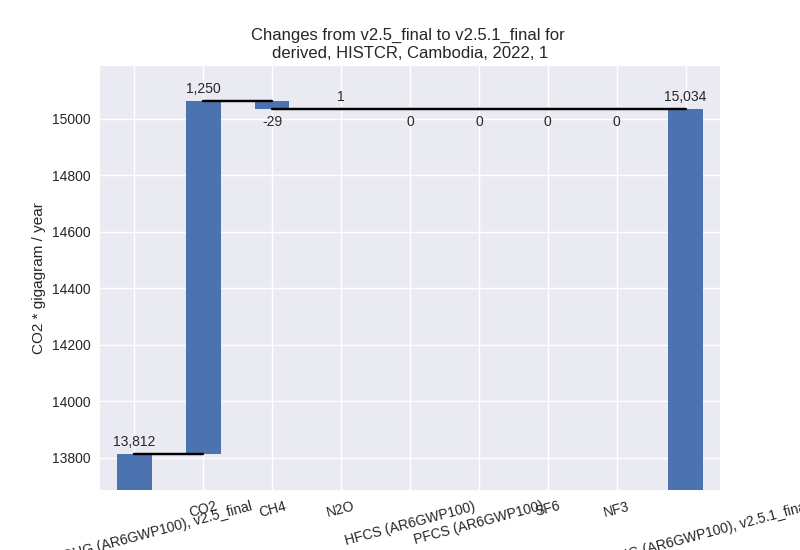
Changes in the main sectors for aggregate KyotoGHG (AR6GWP100) are
- 1: Total sectoral emissions in 2022 are 15034.00 Gg
CO2 / year which is 31.9% of M.0.EL emissions. 2022 Emissions have
changed by 8.8% (1222.01 Gg CO2 /
year). 1990-2022 Emissions have changed by 1.3% (87.99 Gg CO2 / year). For 2022 the
changes per gas
are:
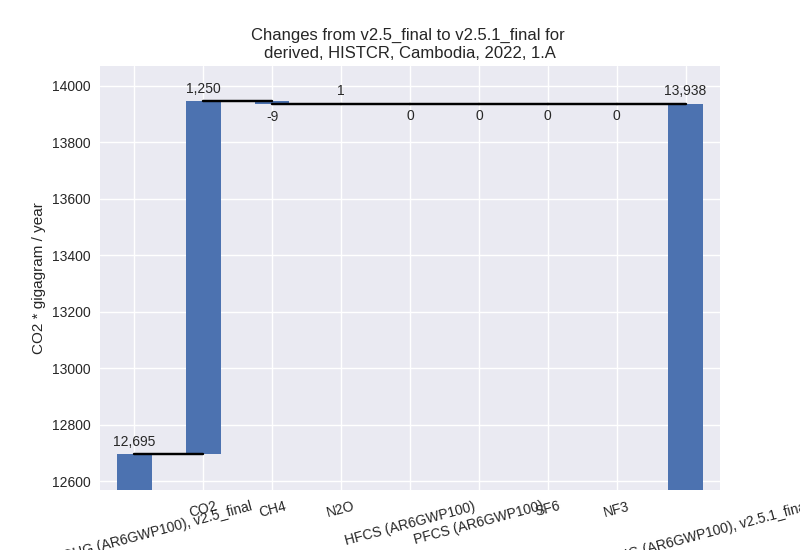
The changes come from the following subsectors:- 1.A: Total sectoral emissions in 2022 are 13937.52
Gg CO2 / year which is 92.7% of category 1 emissions. 2022 Emissions
have changed by 9.8% (1242.23 Gg CO2
/ year). 1990-2022 Emissions have changed by 1.6% (90.54 Gg CO2 / year). For 2022 the
changes per gas
are:
There is no subsector information available in PRIMAP-hist. - 1.B.1: Total sectoral emissions in 2022 are 1071.37 Gg CO2 / year which is 7.1% of category 1 emissions. 2022 Emissions have changed by -1.9% (-20.20 Gg CO2 / year). 1990-2022 Emissions have changed by -0.3% (-2.54 Gg CO2 / year).
- 1.B.2: Total sectoral emissions in 2022 are 25.11 Gg CO2 / year which is 0.2% of category 1 emissions. 2022 Emissions have changed by -0.1% (-0.02 Gg CO2 / year). 1990-2022 Emissions have changed by -0.1% (-0.01 Gg CO2 / year).
- 1.A: Total sectoral emissions in 2022 are 13937.52
Gg CO2 / year which is 92.7% of category 1 emissions. 2022 Emissions
have changed by 9.8% (1242.23 Gg CO2
/ year). 1990-2022 Emissions have changed by 1.6% (90.54 Gg CO2 / year). For 2022 the
changes per gas
are:
- 2: Total sectoral emissions in 2022 are 3812.91 Gg CO2 / year which is 8.1% of M.0.EL emissions. 2022 Emissions have changed by -0.2% (-7.94 Gg CO2 / year). 1990-2022 Emissions have changed by -0.0% (-0.27 Gg CO2 / year).
- M.AG: Total sectoral emissions in 2022 are 24370.38
Gg CO2 / year which is 51.7% of M.0.EL emissions. 2022 Emissions have
changed by 5.9% (1365.01 Gg CO2 /
year). 1990-2022 Emissions have changed by 1.2% (244.96 Gg CO2 / year). For 2022 the
changes per gas
are:

The changes come from the following subsectors:- 3.A: Total sectoral emissions in 2022 are 5950.06
Gg CO2 / year which is 24.4% of category M.AG emissions. 2022 Emissions
have changed by 4.7% (264.88 Gg CO2
/ year). 1990-2022 Emissions have changed by 0.3% (19.64 Gg CO2 / year). For 2022 the
changes per gas
are:

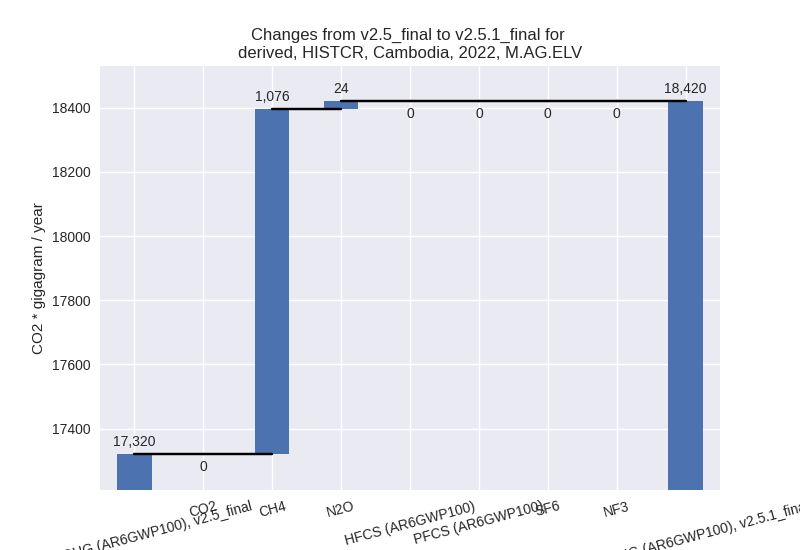
There is no subsector information available in PRIMAP-hist. - M.AG.ELV: Total sectoral emissions in 2022 are
18420.32 Gg CO2 / year which is 75.6% of category M.AG emissions. 2022
Emissions have changed by 6.4%
(1100.12 Gg CO2 / year). 1990-2022 Emissions have changed by 1.6% (225.32 Gg CO2 / year). For 2022 the
changes per gas
are:
There is no subsector information available in PRIMAP-hist.
- 3.A: Total sectoral emissions in 2022 are 5950.06
Gg CO2 / year which is 24.4% of category M.AG emissions. 2022 Emissions
have changed by 4.7% (264.88 Gg CO2
/ year). 1990-2022 Emissions have changed by 0.3% (19.64 Gg CO2 / year). For 2022 the
changes per gas
are:
- 4: Total sectoral emissions in 2022 are 3719.73 Gg CO2 / year which is 7.9% of M.0.EL emissions. 2022 Emissions have changed by 0.2% (8.44 Gg CO2 / year). 1990-2022 Emissions have changed by 0.0% (0.26 Gg CO2 / year).
- 5: Total sectoral emissions in 2022 are 215.75 Gg
CO2 / year which is 0.5% of M.0.EL emissions. 2022 Emissions have
changed by -17.1% (-44.54 Gg CO2 /
year). 1990-2022 Emissions have changed by -1.0% (-1.35 Gg CO2 / year). For 2022 the
changes per gas
are:

third party scenario (HISTTP):
Most important changes per time frame
For 2022 the following sector-gas combinations have the highest absolute impact on national total KyotoGHG (AR6GWP100) emissions in 2022 (top 5):
- 1: 1.A, CO2 with 1864.53 Gg CO2 / year (15.3%)
- 2: M.AG.ELV, CH4 with 1075.97 Gg CO2 / year (7.7%)
- 3: 3.A, CH4 with 235.69 Gg CO2 / year (4.7%)
- 4: 5, N2O with -44.54 Gg CO2 / year (-17.1%)
- 5: 3.A, N2O with 29.20 Gg CO2 / year (4.6%)
For 1990-2022 the following sector-gas combinations have the highest absolute impact on national total KyotoGHG (AR6GWP100) emissions in 1990-2022 (top 5):
- 1: 1.A, CO2 with 211.95 Gg CO2 / year (4.5%)
- 2: M.AG.ELV, CH4 with 208.97 Gg CO2 / year (1.9%)
- 3: 3.A, CH4 with 17.60 Gg CO2 / year (0.3%)
- 4: M.AG.ELV, N2O with 16.35 Gg CO2 / year (0.6%)
- 5: 2, CO2 with -3.58 Gg CO2 / year (-0.3%)
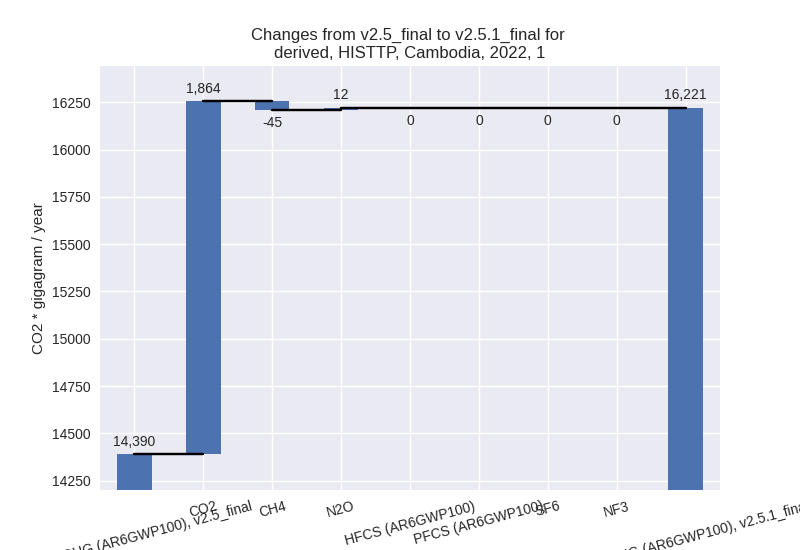
Changes in the main sectors for aggregate KyotoGHG (AR6GWP100) are
- 1: Total sectoral emissions in 2022 are 16221.22 Gg
CO2 / year which is 32.0% of M.0.EL emissions. 2022 Emissions have
changed by 12.7% (1830.81 Gg CO2 /
year). 1990-2022 Emissions have changed by 3.3% (209.95 Gg CO2 / year). For 2022 the
changes per gas
are:
For 1990-2022 the changes per gas are:
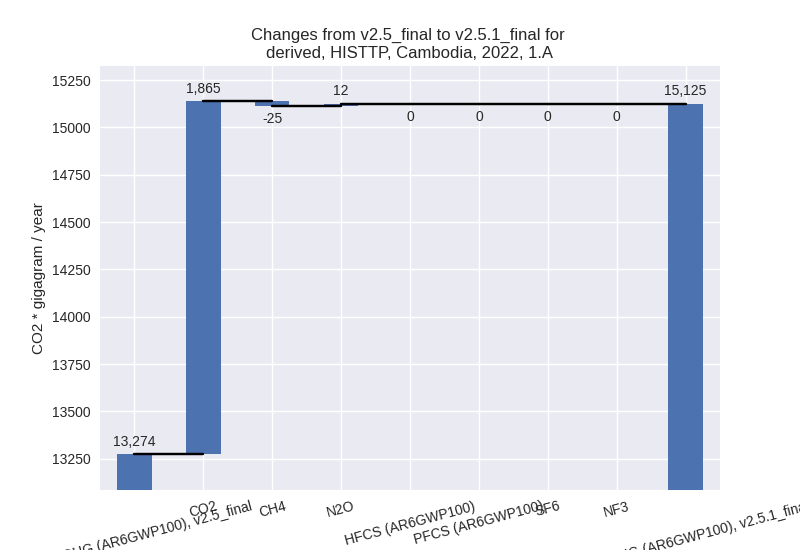
The changes come from the following subsectors:- 1.A: Total sectoral emissions in 2022 are 15124.74
Gg CO2 / year which is 93.2% of category 1 emissions. 2022 Emissions
have changed by 13.9% (1851.02 Gg
CO2 / year). 1990-2022 Emissions have changed by 3.8% (212.51 Gg CO2 / year). For 2022 the
changes per gas
are:
For 1990-2022 the changes per gas are:
There is no subsector information available in PRIMAP-hist. - 1.B.1: Total sectoral emissions in 2022 are 1071.37 Gg CO2 / year which is 6.6% of category 1 emissions. 2022 Emissions have changed by -1.9% (-20.20 Gg CO2 / year). 1990-2022 Emissions have changed by -0.3% (-2.54 Gg CO2 / year).
- 1.B.2: Total sectoral emissions in 2022 are 25.11 Gg CO2 / year which is 0.2% of category 1 emissions. 2022 Emissions have changed by -0.1% (-0.02 Gg CO2 / year). 1990-2022 Emissions have changed by -0.1% (-0.01 Gg CO2 / year).
- 1.A: Total sectoral emissions in 2022 are 15124.74
Gg CO2 / year which is 93.2% of category 1 emissions. 2022 Emissions
have changed by 13.9% (1851.02 Gg
CO2 / year). 1990-2022 Emissions have changed by 3.8% (212.51 Gg CO2 / year). For 2022 the
changes per gas
are:
- 2: Total sectoral emissions in 2022 are 6537.64 Gg CO2 / year which is 12.9% of M.0.EL emissions. 2022 Emissions have changed by -0.4% (-24.12 Gg CO2 / year). 1990-2022 Emissions have changed by -0.3% (-3.58 Gg CO2 / year).
- M.AG: Total sectoral emissions in 2022 are 24370.38
Gg CO2 / year which is 48.1% of M.0.EL emissions. 2022 Emissions have
changed by 5.9% (1365.01 Gg CO2 /
year). 1990-2022 Emissions have changed by 1.2% (244.96 Gg CO2 / year). For 2022 the
changes per gas
are:

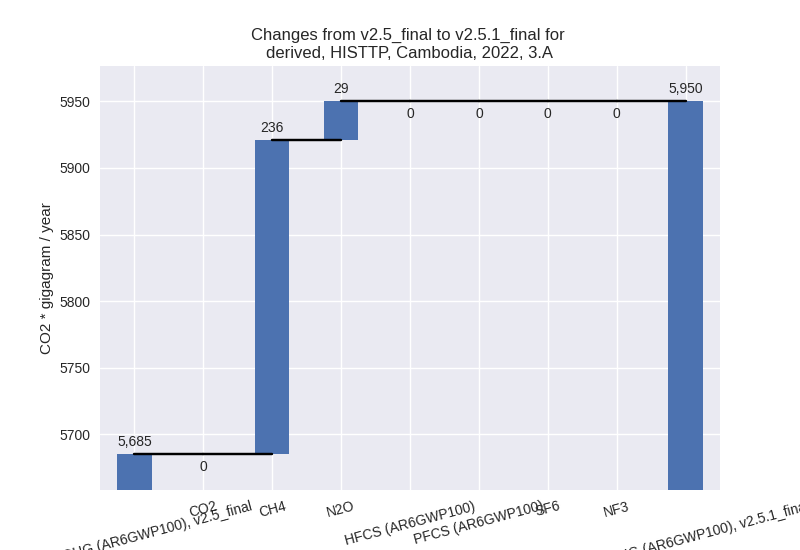
The changes come from the following subsectors:- 3.A: Total sectoral emissions in 2022 are 5950.06
Gg CO2 / year which is 24.4% of category M.AG emissions. 2022 Emissions
have changed by 4.7% (264.88 Gg CO2
/ year). 1990-2022 Emissions have changed by 0.3% (19.64 Gg CO2 / year). For 2022 the
changes per gas
are:
There is no subsector information available in PRIMAP-hist. - M.AG.ELV: Total sectoral emissions in 2022 are
18420.32 Gg CO2 / year which is 75.6% of category M.AG emissions. 2022
Emissions have changed by 6.4%
(1100.12 Gg CO2 / year). 1990-2022 Emissions have changed by 1.6% (225.32 Gg CO2 / year). For 2022 the
changes per gas
are:

There is no subsector information available in PRIMAP-hist.
- 3.A: Total sectoral emissions in 2022 are 5950.06
Gg CO2 / year which is 24.4% of category M.AG emissions. 2022 Emissions
have changed by 4.7% (264.88 Gg CO2
/ year). 1990-2022 Emissions have changed by 0.3% (19.64 Gg CO2 / year). For 2022 the
changes per gas
are:
- 4: Total sectoral emissions in 2022 are 3349.38 Gg CO2 / year which is 6.6% of M.0.EL emissions. 2022 Emissions have changed by 0.0% (1.42 Gg CO2 / year). 1990-2022 Emissions have changed by 0.0% (0.04 Gg CO2 / year).
- 5: Total sectoral emissions in 2022 are 215.75 Gg
CO2 / year which is 0.4% of M.0.EL emissions. 2022 Emissions have
changed by -17.1% (-44.54 Gg CO2 /
year). 1990-2022 Emissions have changed by -1.0% (-1.35 Gg CO2 / year). For 2022 the
changes per gas
are: