Changes in PRIMAP-hist v2.5.1_final compared to v2.5_final for Kiribati
2024-02-29
Johannes Gütschow
Change analysis for Kiribati for PRIMAP-hist v2.5.1_final compared to v2.5_final
Overview over emissions by sector and gas
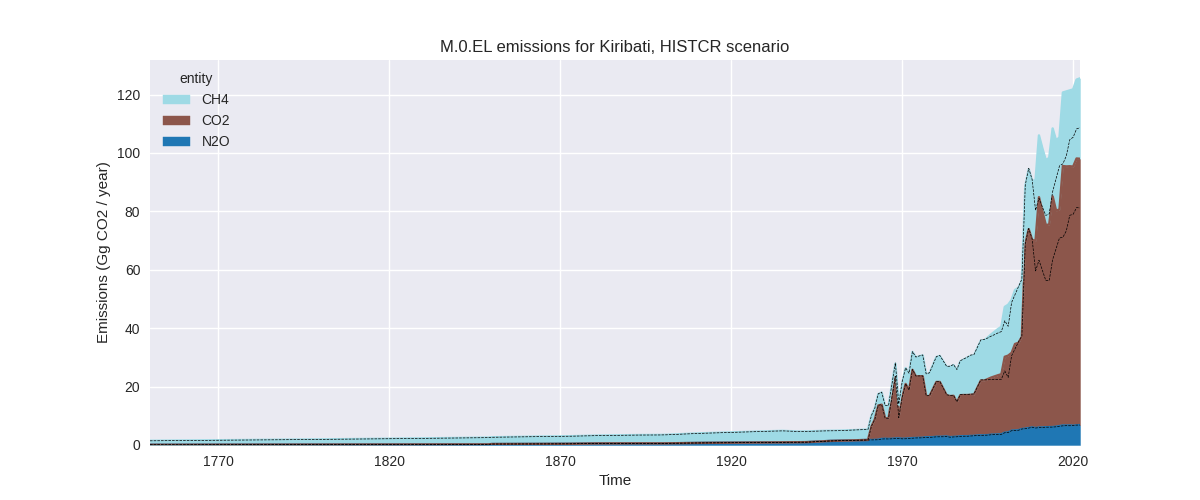
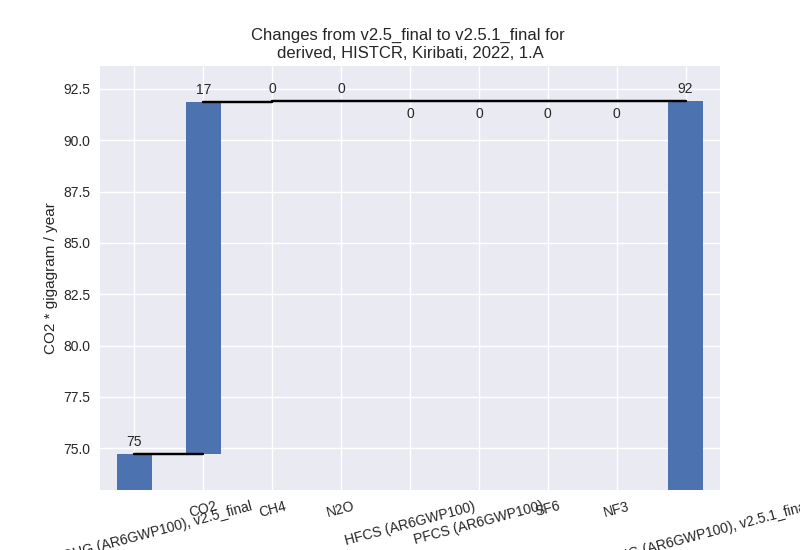
The following figures show the aggregate national total emissions excluding LULUCF AR6GWP100 for the country reported priority scenario. The dotted linesshow the v2.5_final data.


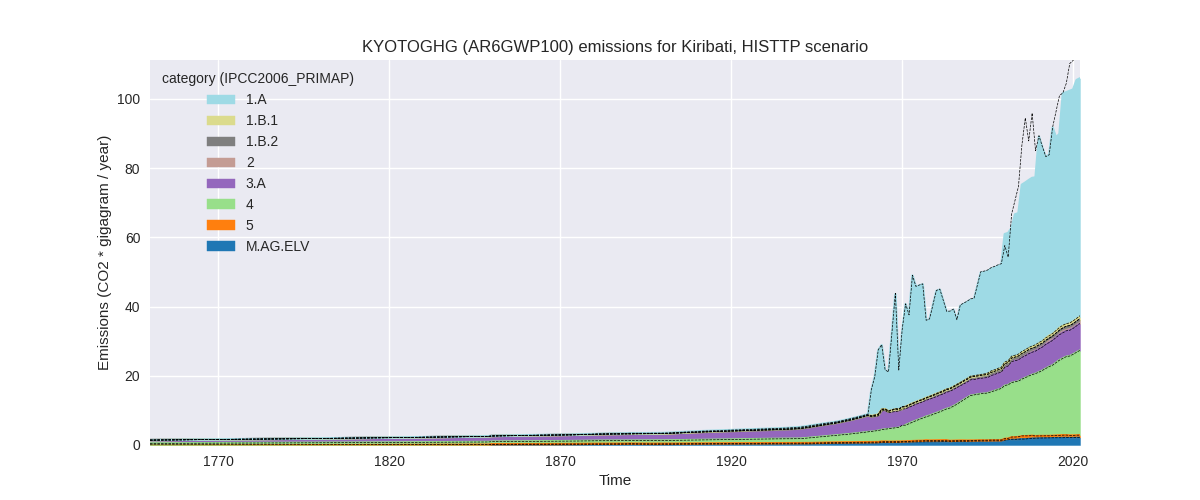
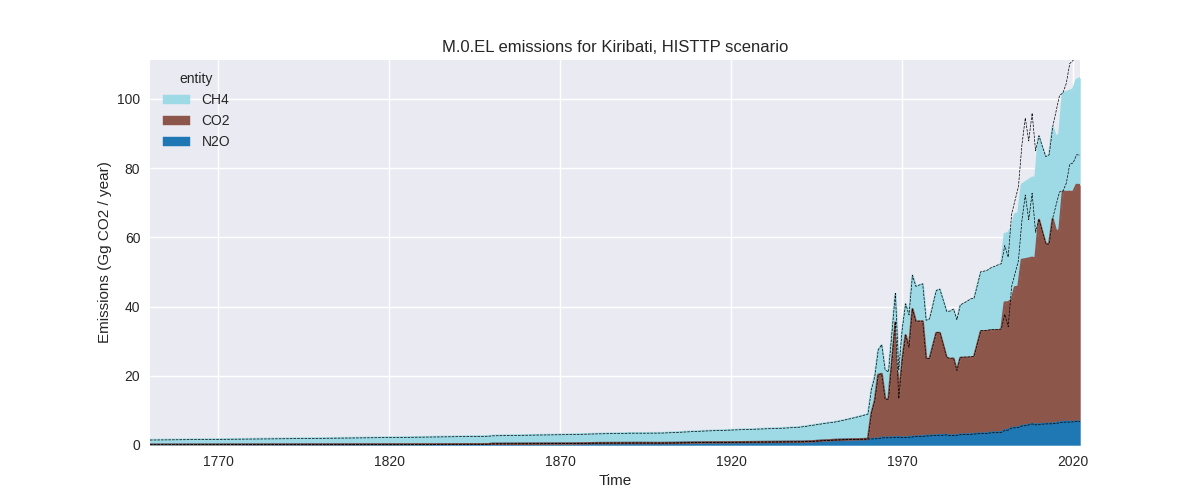
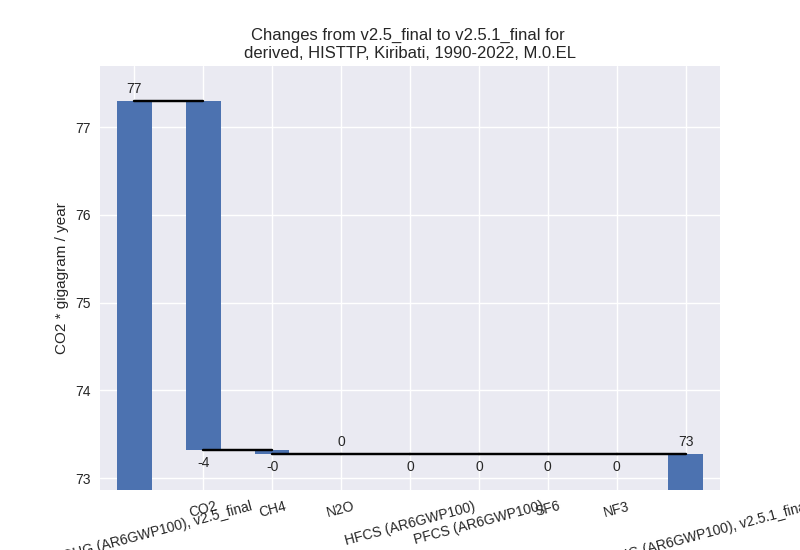
The following figures show the aggregate national total emissions excluding LULUCF AR6GWP100 for the third party priority scenario. The dotted linesshow the v2.5_final data.
Overview over changes
In the country reported priority scenario we have the following changes for aggregate Kyoto GHG and national total emissions excluding LULUCF (M.0.EL):
- Emissions in 2022 have changed by 15.6%% (16.91 Gg CO2 / year)
- Emissions in 1990-2022 have changed by 11.8%% (7.99 Gg CO2 / year)
In the third party priority scenario we have the following changes for aggregate Kyoto GHG and national total emissions excluding LULUCF (M.0.EL):
- Emissions in 2022 have changed by -7.6%% (-8.71 Gg CO2 / year)
- Emissions in 1990-2022 have changed by -5.2%% (-4.02 Gg CO2 / year)
Most important changes per scenario and time frame
In the country reported priority scenario the following sector-gas combinations have the highest absolute impact on national total KyotoGHG (AR6GWP100) emissions in 2022 (top 5):
- 1: 1.A, CO2 with 17.15 Gg CO2 / year (23.3%)
- 2: 2, CO2 with -0.31 Gg CO2 / year (-43.9%)
- 3: 3.A, CH4 with 0.05 Gg CO2 / year (1.6%)
- 4: 1.A, CH4 with 0.04 Gg CO2 / year (9.3%)
- 5: M.AG.ELV, CH4 with -0.04 Gg CO2 / year (-100.0%)
In the country reported priority scenario the following sector-gas combinations have the highest absolute impact on national total KyotoGHG (AR6GWP100) emissions in 1990-2022 (top 5):
- 1: 1.A, CO2 with 8.28 Gg CO2 / year (19.7%)
- 2: 2, CO2 with -0.25 Gg CO2 / year (-42.3%)
- 3: M.AG.ELV, CH4 with -0.07 Gg CO2 / year (-82.0%)
- 4: 1.A, CH4 with 0.01 Gg CO2 / year (2.8%)
- 5: 1.B.1, CH4 with 0.01 Gg CO2 / year (1.4%)
In the third party priority scenario the following sector-gas combinations have the highest absolute impact on national total KyotoGHG (AR6GWP100) emissions in 2022 (top 5):
- 1: 1.A, CO2 with -8.35 Gg CO2 / year (-11.0%)
- 2: 2, CO2 with -0.31 Gg CO2 / year (-43.9%)
- 3: 3.A, CH4 with -0.07 Gg CO2 / year (-1.0%)
- 4: 1.A, CH4 with 0.04 Gg CO2 / year (9.3%)
- 5: M.AG.ELV, CH4 with -0.04 Gg CO2 / year (-100.0%)
In the third party priority scenario the following sector-gas combinations have the highest absolute impact on national total KyotoGHG (AR6GWP100) emissions in 1990-2022 (top 5):
- 1: 1.A, CO2 with -3.73 Gg CO2 / year (-7.6%)
- 2: 2, CO2 with -0.25 Gg CO2 / year (-42.3%)
- 3: M.AG.ELV, CH4 with -0.07 Gg CO2 / year (-82.0%)
- 4: 1.A, CH4 with 0.01 Gg CO2 / year (2.8%)
- 5: 1.B.1, CH4 with 0.01 Gg CO2 / year (1.4%)
Notes on data changes
Here we list notes explaining important emissions changes for the country. ’' means that the following text only applies to the TP time series, while means that it only applies to the CR scenario. Otherwise the note applies to both scenarios.
- 1.A, CO2: /CR/ The new CDIAC data differs from the data used in v2.5 especially in the period before 2010. This impacts harmonization to country reported data which are only available until 2008 leading to higher post 2008 emissions in v2.5.1. /TP/ While the new CDIAC data continues the old CDIAC 2020 data with constant emissions until 2020 the additional years change the point of harmonization of EI data and thus 2022 emissions. cumulative emissions change mostly due to changes in CDIAC emissions for earlier years.
- 2, CO2: Emissions in 2.D (non-energy products from fuels and solvent use) are much lower in EDGAR 8.0 than in EDGAR 7.0 and thus emissions in PRIMAP-hist v2.5.1 are lower than in v2.5. As there are no country reported data for 2.D, CO2 the CR time-series are affected as well.
Changes by sector and gas
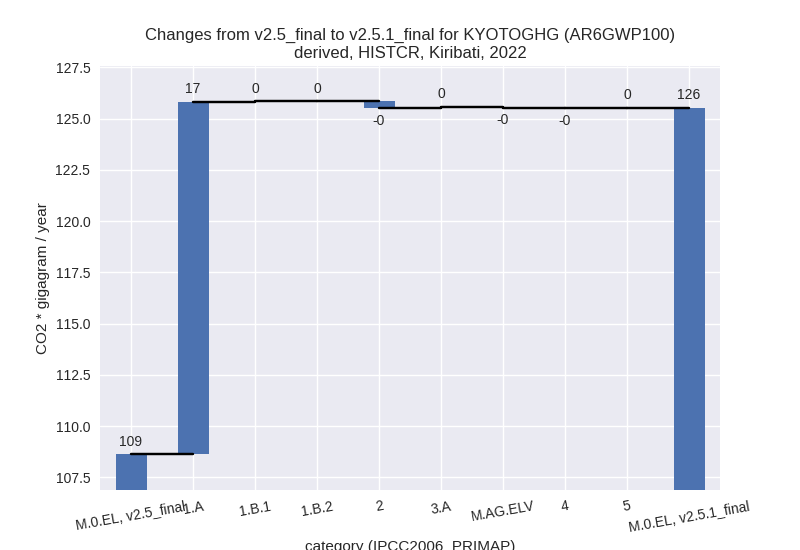
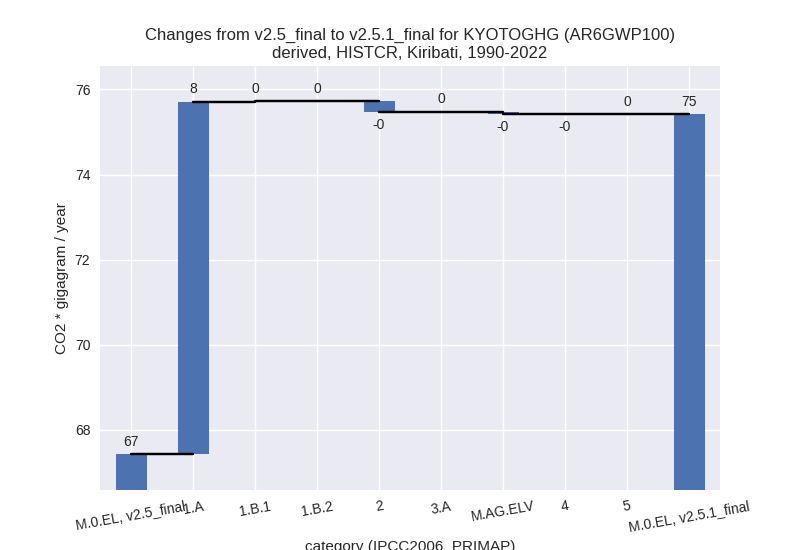
For each scenario and time frame the changes are displayed for all individual sectors and all individual gases. In the sector plot we use aggregate Kyoto GHGs in AR6GWP100. In the gas plot we usenational total emissions without LULUCF. ## country reported scenario
2022

1990-2022

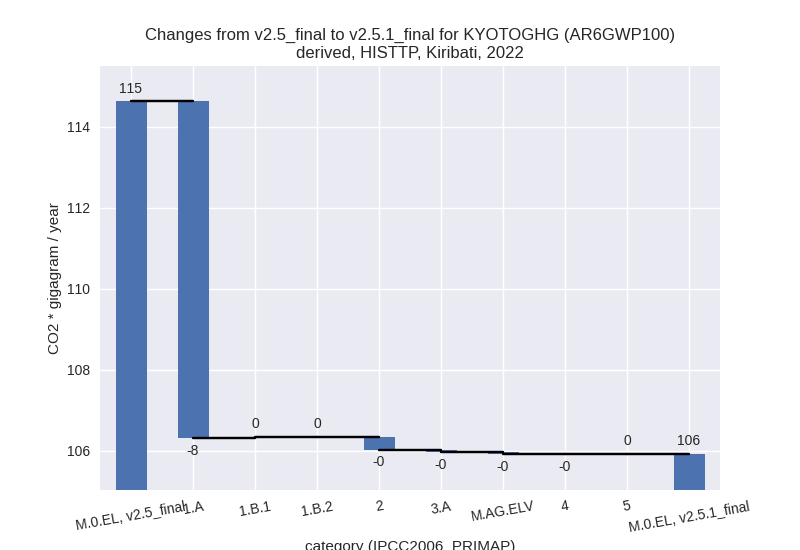
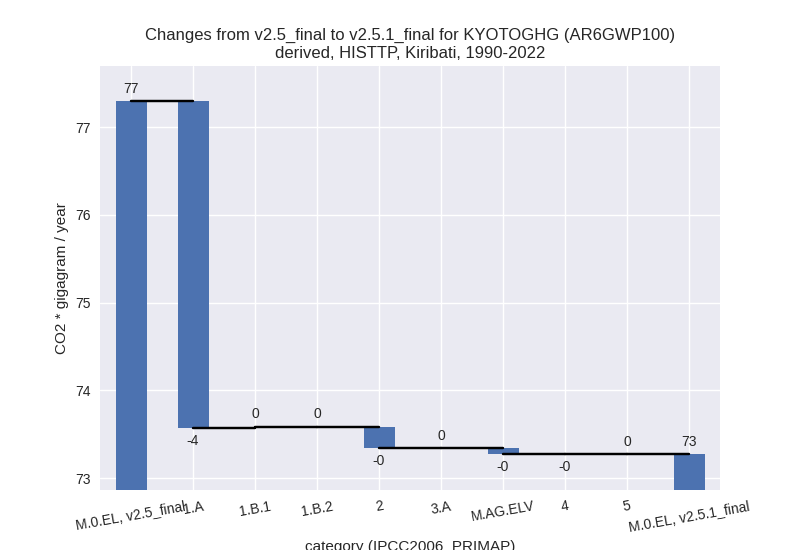
third party scenario
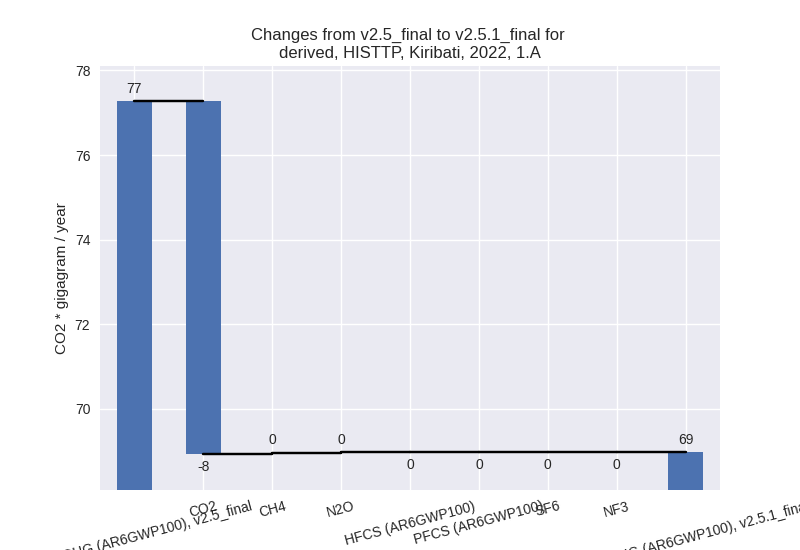
2022

1990-2022
Detailed changes for the scenarios:
country reported scenario (HISTCR):
Most important changes per time frame
For 2022 the following sector-gas combinations have the highest absolute impact on national total KyotoGHG (AR6GWP100) emissions in 2022 (top 5):
- 1: 1.A, CO2 with 17.15 Gg CO2 / year (23.3%)
- 2: 2, CO2 with -0.31 Gg CO2 / year (-43.9%)
- 3: 3.A, CH4 with 0.05 Gg CO2 / year (1.6%)
- 4: 1.A, CH4 with 0.04 Gg CO2 / year (9.3%)
- 5: M.AG.ELV, CH4 with -0.04 Gg CO2 / year (-100.0%)
For 1990-2022 the following sector-gas combinations have the highest absolute impact on national total KyotoGHG (AR6GWP100) emissions in 1990-2022 (top 5):
- 1: 1.A, CO2 with 8.28 Gg CO2 / year (19.7%)
- 2: 2, CO2 with -0.25 Gg CO2 / year (-42.3%)
- 3: M.AG.ELV, CH4 with -0.07 Gg CO2 / year (-82.0%)
- 4: 1.A, CH4 with 0.01 Gg CO2 / year (2.8%)
- 5: 1.B.1, CH4 with 0.01 Gg CO2 / year (1.4%)
Changes in the main sectors for aggregate KyotoGHG (AR6GWP100) are
- 1: Total sectoral emissions in 2022 are 92.74 Gg
CO2 / year which is 73.9% of M.0.EL emissions. 2022 Emissions have
changed by 22.8% (17.21 Gg CO2 /
year). 1990-2022 Emissions have changed by 19.2% (8.30 Gg CO2 / year). For 2022 the
changes per gas
are:

For 1990-2022 the changes per gas are:
The changes come from the following subsectors:- 1.A: Total sectoral emissions in 2022 are 91.90 Gg
CO2 / year which is 99.1% of category 1 emissions. 2022 Emissions have
changed by 23.0% (17.19 Gg CO2 /
year). 1990-2022 Emissions have changed by 19.4% (8.29 Gg CO2 / year). For 2022 the
changes per gas
are:
For 1990-2022 the changes per gas are:
There is no subsector information available in PRIMAP-hist. - 1.B.1: Total sectoral emissions in 2022 are 0.84 Gg
CO2 / year which is 0.9% of category 1 emissions. 2022 Emissions have
changed by 3.5% (0.03 Gg CO2 /
year). 1990-2022 Emissions have changed by 1.4% (0.01 Gg CO2 / year). For 2022 the
changes per gas
are:

There is no subsector information available in PRIMAP-hist. - 1.B.2: Total sectoral emissions in 2022 are 0.00 Gg
CO2 / year which is 0.0% of category 1 emissions. 2022 Emissions have
changed by 36.5% (0.00 Gg CO2 /
year). 1990-2022 Emissions have changed by 7.5% (0.00 Gg CO2 / year). For 2022 the
changes per gas
are:

For 1990-2022 the changes per gas are: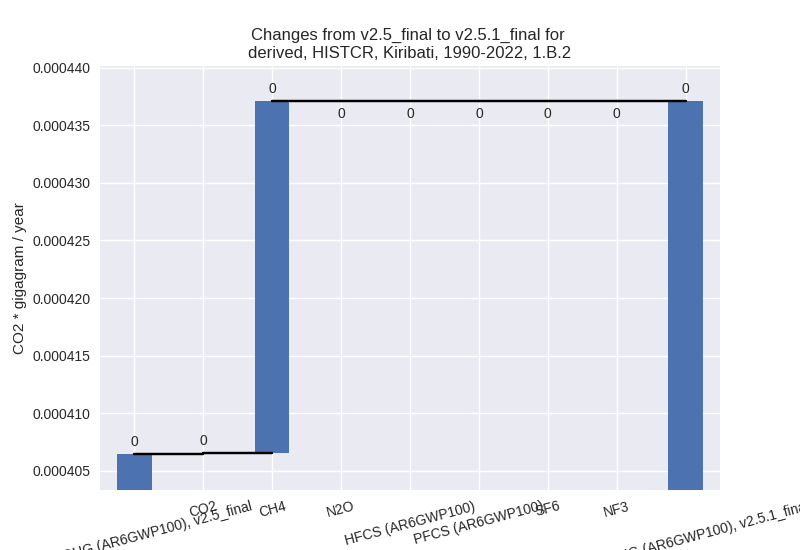
There is no subsector information available in PRIMAP-hist.
- 1.A: Total sectoral emissions in 2022 are 91.90 Gg
CO2 / year which is 99.1% of category 1 emissions. 2022 Emissions have
changed by 23.0% (17.19 Gg CO2 /
year). 1990-2022 Emissions have changed by 19.4% (8.29 Gg CO2 / year). For 2022 the
changes per gas
are:
- 2: Total sectoral emissions in 2022 are 1.10 Gg CO2
/ year which is 0.9% of M.0.EL emissions. 2022 Emissions have changed by
-22.3% (-0.32 Gg CO2 / year).
1990-2022 Emissions have changed by -22.0% (-0.25 Gg CO2 / year). For 2022 the
changes per gas
are:

For 1990-2022 the changes per gas are:
- M.AG: Total sectoral emissions in 2022 are 6.58 Gg CO2 / year which is 5.2% of M.0.EL emissions. 2022 Emissions have changed by 0.2% (0.01 Gg CO2 / year). 1990-2022 Emissions have changed by -1.3% (-0.06 Gg CO2 / year).
- 4: Total sectoral emissions in 2022 are 24.48 Gg CO2 / year which is 19.5% of M.0.EL emissions. 2022 Emissions have changed by -0.0% (-0.01 Gg CO2 / year). 1990-2022 Emissions have changed by -0.0% (-0.00 Gg CO2 / year).
- 5: Total sectoral emissions in 2022 are 0.64 Gg CO2 / year which is 0.5% of M.0.EL emissions. 2022 Emissions have changed by 1.7% (0.01 Gg CO2 / year). 1990-2022 Emissions have changed by 0.1% (0.00 Gg CO2 / year).
third party scenario (HISTTP):
Most important changes per time frame
For 2022 the following sector-gas combinations have the highest absolute impact on national total KyotoGHG (AR6GWP100) emissions in 2022 (top 5):
- 1: 1.A, CO2 with -8.35 Gg CO2 / year (-11.0%)
- 2: 2, CO2 with -0.31 Gg CO2 / year (-43.9%)
- 3: 3.A, CH4 with -0.07 Gg CO2 / year (-1.0%)
- 4: 1.A, CH4 with 0.04 Gg CO2 / year (9.3%)
- 5: M.AG.ELV, CH4 with -0.04 Gg CO2 / year (-100.0%)
For 1990-2022 the following sector-gas combinations have the highest absolute impact on national total KyotoGHG (AR6GWP100) emissions in 1990-2022 (top 5):
- 1: 1.A, CO2 with -3.73 Gg CO2 / year (-7.6%)
- 2: 2, CO2 with -0.25 Gg CO2 / year (-42.3%)
- 3: M.AG.ELV, CH4 with -0.07 Gg CO2 / year (-82.0%)
- 4: 1.A, CH4 with 0.01 Gg CO2 / year (2.8%)
- 5: 1.B.1, CH4 with 0.01 Gg CO2 / year (1.4%)
Changes in the main sectors for aggregate KyotoGHG (AR6GWP100) are
- 1: Total sectoral emissions in 2022 are 69.80 Gg
CO2 / year which is 65.9% of M.0.EL emissions. 2022 Emissions have
changed by -10.6% (-8.28 Gg CO2 /
year). 1990-2022 Emissions have changed by -7.4% (-3.71 Gg CO2 / year). For 2022 the
changes per gas
are:

For 1990-2022 the changes per gas are:
The changes come from the following subsectors:- 1.A: Total sectoral emissions in 2022 are 68.96 Gg
CO2 / year which is 98.8% of category 1 emissions. 2022 Emissions have
changed by -10.8% (-8.31 Gg CO2 /
year). 1990-2022 Emissions have changed by -7.5% (-3.72 Gg CO2 / year). For 2022 the
changes per gas
are:
For 1990-2022 the changes per gas are: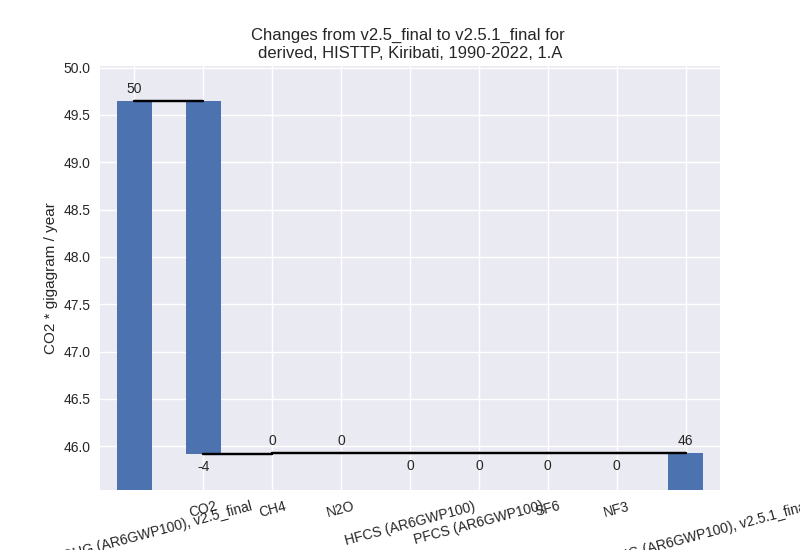
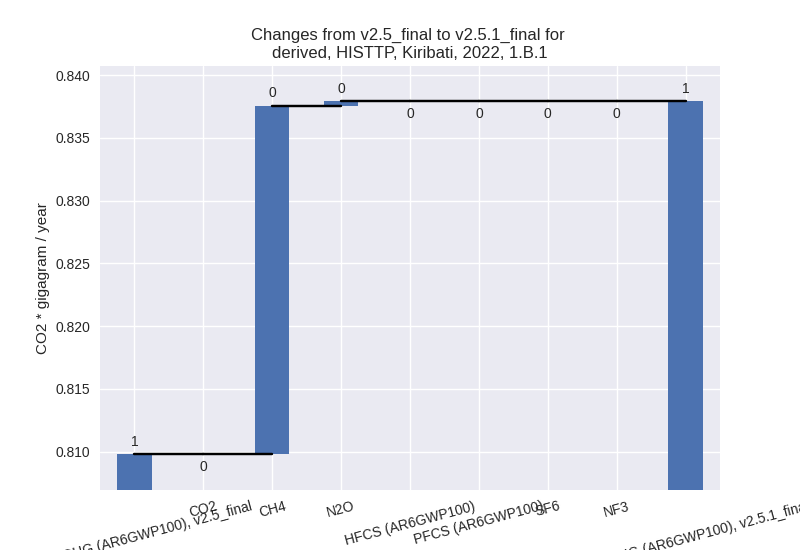
There is no subsector information available in PRIMAP-hist. - 1.B.1: Total sectoral emissions in 2022 are 0.84 Gg
CO2 / year which is 1.2% of category 1 emissions. 2022 Emissions have
changed by 3.5% (0.03 Gg CO2 /
year). 1990-2022 Emissions have changed by 1.4% (0.01 Gg CO2 / year). For 2022 the
changes per gas
are:
There is no subsector information available in PRIMAP-hist. - 1.B.2: Total sectoral emissions in 2022 are 0.00 Gg
CO2 / year which is 0.0% of category 1 emissions. 2022 Emissions have
changed by 36.5% (0.00 Gg CO2 /
year). 1990-2022 Emissions have changed by 7.5% (0.00 Gg CO2 / year). For 2022 the
changes per gas
are:

For 1990-2022 the changes per gas are:
There is no subsector information available in PRIMAP-hist.
- 1.A: Total sectoral emissions in 2022 are 68.96 Gg
CO2 / year which is 98.8% of category 1 emissions. 2022 Emissions have
changed by -10.8% (-8.31 Gg CO2 /
year). 1990-2022 Emissions have changed by -7.5% (-3.72 Gg CO2 / year). For 2022 the
changes per gas
are:
- 2: Total sectoral emissions in 2022 are 1.10 Gg CO2
/ year which is 1.0% of M.0.EL emissions. 2022 Emissions have changed by
-22.3% (-0.32 Gg CO2 / year).
1990-2022 Emissions have changed by -22.0% (-0.25 Gg CO2 / year). For 2022 the
changes per gas
are:

For 1990-2022 the changes per gas are:
- M.AG: Total sectoral emissions in 2022 are 9.89 Gg CO2 / year which is 9.3% of M.0.EL emissions. 2022 Emissions have changed by -1.1% (-0.11 Gg CO2 / year). 1990-2022 Emissions have changed by -0.8% (-0.07 Gg CO2 / year).
- 4: Total sectoral emissions in 2022 are 24.48 Gg CO2 / year which is 23.1% of M.0.EL emissions. 2022 Emissions have changed by -0.0% (-0.01 Gg CO2 / year). 1990-2022 Emissions have changed by -0.0% (-0.00 Gg CO2 / year).
- 5: Total sectoral emissions in 2022 are 0.64 Gg CO2 / year which is 0.6% of M.0.EL emissions. 2022 Emissions have changed by 1.7% (0.01 Gg CO2 / year). 1990-2022 Emissions have changed by 0.1% (0.00 Gg CO2 / year).