Changes in PRIMAP-hist v2.5.1_final compared to v2.5_final for Korea, Republic of
2024-02-29
Johannes Gütschow
Change analysis for Korea, Republic of for PRIMAP-hist v2.5.1_final compared to v2.5_final
Overview over emissions by sector and gas
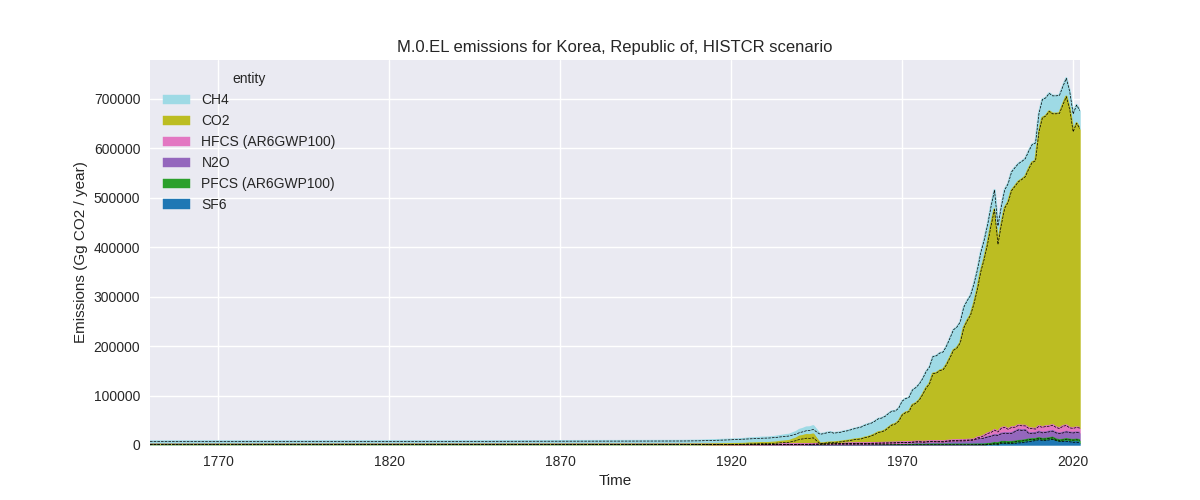
The following figures show the aggregate national total emissions excluding LULUCF AR6GWP100 for the country reported priority scenario. The dotted linesshow the v2.5_final data.


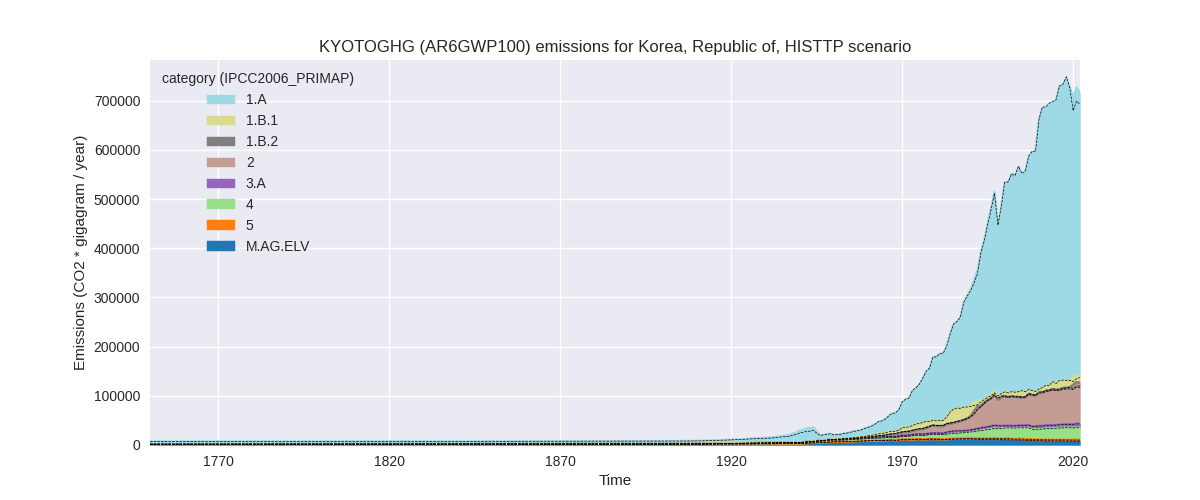
The following figures show the aggregate national total emissions excluding LULUCF AR6GWP100 for the third party priority scenario. The dotted linesshow the v2.5_final data.


Overview over changes
In the country reported priority scenario we have the following changes for aggregate Kyoto GHG and national total emissions excluding LULUCF (M.0.EL):
- Emissions in 2022 have changed by 0.0%% (139.12 Gg CO2 / year)
- Emissions in 1990-2022 have changed by 0.0%% (3.51 Gg CO2 / year)
In the third party priority scenario we have the following changes for aggregate Kyoto GHG and national total emissions excluding LULUCF (M.0.EL):
- Emissions in 2022 have changed by 3.3%% (22880.23 Gg CO2 / year)
- Emissions in 1990-2022 have changed by 0.3%% (1884.73 Gg CO2 / year)
Most important changes per scenario and time frame
In the country reported priority scenario the following sector-gas combinations have the highest absolute impact on national total KyotoGHG (AR6GWP100) emissions in 2022 (top 5):
- 1: 3.A, CH4 with 403.92 Gg CO2 / year (4.8%)
- 2: 4, CO2 with -394.71 Gg CO2 / year (-5.8%)
- 3: M.AG.ELV, CH4 with 300.69 Gg CO2 / year (4.1%)
- 4: 1.A, N2O with -298.63 Gg CO2 / year (-10.0%)
- 5: 3.A, N2O with 242.69 Gg CO2 / year (7.7%)
In the country reported priority scenario the following sector-gas combinations have the highest absolute impact on national total KyotoGHG (AR6GWP100) emissions in 1990-2022 (top 5):
- 1: 3.A, CH4 with 13.75 Gg CO2 / year (0.2%)
- 2: 4, CO2 with -11.96 Gg CO2 / year (-0.2%)
- 3: M.AG.ELV, CH4 with 9.08 Gg CO2 / year (0.1%)
- 4: 1.A, N2O with -8.91 Gg CO2 / year (-0.5%)
- 5: 3.A, N2O with 7.03 Gg CO2 / year (0.3%)
In the third party priority scenario the following sector-gas combinations have the highest absolute impact on national total KyotoGHG (AR6GWP100) emissions in 2022 (top 5):
- 1: 1.A, CO2 with 20680.02 Gg CO2 / year (3.8%)
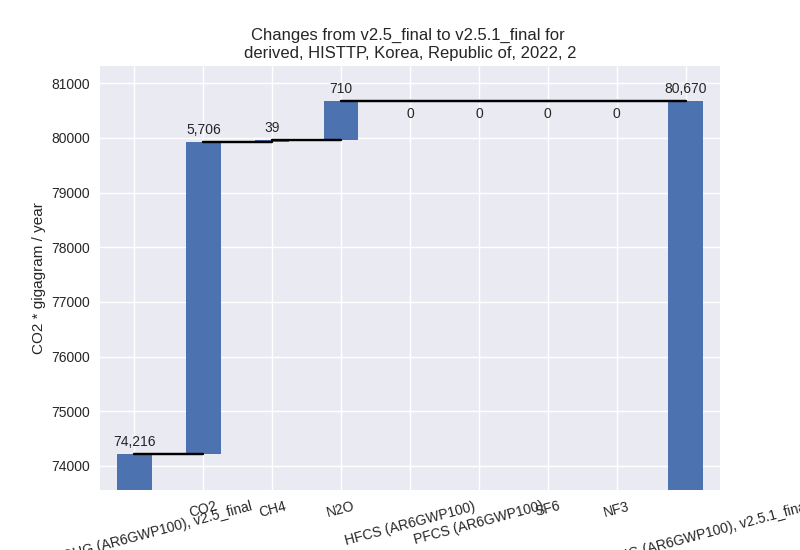
- 2: 2, CO2 with 5706.28 Gg CO2 / year (11.2%)
- 3: 1.B.1, CO2 with -3859.46 Gg CO2 / year (-23.4%)
- 4: 2, N2O with 709.52 Gg CO2 / year (62.8%)
- 5: 1.A, N2O with -432.52 Gg CO2 / year (-9.6%)
In the third party priority scenario the following sector-gas combinations have the highest absolute impact on national total KyotoGHG (AR6GWP100) emissions in 1990-2022 (top 5):
- 1: 1.A, CO2 with 1845.33 Gg CO2 / year (0.4%)
- 2: 1.B.1, CO2 with -602.60 Gg CO2 / year (-7.2%)
- 3: 2, CO2 with 551.52 Gg CO2 / year (1.3%)
- 4: 1.B.2, CH4 with -302.06 Gg CO2 / year (-17.8%)
- 5: 2, N2O with 244.30 Gg CO2 / year (11.2%)
Notes on data changes
No country specific notes present for this changelog.
Changes by sector and gas
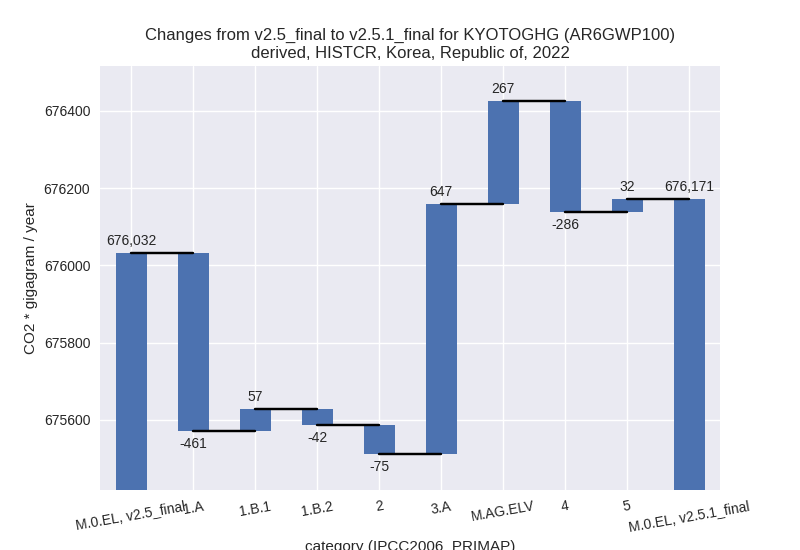
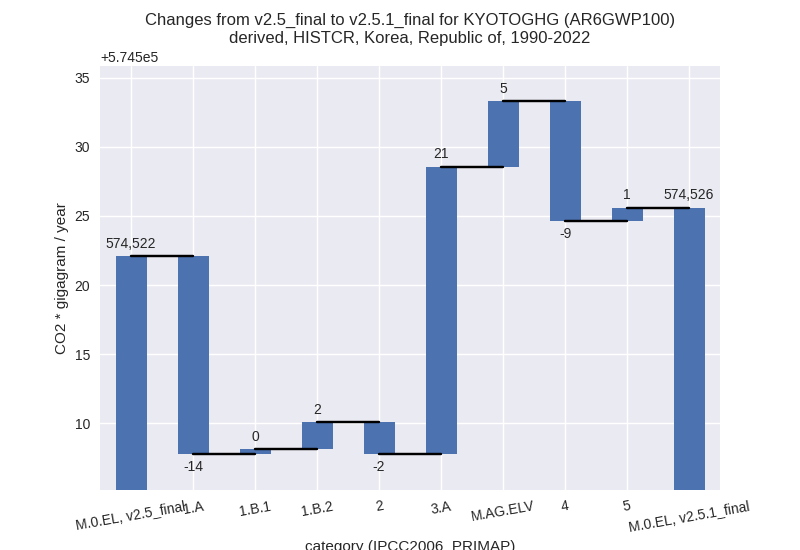
For each scenario and time frame the changes are displayed for all individual sectors and all individual gases. In the sector plot we use aggregate Kyoto GHGs in AR6GWP100. In the gas plot we usenational total emissions without LULUCF. ## country reported scenario
2022

1990-2022
third party scenario
2022
1990-2022

Detailed changes for the scenarios:
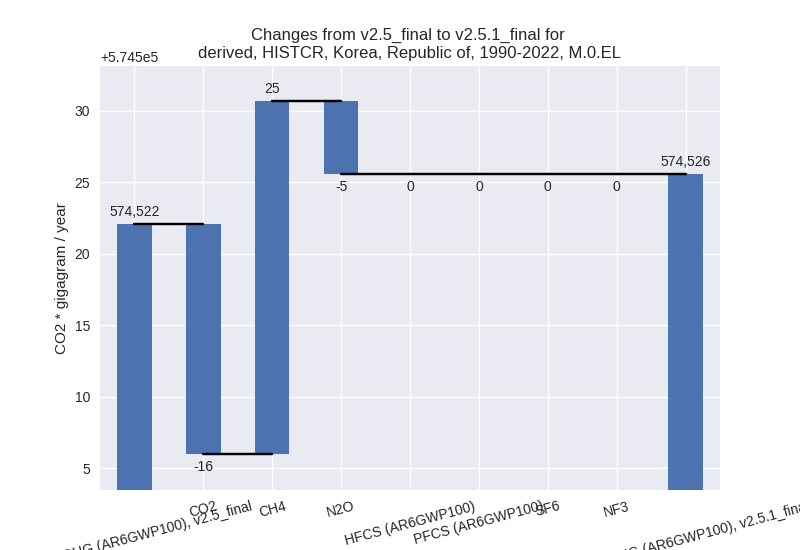
country reported scenario (HISTCR):
Most important changes per time frame
For 2022 the following sector-gas combinations have the highest absolute impact on national total KyotoGHG (AR6GWP100) emissions in 2022 (top 5):
- 1: 3.A, CH4 with 403.92 Gg CO2 / year (4.8%)
- 2: 4, CO2 with -394.71 Gg CO2 / year (-5.8%)
- 3: M.AG.ELV, CH4 with 300.69 Gg CO2 / year (4.1%)
- 4: 1.A, N2O with -298.63 Gg CO2 / year (-10.0%)
- 5: 3.A, N2O with 242.69 Gg CO2 / year (7.7%)
For 1990-2022 the following sector-gas combinations have the highest absolute impact on national total KyotoGHG (AR6GWP100) emissions in 1990-2022 (top 5):
- 1: 3.A, CH4 with 13.75 Gg CO2 / year (0.2%)
- 2: 4, CO2 with -11.96 Gg CO2 / year (-0.2%)
- 3: M.AG.ELV, CH4 with 9.08 Gg CO2 / year (0.1%)
- 4: 1.A, N2O with -8.91 Gg CO2 / year (-0.5%)
- 5: 3.A, N2O with 7.03 Gg CO2 / year (0.3%)
Changes in the main sectors for aggregate KyotoGHG (AR6GWP100) are
- 1: Total sectoral emissions in 2022 are 576109.54 Gg CO2 / year which is 85.2% of M.0.EL emissions. 2022 Emissions have changed by -0.1% (-445.48 Gg CO2 / year). 1990-2022 Emissions have changed by -0.0% (-11.97 Gg CO2 / year).
- 2: Total sectoral emissions in 2022 are 53318.74 Gg CO2 / year which is 7.9% of M.0.EL emissions. 2022 Emissions have changed by -0.1% (-74.73 Gg CO2 / year). 1990-2022 Emissions have changed by -0.0% (-2.33 Gg CO2 / year).
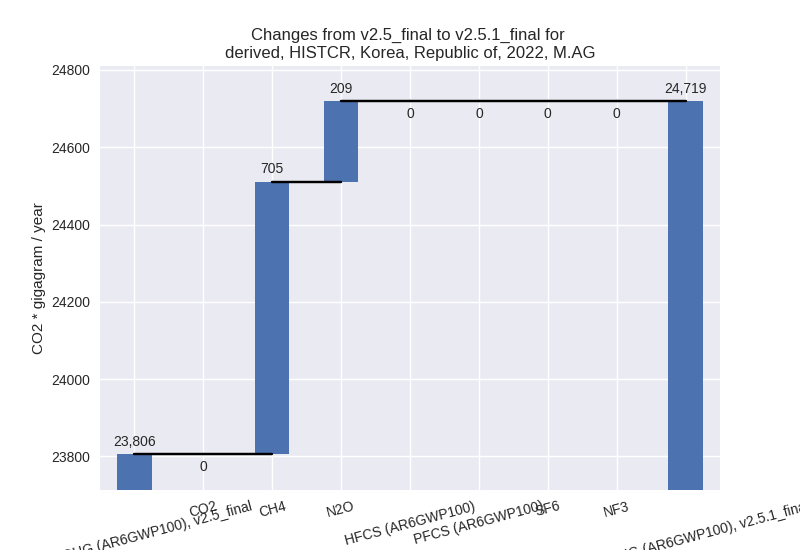
- M.AG: Total sectoral emissions in 2022 are 24718.85
Gg CO2 / year which is 3.7% of M.0.EL emissions. 2022 Emissions have
changed by 3.8% (913.29 Gg CO2 /
year). 1990-2022 Emissions have changed by 0.1% (25.50 Gg CO2 / year). For 2022 the
changes per gas
are:
The changes come from the following subsectors:- 3.A: Total sectoral emissions in 2022 are 12190.16
Gg CO2 / year which is 49.3% of category M.AG emissions. 2022 Emissions
have changed by 5.6% (646.61 Gg CO2
/ year). 1990-2022 Emissions have changed by 0.2% (20.78 Gg CO2 / year). For 2022 the
changes per gas
are:

There is no subsector information available in PRIMAP-hist. - M.AG.ELV: Total sectoral emissions in 2022 are
12528.69 Gg CO2 / year which is 50.7% of category M.AG emissions. 2022
Emissions have changed by 2.2%
(266.68 Gg CO2 / year). 1990-2022 Emissions have changed by 0.0% (4.72 Gg CO2 / year). For 2022 the
changes per gas
are:

There is no subsector information available in PRIMAP-hist.
- 3.A: Total sectoral emissions in 2022 are 12190.16
Gg CO2 / year which is 49.3% of category M.AG emissions. 2022 Emissions
have changed by 5.6% (646.61 Gg CO2
/ year). 1990-2022 Emissions have changed by 0.2% (20.78 Gg CO2 / year). For 2022 the
changes per gas
are:
- 4: Total sectoral emissions in 2022 are 19816.89 Gg CO2 / year which is 2.9% of M.0.EL emissions. 2022 Emissions have changed by -1.4% (-285.52 Gg CO2 / year). 1990-2022 Emissions have changed by -0.0% (-8.65 Gg CO2 / year).
- 5: Total sectoral emissions in 2022 are 2206.61 Gg CO2 / year which is 0.3% of M.0.EL emissions. 2022 Emissions have changed by 1.5% (31.57 Gg CO2 / year). 1990-2022 Emissions have changed by 0.0% (0.96 Gg CO2 / year).
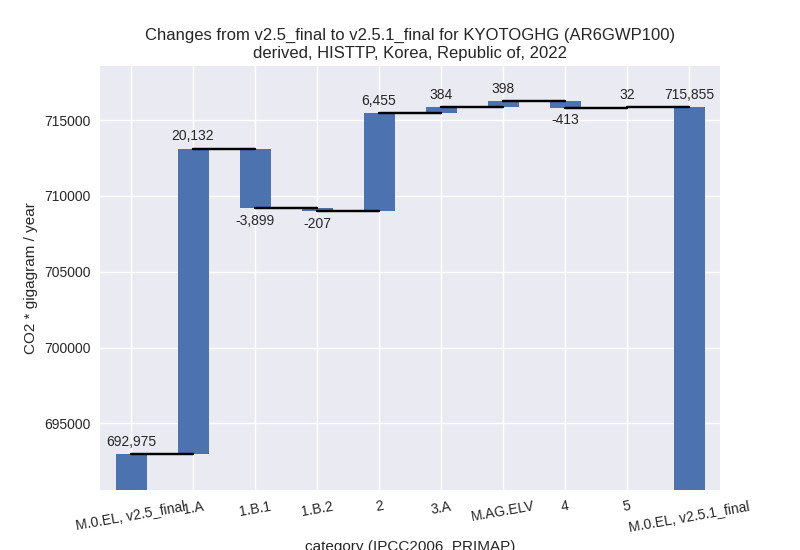
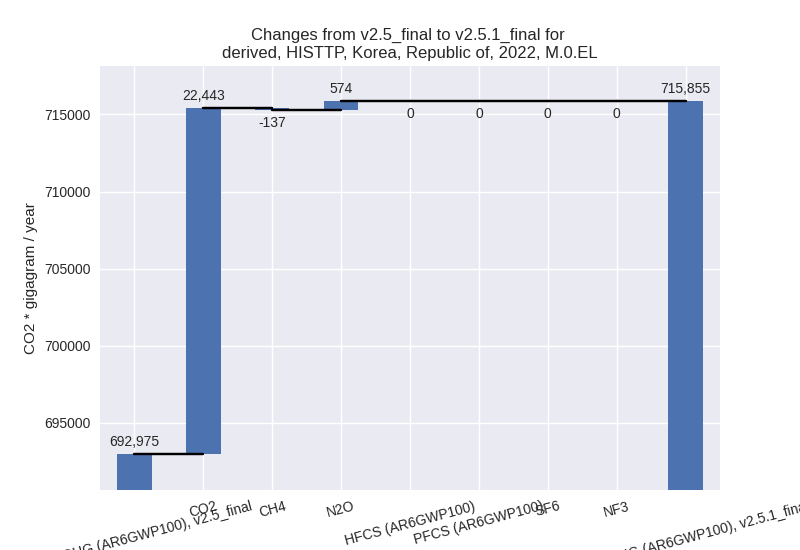
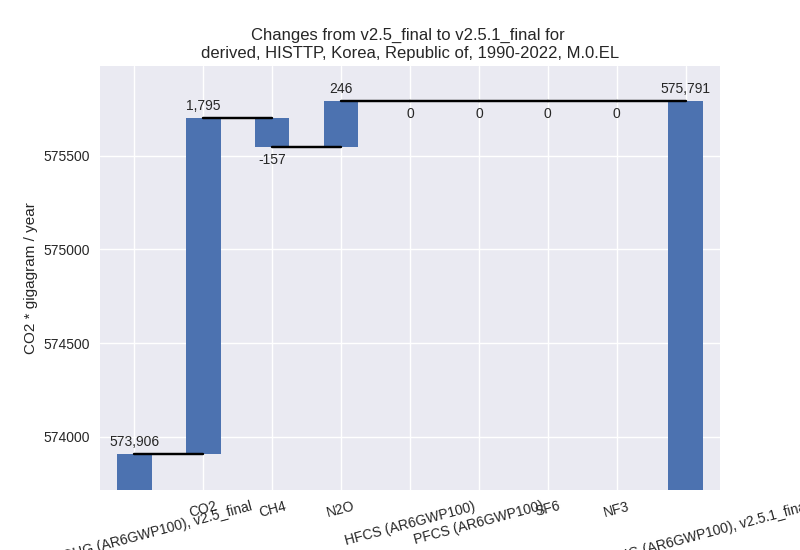
third party scenario (HISTTP):
Most important changes per time frame
For 2022 the following sector-gas combinations have the highest absolute impact on national total KyotoGHG (AR6GWP100) emissions in 2022 (top 5):
- 1: 1.A, CO2 with 20680.02 Gg CO2 / year (3.8%)
- 2: 2, CO2 with 5706.28 Gg CO2 / year (11.2%)
- 3: 1.B.1, CO2 with -3859.46 Gg CO2 / year (-23.4%)
- 4: 2, N2O with 709.52 Gg CO2 / year (62.8%)
- 5: 1.A, N2O with -432.52 Gg CO2 / year (-9.6%)
For 1990-2022 the following sector-gas combinations have the highest absolute impact on national total KyotoGHG (AR6GWP100) emissions in 1990-2022 (top 5):
- 1: 1.A, CO2 with 1845.33 Gg CO2 / year (0.4%)
- 2: 1.B.1, CO2 with -602.60 Gg CO2 / year (-7.2%)
- 3: 2, CO2 with 551.52 Gg CO2 / year (1.3%)
- 4: 1.B.2, CH4 with -302.06 Gg CO2 / year (-17.8%)
- 5: 2, N2O with 244.30 Gg CO2 / year (11.2%)
Changes in the main sectors for aggregate KyotoGHG (AR6GWP100) are
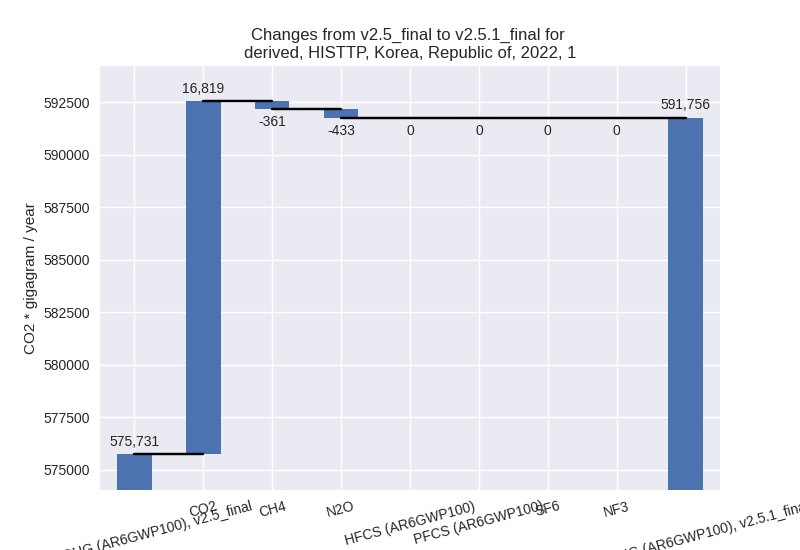
- 1: Total sectoral emissions in 2022 are 591756.45
Gg CO2 / year which is 82.7% of M.0.EL emissions. 2022 Emissions have
changed by 2.8% (16024.98 Gg CO2 /
year). 1990-2022 Emissions have changed by 0.2% (1058.52 Gg CO2 / year). For 2022 the
changes per gas
are:
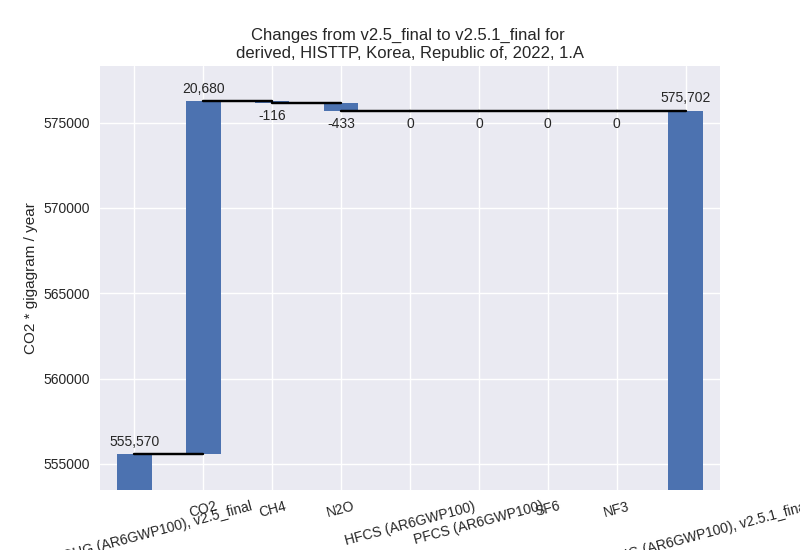
The changes come from the following subsectors:- 1.A: Total sectoral emissions in 2022 are 575701.70
Gg CO2 / year which is 97.3% of category 1 emissions. 2022 Emissions
have changed by 3.6% (20131.60 Gg
CO2 / year). 1990-2022 Emissions have changed by 0.4% (1826.25 Gg CO2 / year). For 2022 the
changes per gas
are:
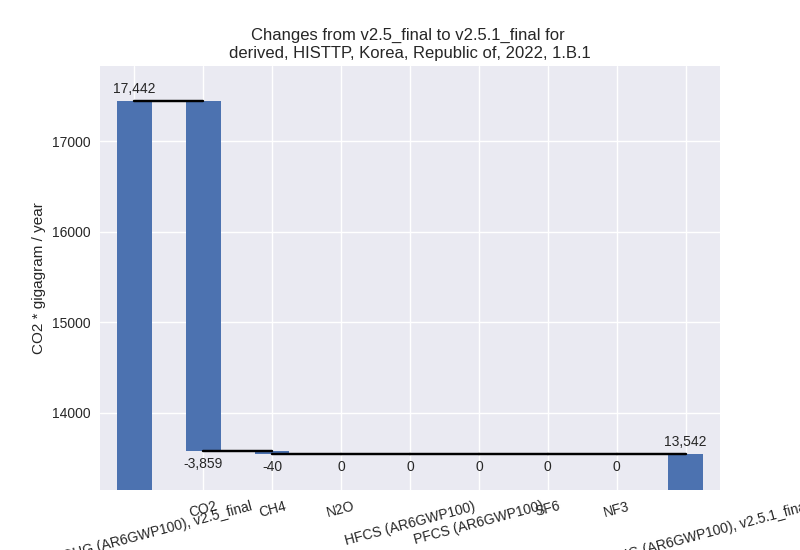
There is no subsector information available in PRIMAP-hist. - 1.B.1: Total sectoral emissions in 2022 are
13542.34 Gg CO2 / year which is 2.3% of category 1 emissions. 2022
Emissions have changed by -22.4%
(-3899.36 Gg CO2 / year). 1990-2022 Emissions have changed by -4.4% (-465.42 Gg CO2 / year). For 2022
the changes per gas
are:
For 1990-2022 the changes per gas are: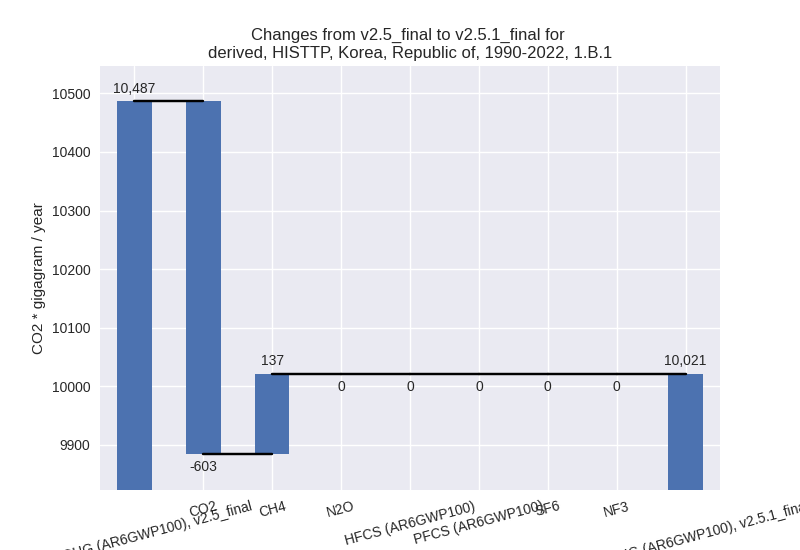
There is no subsector information available in PRIMAP-hist. - 1.B.2: Total sectoral emissions in 2022 are 2512.41
Gg CO2 / year which is 0.4% of category 1 emissions. 2022 Emissions have
changed by -7.6% (-207.26 Gg CO2 /
year). 1990-2022 Emissions have changed by -17.7% (-302.31 Gg CO2 / year). For 2022
the changes per gas
are:

For 1990-2022 the changes per gas are: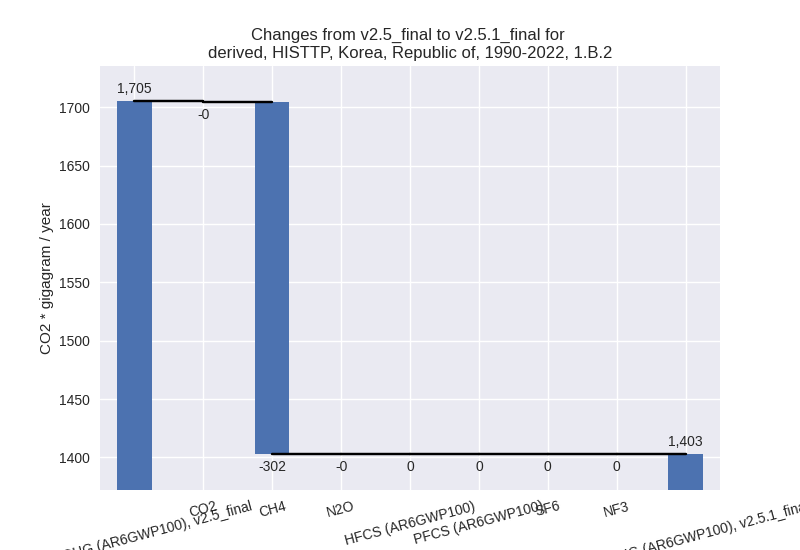
There is no subsector information available in PRIMAP-hist.
- 1.A: Total sectoral emissions in 2022 are 575701.70
Gg CO2 / year which is 97.3% of category 1 emissions. 2022 Emissions
have changed by 3.6% (20131.60 Gg
CO2 / year). 1990-2022 Emissions have changed by 0.4% (1826.25 Gg CO2 / year). For 2022 the
changes per gas
are:
- 2: Total sectoral emissions in 2022 are 80670.40 Gg
CO2 / year which is 11.3% of M.0.EL emissions. 2022 Emissions have
changed by 8.7% (6454.86 Gg CO2 /
year). 1990-2022 Emissions have changed by 1.3% (804.95 Gg CO2 / year). For 2022 the
changes per gas
are:
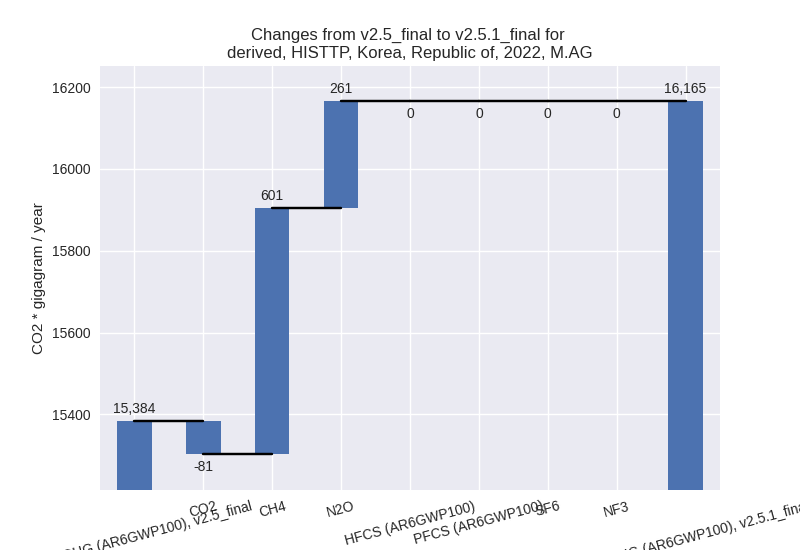
- M.AG: Total sectoral emissions in 2022 are 16165.44
Gg CO2 / year which is 2.3% of M.0.EL emissions. 2022 Emissions have
changed by 5.1% (781.85 Gg CO2 /
year). 1990-2022 Emissions have changed by 0.2% (32.82 Gg CO2 / year). For 2022 the
changes per gas
are:
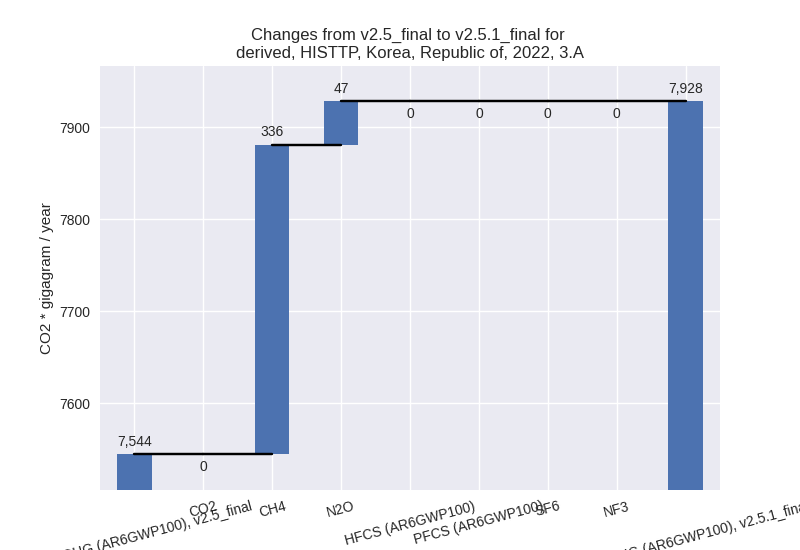
The changes come from the following subsectors:- 3.A: Total sectoral emissions in 2022 are 7928.38
Gg CO2 / year which is 49.0% of category M.AG emissions. 2022 Emissions
have changed by 5.1% (383.92 Gg CO2
/ year). 1990-2022 Emissions have changed by 0.2% (11.96 Gg CO2 / year). For 2022 the
changes per gas
are:
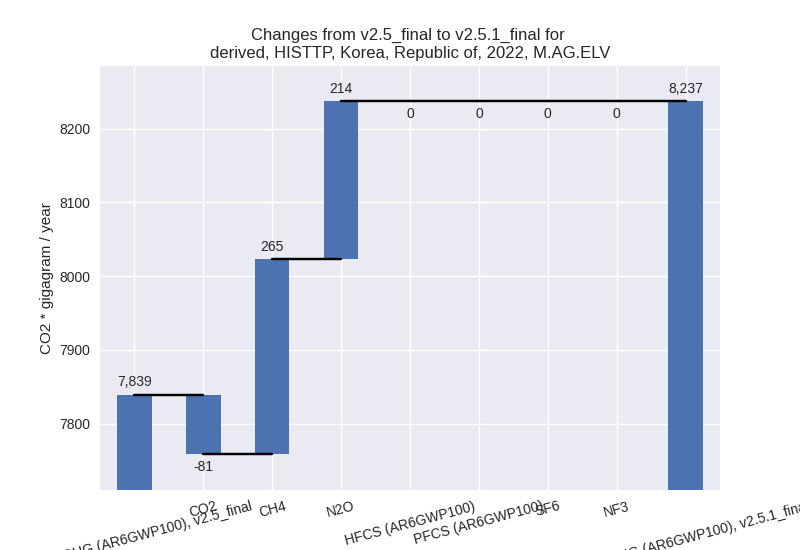
There is no subsector information available in PRIMAP-hist. - M.AG.ELV: Total sectoral emissions in 2022 are
8237.06 Gg CO2 / year which is 51.0% of category M.AG emissions. 2022
Emissions have changed by 5.1%
(397.93 Gg CO2 / year). 1990-2022 Emissions have changed by 0.2% (20.86 Gg CO2 / year). For 2022 the
changes per gas
are:
There is no subsector information available in PRIMAP-hist.
- 3.A: Total sectoral emissions in 2022 are 7928.38
Gg CO2 / year which is 49.0% of category M.AG emissions. 2022 Emissions
have changed by 5.1% (383.92 Gg CO2
/ year). 1990-2022 Emissions have changed by 0.2% (11.96 Gg CO2 / year). For 2022 the
changes per gas
are:
- 4: Total sectoral emissions in 2022 are 25056.39 Gg CO2 / year which is 3.5% of M.0.EL emissions. 2022 Emissions have changed by -1.6% (-413.03 Gg CO2 / year). 1990-2022 Emissions have changed by -0.1% (-12.52 Gg CO2 / year).
- 5: Total sectoral emissions in 2022 are 2206.61 Gg CO2 / year which is 0.3% of M.0.EL emissions. 2022 Emissions have changed by 1.5% (31.57 Gg CO2 / year). 1990-2022 Emissions have changed by 0.0% (0.96 Gg CO2 / year).