Changes in PRIMAP-hist v2.5.1_final compared to v2.5_final for Kuwait
2024-02-29
Johannes Gütschow
Change analysis for Kuwait for PRIMAP-hist v2.5.1_final compared to v2.5_final
Overview over emissions by sector and gas
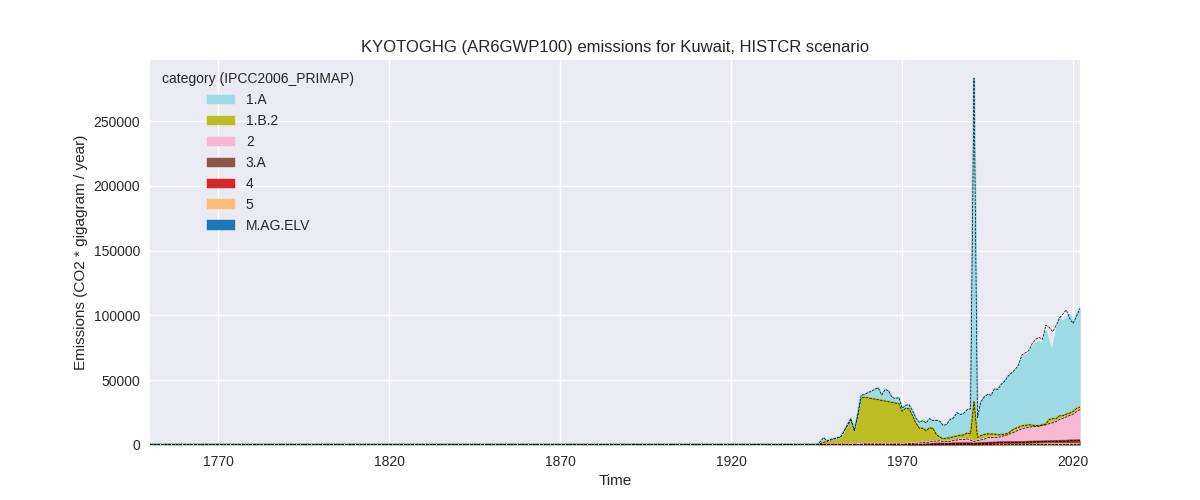
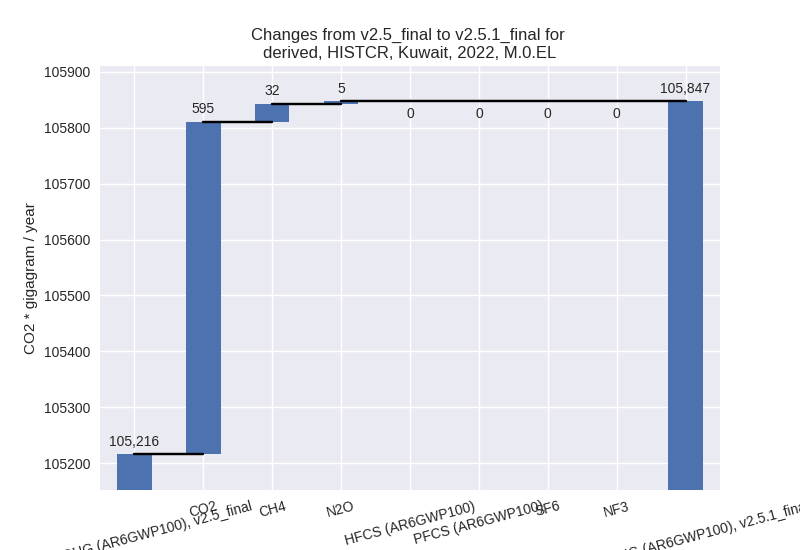
The following figures show the aggregate national total emissions excluding LULUCF AR6GWP100 for the country reported priority scenario. The dotted linesshow the v2.5_final data.

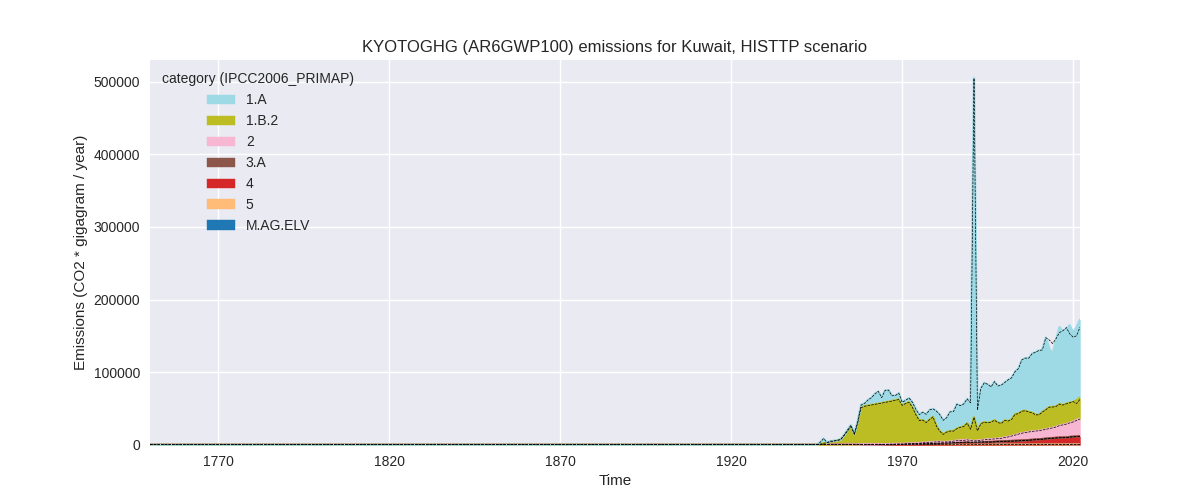
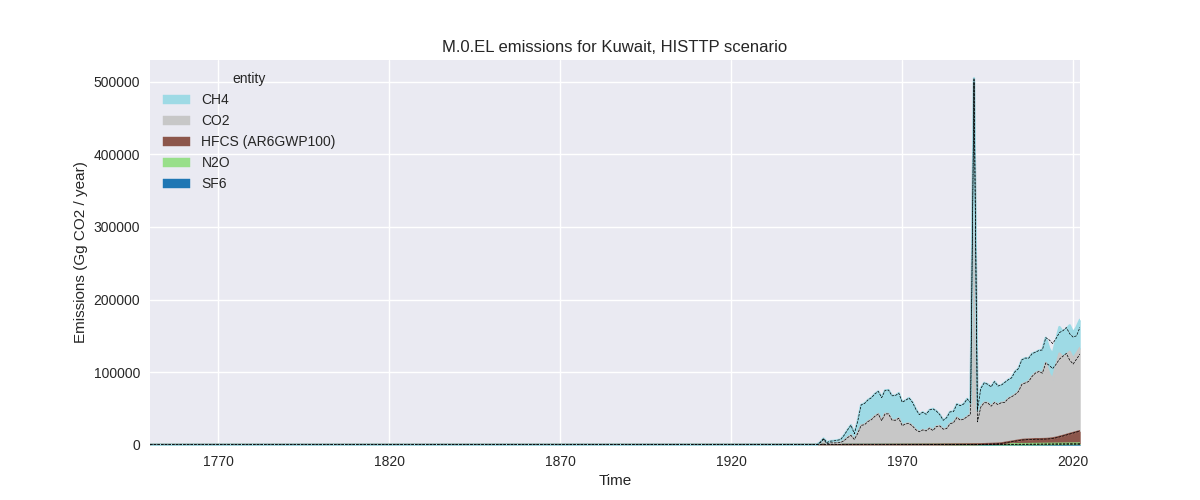
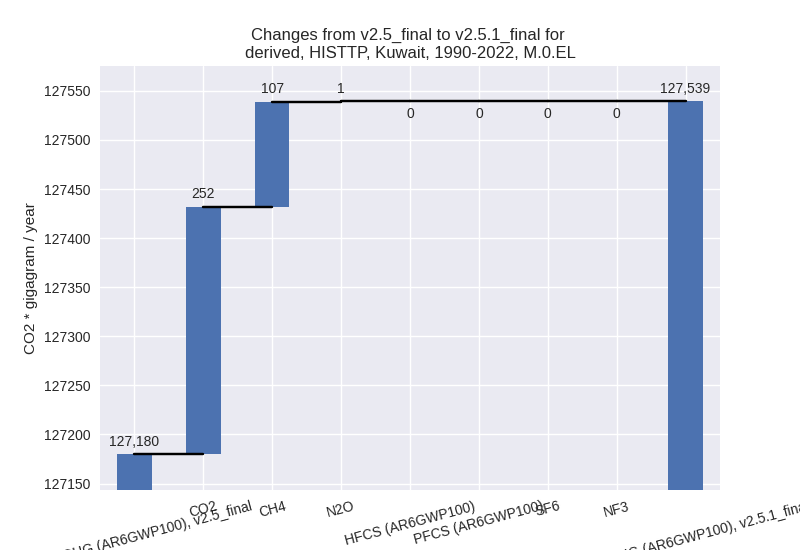
The following figures show the aggregate national total emissions excluding LULUCF AR6GWP100 for the third party priority scenario. The dotted linesshow the v2.5_final data.

Overview over changes
In the country reported priority scenario we have the following changes for aggregate Kyoto GHG and national total emissions excluding LULUCF (M.0.EL):
- Emissions in 2022 have changed by 0.6%% (631.64 Gg CO2 / year)
- Emissions in 1990-2022 have changed by -3.0%% (-2261.78 Gg CO2 / year)
In the third party priority scenario we have the following changes for aggregate Kyoto GHG and national total emissions excluding LULUCF (M.0.EL):
- Emissions in 2022 have changed by 6.3%% (10152.67 Gg CO2 / year)
- Emissions in 1990-2022 have changed by 0.3%% (359.45 Gg CO2 / year)
Most important changes per scenario and time frame
In the country reported priority scenario the following sector-gas combinations have the highest absolute impact on national total KyotoGHG (AR6GWP100) emissions in 2022 (top 5):
- 1: 2, CO2 with 558.21 Gg CO2 / year (9.6%)
- 2: 1.A, CO2 with 38.01 Gg CO2 / year (0.1%)
- 3: 5, N2O with 26.56 Gg CO2 / year (8.8%)
- 4: 2, N2O with -14.29 Gg CO2 / year (-7.3%)
- 5: 1.B.2, CH4 with 11.63 Gg CO2 / year (8.3%)
In the country reported priority scenario the following sector-gas combinations have the highest absolute impact on national total KyotoGHG (AR6GWP100) emissions in 1990-2022 (top 5):
- 1: 1.A, CO2 with -2243.22 Gg CO2 / year (-3.8%)
- 2: 2, CO2 with -20.90 Gg CO2 / year (-0.5%)
- 3: 5, N2O with 0.81 Gg CO2 / year (0.3%)
- 4: 1.A, CH4 with 0.73 Gg CO2 / year (0.7%)
- 5: 1.B.2, CH4 with 0.67 Gg CO2 / year (0.1%)
In the third party priority scenario the following sector-gas combinations have the highest absolute impact on national total KyotoGHG (AR6GWP100) emissions in 2022 (top 5):
- 1: 1.A, CO2 with 7715.48 Gg CO2 / year (7.8%)
- 2: 1.B.2, CH4 with 2072.95 Gg CO2 / year (8.1%)
- 3: 2, CO2 with 558.21 Gg CO2 / year (9.9%)
- 4: 4, CH4 with -215.99 Gg CO2 / year (-1.9%)
- 5: 5, N2O with 26.56 Gg CO2 / year (8.8%)
In the third party priority scenario the following sector-gas combinations have the highest absolute impact on national total KyotoGHG (AR6GWP100) emissions in 1990-2022 (top 5):
- 1: 1.A, CO2 with 273.12 Gg CO2 / year (0.3%)
- 2: 1.B.2, CH4 with 112.43 Gg CO2 / year (0.5%)
- 3: 2, CO2 with -20.90 Gg CO2 / year (-0.5%)
- 4: 4, CH4 with -6.54 Gg CO2 / year (-0.1%)
- 5: 5, N2O with 0.81 Gg CO2 / year (0.3%)
Notes on data changes
Here we list notes explaining important emissions changes for the country. ’' means that the following text only applies to the TP time series, while means that it only applies to the CR scenario. Otherwise the note applies to both scenarios.
- 1.A, CO2: CDAIC 2023 data has a smaller emissions reduction in 2020 than EI 2023 data leading to higher emissions in PRIMAP-hist for the latest years.
- 1.B.2, CH4: EDGAR 8.0 emissions are higher than EDGAR 7.0 for 2021.
Changes by sector and gas
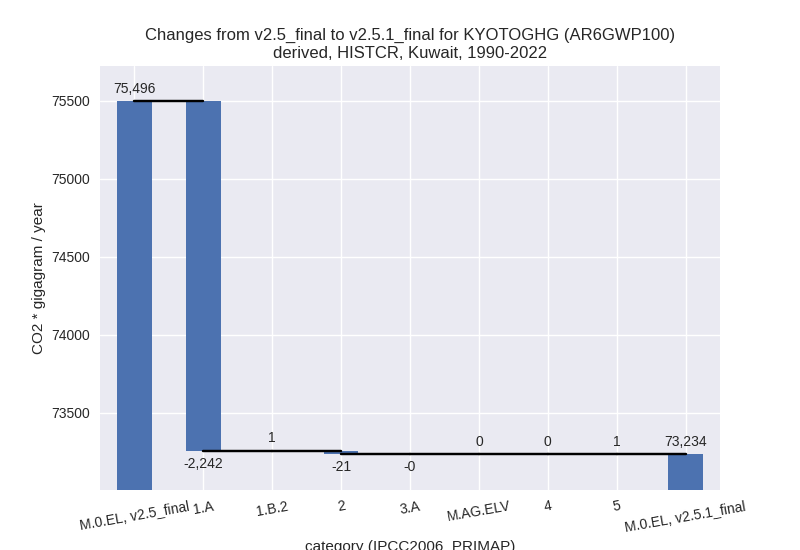
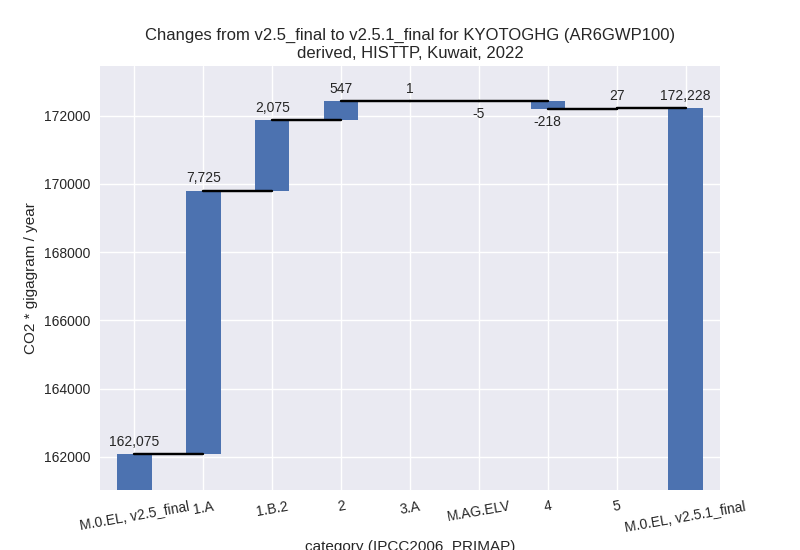
For each scenario and time frame the changes are displayed for all individual sectors and all individual gases. In the sector plot we use aggregate Kyoto GHGs in AR6GWP100. In the gas plot we usenational total emissions without LULUCF. ## country reported scenario
2022

1990-2022

third party scenario
2022

1990-2022

Detailed changes for the scenarios:
country reported scenario (HISTCR):
Most important changes per time frame
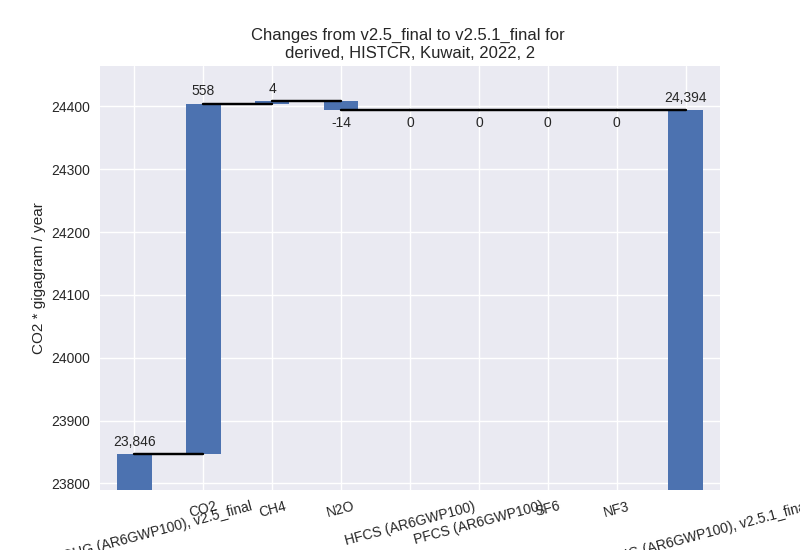
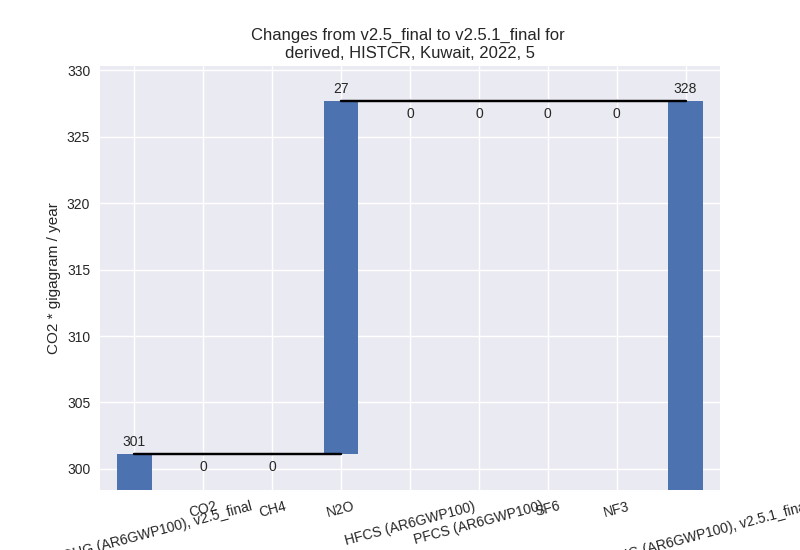
For 2022 the following sector-gas combinations have the highest absolute impact on national total KyotoGHG (AR6GWP100) emissions in 2022 (top 5):
- 1: 2, CO2 with 558.21 Gg CO2 / year (9.6%)
- 2: 1.A, CO2 with 38.01 Gg CO2 / year (0.1%)
- 3: 5, N2O with 26.56 Gg CO2 / year (8.8%)
- 4: 2, N2O with -14.29 Gg CO2 / year (-7.3%)
- 5: 1.B.2, CH4 with 11.63 Gg CO2 / year (8.3%)
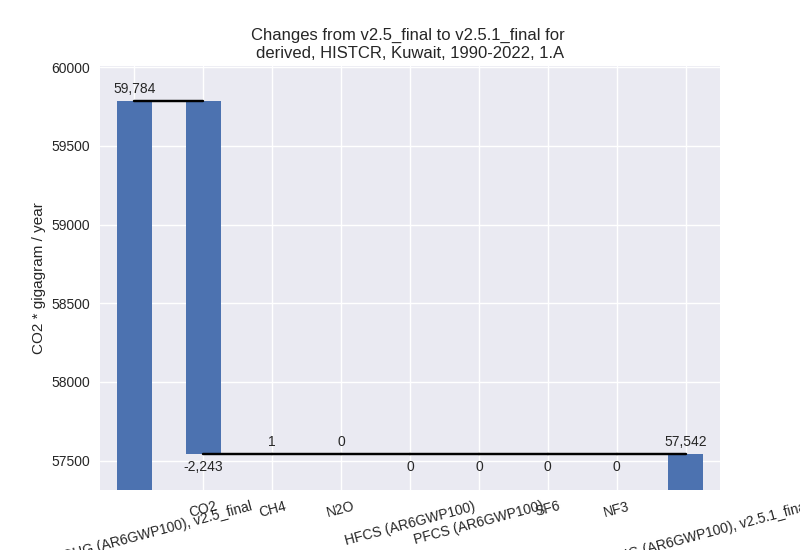
For 1990-2022 the following sector-gas combinations have the highest absolute impact on national total KyotoGHG (AR6GWP100) emissions in 1990-2022 (top 5):
- 1: 1.A, CO2 with -2243.22 Gg CO2 / year (-3.8%)
- 2: 2, CO2 with -20.90 Gg CO2 / year (-0.5%)
- 3: 5, N2O with 0.81 Gg CO2 / year (0.3%)
- 4: 1.A, CH4 with 0.73 Gg CO2 / year (0.7%)
- 5: 1.B.2, CH4 with 0.67 Gg CO2 / year (0.1%)
Changes in the main sectors for aggregate KyotoGHG (AR6GWP100) are
- 1: Total sectoral emissions in 2022 are 77936.94 Gg
CO2 / year which is 73.6% of M.0.EL emissions. 2022 Emissions have
changed by 0.1% (55.62 Gg CO2 /
year). 1990-2022 Emissions have changed by -3.6% (-2241.51 Gg CO2 / year). For
1990-2022 the changes per gas
are:

The changes come from the following subsectors:- 1.A: Total sectoral emissions in 2022 are 76277.14
Gg CO2 / year which is 97.9% of category 1 emissions. 2022 Emissions
have changed by 0.1% (41.55 Gg CO2 /
year). 1990-2022 Emissions have changed by -3.8% (-2242.26 Gg CO2 / year). For
1990-2022 the changes per gas
are:
There is no subsector information available in PRIMAP-hist. - 1.B.2: Total sectoral emissions in 2022 are 1659.80 Gg CO2 / year which is 2.1% of category 1 emissions. 2022 Emissions have changed by 0.9% (14.07 Gg CO2 / year). 1990-2022 Emissions have changed by 0.0% (0.75 Gg CO2 / year).
- 1.A: Total sectoral emissions in 2022 are 76277.14
Gg CO2 / year which is 97.9% of category 1 emissions. 2022 Emissions
have changed by 0.1% (41.55 Gg CO2 /
year). 1990-2022 Emissions have changed by -3.8% (-2242.26 Gg CO2 / year). For
1990-2022 the changes per gas
are:
- 2: Total sectoral emissions in 2022 are 24393.91 Gg
CO2 / year which is 23.0% of M.0.EL emissions. 2022 Emissions have
changed by 2.3% (547.49 Gg CO2 /
year). 1990-2022 Emissions have changed by -0.2% (-21.24 Gg CO2 / year). For 2022 the
changes per gas
are:
- M.AG: Total sectoral emissions in 2022 are 564.49 Gg CO2 / year which is 0.5% of M.0.EL emissions. 2022 Emissions have changed by -0.8% (-4.58 Gg CO2 / year). 1990-2022 Emissions have changed by -0.0% (-0.04 Gg CO2 / year).
- 4: Total sectoral emissions in 2022 are 2624.38 Gg CO2 / year which is 2.5% of M.0.EL emissions. 2022 Emissions have changed by 0.2% (6.53 Gg CO2 / year). 1990-2022 Emissions have changed by 0.0% (0.20 Gg CO2 / year).
- 5: Total sectoral emissions in 2022 are 327.67 Gg
CO2 / year which is 0.3% of M.0.EL emissions. 2022 Emissions have
changed by 8.8% (26.56 Gg CO2 /
year). 1990-2022 Emissions have changed by 0.3% (0.81 Gg CO2 / year). For 2022 the
changes per gas
are:
third party scenario (HISTTP):
Most important changes per time frame
For 2022 the following sector-gas combinations have the highest absolute impact on national total KyotoGHG (AR6GWP100) emissions in 2022 (top 5):
- 1: 1.A, CO2 with 7715.48 Gg CO2 / year (7.8%)
- 2: 1.B.2, CH4 with 2072.95 Gg CO2 / year (8.1%)
- 3: 2, CO2 with 558.21 Gg CO2 / year (9.9%)
- 4: 4, CH4 with -215.99 Gg CO2 / year (-1.9%)
- 5: 5, N2O with 26.56 Gg CO2 / year (8.8%)
For 1990-2022 the following sector-gas combinations have the highest absolute impact on national total KyotoGHG (AR6GWP100) emissions in 1990-2022 (top 5):
- 1: 1.A, CO2 with 273.12 Gg CO2 / year (0.3%)
- 2: 1.B.2, CH4 with 112.43 Gg CO2 / year (0.5%)
- 3: 2, CO2 with -20.90 Gg CO2 / year (-0.5%)
- 4: 4, CH4 with -6.54 Gg CO2 / year (-0.1%)
- 5: 5, N2O with 0.81 Gg CO2 / year (0.3%)
Changes in the main sectors for aggregate KyotoGHG (AR6GWP100) are
- 1: Total sectoral emissions in 2022 are 136129.87
Gg CO2 / year which is 79.0% of M.0.EL emissions. 2022 Emissions have
changed by 7.8% (9800.05 Gg CO2 /
year). 1990-2022 Emissions have changed by 0.4% (386.50 Gg CO2 / year). For 2022 the
changes per gas
are:

The changes come from the following subsectors:- 1.A: Total sectoral emissions in 2022 are 107066.63
Gg CO2 / year which is 78.7% of category 1 emissions. 2022 Emissions
have changed by 7.8% (7724.66 Gg CO2
/ year). 1990-2022 Emissions have changed by 0.3% (273.98 Gg CO2 / year). For 2022 the
changes per gas
are:

There is no subsector information available in PRIMAP-hist. - 1.B.2: Total sectoral emissions in 2022 are
29063.24 Gg CO2 / year which is 21.3% of category 1 emissions. 2022
Emissions have changed by 7.7%
(2075.39 Gg CO2 / year). 1990-2022 Emissions have changed by 0.4% (112.52 Gg CO2 / year). For 2022 the
changes per gas
are:

There is no subsector information available in PRIMAP-hist.
- 1.A: Total sectoral emissions in 2022 are 107066.63
Gg CO2 / year which is 78.7% of category 1 emissions. 2022 Emissions
have changed by 7.8% (7724.66 Gg CO2
/ year). 1990-2022 Emissions have changed by 0.3% (273.98 Gg CO2 / year). For 2022 the
changes per gas
are:
- 2: Total sectoral emissions in 2022 are 24249.68 Gg
CO2 / year which is 14.1% of M.0.EL emissions. 2022 Emissions have
changed by 2.3% (547.49 Gg CO2 /
year). 1990-2022 Emissions have changed by -0.2% (-21.24 Gg CO2 / year). For 2022 the
changes per gas
are:

- M.AG: Total sectoral emissions in 2022 are 577.65 Gg CO2 / year which is 0.3% of M.0.EL emissions. 2022 Emissions have changed by -0.7% (-3.90 Gg CO2 / year). 1990-2022 Emissions have changed by -0.0% (-0.02 Gg CO2 / year).
- 4: Total sectoral emissions in 2022 are 10942.67 Gg CO2 / year which is 6.4% of M.0.EL emissions. 2022 Emissions have changed by -1.9% (-217.55 Gg CO2 / year). 1990-2022 Emissions have changed by -0.1% (-6.59 Gg CO2 / year).
- 5: Total sectoral emissions in 2022 are 327.67 Gg
CO2 / year which is 0.2% of M.0.EL emissions. 2022 Emissions have
changed by 8.8% (26.56 Gg CO2 /
year). 1990-2022 Emissions have changed by 0.3% (0.81 Gg CO2 / year). For 2022 the
changes per gas
are:
